
Advertisement
Research ArticleCell biologyClinical ResearchOncology
Open Access |  10.1172/JCI197645
PTEN deficiency confers sensitivity to ATR inhibitor–based treatment in high-grade serous ovarian cancer
Jie Hao,1,2 Bose Kochupurakkal,1,3 Timothy B. Branigan,1,2 Ozge Sezin Somuncu,3,4 Renyan Liu,1,2 Heta Jadhav,1 Alexandre André B. A. da Costa,3,4 Yuqing Jiao,1 Jenny Z. Yu,1 David B. Martignetti,3,4 Golbahar Sadatrezaei,3,4 Sirisha Mukkavalli,3,4 Prafulla C. Gokhale,5 Su-Chun Cheng,6 Steven J. Skates,7 Dimitrios Nasioudis,8 Panagiotis A. Konstantinopoulos,1,2 Joyce F. Liu,1,2 Stephanie Gaillard,9 Robert L. Giuntoli II,8 Lainie Martin,8 Janos Tanyi,8 Nawar Latif,8 Ian Heller,8 Fiona Simpkins,8 Kalindi Parmar,3,4 Alan D. D’Andrea,3,4 and Geoffrey I. Shapiro1,2,3
1Department of Medical Oncology, Dana-Farber Cancer Institute (DFCI), Boston, Massachusetts, USA.
2Department of Medicine, Brigham and Women’s Hospital and Harvard Medical School, Boston, Massachusetts, USA.
3Center for DNA Damage and Repair, DFCI, Boston, Massachusetts, USA.
4Department of Radiation Oncology, DFCI and Harvard Medical School, Boston, Massachusetts, USA.
5Belfer Center for Applied Cancer Science, DFCI, Boston, Massachusetts, USA.
6Department of Data Science, DFCI and Harvard H.T. Chan School of Public Health, Boston, Massachusetts, USA.
7Massachusetts General Hospital Biostatistics and Harvard Medical School, Boston, Massachusetts, USA.
8Ovarian Cancer Research Center, Perelman School of Medicine, University of Pennsylvania, Philadelphia, Pennsylvania, USA.
9Departments of Oncology and Gynecology and Obstetrics, Johns Hopkins University School of Medicine, Baltimore, Maryland, USA.
Address correspondence to: Geoffrey I. Shapiro, Dana-Farber Cancer Institute, 450 Brookline Avenue, Mayer 446, Boston, Massachusetts, USA. Phone: 617.632.4942; geoffrey_shapiro@dfci.harvard.edu.
Authorship note: BK and TBB contributed equally to this work.
Find articles by Hao, J. in: PubMed | Google Scholar
1Department of Medical Oncology, Dana-Farber Cancer Institute (DFCI), Boston, Massachusetts, USA.
2Department of Medicine, Brigham and Women’s Hospital and Harvard Medical School, Boston, Massachusetts, USA.
3Center for DNA Damage and Repair, DFCI, Boston, Massachusetts, USA.
4Department of Radiation Oncology, DFCI and Harvard Medical School, Boston, Massachusetts, USA.
5Belfer Center for Applied Cancer Science, DFCI, Boston, Massachusetts, USA.
6Department of Data Science, DFCI and Harvard H.T. Chan School of Public Health, Boston, Massachusetts, USA.
7Massachusetts General Hospital Biostatistics and Harvard Medical School, Boston, Massachusetts, USA.
8Ovarian Cancer Research Center, Perelman School of Medicine, University of Pennsylvania, Philadelphia, Pennsylvania, USA.
9Departments of Oncology and Gynecology and Obstetrics, Johns Hopkins University School of Medicine, Baltimore, Maryland, USA.
Address correspondence to: Geoffrey I. Shapiro, Dana-Farber Cancer Institute, 450 Brookline Avenue, Mayer 446, Boston, Massachusetts, USA. Phone: 617.632.4942; geoffrey_shapiro@dfci.harvard.edu.
Authorship note: BK and TBB contributed equally to this work.
Find articles by Kochupurakkal, B. in: PubMed | Google Scholar
1Department of Medical Oncology, Dana-Farber Cancer Institute (DFCI), Boston, Massachusetts, USA.
2Department of Medicine, Brigham and Women’s Hospital and Harvard Medical School, Boston, Massachusetts, USA.
3Center for DNA Damage and Repair, DFCI, Boston, Massachusetts, USA.
4Department of Radiation Oncology, DFCI and Harvard Medical School, Boston, Massachusetts, USA.
5Belfer Center for Applied Cancer Science, DFCI, Boston, Massachusetts, USA.
6Department of Data Science, DFCI and Harvard H.T. Chan School of Public Health, Boston, Massachusetts, USA.
7Massachusetts General Hospital Biostatistics and Harvard Medical School, Boston, Massachusetts, USA.
8Ovarian Cancer Research Center, Perelman School of Medicine, University of Pennsylvania, Philadelphia, Pennsylvania, USA.
9Departments of Oncology and Gynecology and Obstetrics, Johns Hopkins University School of Medicine, Baltimore, Maryland, USA.
Address correspondence to: Geoffrey I. Shapiro, Dana-Farber Cancer Institute, 450 Brookline Avenue, Mayer 446, Boston, Massachusetts, USA. Phone: 617.632.4942; geoffrey_shapiro@dfci.harvard.edu.
Authorship note: BK and TBB contributed equally to this work.
Find articles by Branigan, T. in: PubMed | Google Scholar
1Department of Medical Oncology, Dana-Farber Cancer Institute (DFCI), Boston, Massachusetts, USA.
2Department of Medicine, Brigham and Women’s Hospital and Harvard Medical School, Boston, Massachusetts, USA.
3Center for DNA Damage and Repair, DFCI, Boston, Massachusetts, USA.
4Department of Radiation Oncology, DFCI and Harvard Medical School, Boston, Massachusetts, USA.
5Belfer Center for Applied Cancer Science, DFCI, Boston, Massachusetts, USA.
6Department of Data Science, DFCI and Harvard H.T. Chan School of Public Health, Boston, Massachusetts, USA.
7Massachusetts General Hospital Biostatistics and Harvard Medical School, Boston, Massachusetts, USA.
8Ovarian Cancer Research Center, Perelman School of Medicine, University of Pennsylvania, Philadelphia, Pennsylvania, USA.
9Departments of Oncology and Gynecology and Obstetrics, Johns Hopkins University School of Medicine, Baltimore, Maryland, USA.
Address correspondence to: Geoffrey I. Shapiro, Dana-Farber Cancer Institute, 450 Brookline Avenue, Mayer 446, Boston, Massachusetts, USA. Phone: 617.632.4942; geoffrey_shapiro@dfci.harvard.edu.
Authorship note: BK and TBB contributed equally to this work.
Find articles by Somuncu, O. in: PubMed | Google Scholar
1Department of Medical Oncology, Dana-Farber Cancer Institute (DFCI), Boston, Massachusetts, USA.
2Department of Medicine, Brigham and Women’s Hospital and Harvard Medical School, Boston, Massachusetts, USA.
3Center for DNA Damage and Repair, DFCI, Boston, Massachusetts, USA.
4Department of Radiation Oncology, DFCI and Harvard Medical School, Boston, Massachusetts, USA.
5Belfer Center for Applied Cancer Science, DFCI, Boston, Massachusetts, USA.
6Department of Data Science, DFCI and Harvard H.T. Chan School of Public Health, Boston, Massachusetts, USA.
7Massachusetts General Hospital Biostatistics and Harvard Medical School, Boston, Massachusetts, USA.
8Ovarian Cancer Research Center, Perelman School of Medicine, University of Pennsylvania, Philadelphia, Pennsylvania, USA.
9Departments of Oncology and Gynecology and Obstetrics, Johns Hopkins University School of Medicine, Baltimore, Maryland, USA.
Address correspondence to: Geoffrey I. Shapiro, Dana-Farber Cancer Institute, 450 Brookline Avenue, Mayer 446, Boston, Massachusetts, USA. Phone: 617.632.4942; geoffrey_shapiro@dfci.harvard.edu.
Authorship note: BK and TBB contributed equally to this work.
Find articles by Liu, R. in: PubMed | Google Scholar
1Department of Medical Oncology, Dana-Farber Cancer Institute (DFCI), Boston, Massachusetts, USA.
2Department of Medicine, Brigham and Women’s Hospital and Harvard Medical School, Boston, Massachusetts, USA.
3Center for DNA Damage and Repair, DFCI, Boston, Massachusetts, USA.
4Department of Radiation Oncology, DFCI and Harvard Medical School, Boston, Massachusetts, USA.
5Belfer Center for Applied Cancer Science, DFCI, Boston, Massachusetts, USA.
6Department of Data Science, DFCI and Harvard H.T. Chan School of Public Health, Boston, Massachusetts, USA.
7Massachusetts General Hospital Biostatistics and Harvard Medical School, Boston, Massachusetts, USA.
8Ovarian Cancer Research Center, Perelman School of Medicine, University of Pennsylvania, Philadelphia, Pennsylvania, USA.
9Departments of Oncology and Gynecology and Obstetrics, Johns Hopkins University School of Medicine, Baltimore, Maryland, USA.
Address correspondence to: Geoffrey I. Shapiro, Dana-Farber Cancer Institute, 450 Brookline Avenue, Mayer 446, Boston, Massachusetts, USA. Phone: 617.632.4942; geoffrey_shapiro@dfci.harvard.edu.
Authorship note: BK and TBB contributed equally to this work.
Find articles by Jadhav, H. in: PubMed | Google Scholar
1Department of Medical Oncology, Dana-Farber Cancer Institute (DFCI), Boston, Massachusetts, USA.
2Department of Medicine, Brigham and Women’s Hospital and Harvard Medical School, Boston, Massachusetts, USA.
3Center for DNA Damage and Repair, DFCI, Boston, Massachusetts, USA.
4Department of Radiation Oncology, DFCI and Harvard Medical School, Boston, Massachusetts, USA.
5Belfer Center for Applied Cancer Science, DFCI, Boston, Massachusetts, USA.
6Department of Data Science, DFCI and Harvard H.T. Chan School of Public Health, Boston, Massachusetts, USA.
7Massachusetts General Hospital Biostatistics and Harvard Medical School, Boston, Massachusetts, USA.
8Ovarian Cancer Research Center, Perelman School of Medicine, University of Pennsylvania, Philadelphia, Pennsylvania, USA.
9Departments of Oncology and Gynecology and Obstetrics, Johns Hopkins University School of Medicine, Baltimore, Maryland, USA.
Address correspondence to: Geoffrey I. Shapiro, Dana-Farber Cancer Institute, 450 Brookline Avenue, Mayer 446, Boston, Massachusetts, USA. Phone: 617.632.4942; geoffrey_shapiro@dfci.harvard.edu.
Authorship note: BK and TBB contributed equally to this work.
Find articles by da Costa, A. in: PubMed | Google Scholar
1Department of Medical Oncology, Dana-Farber Cancer Institute (DFCI), Boston, Massachusetts, USA.
2Department of Medicine, Brigham and Women’s Hospital and Harvard Medical School, Boston, Massachusetts, USA.
3Center for DNA Damage and Repair, DFCI, Boston, Massachusetts, USA.
4Department of Radiation Oncology, DFCI and Harvard Medical School, Boston, Massachusetts, USA.
5Belfer Center for Applied Cancer Science, DFCI, Boston, Massachusetts, USA.
6Department of Data Science, DFCI and Harvard H.T. Chan School of Public Health, Boston, Massachusetts, USA.
7Massachusetts General Hospital Biostatistics and Harvard Medical School, Boston, Massachusetts, USA.
8Ovarian Cancer Research Center, Perelman School of Medicine, University of Pennsylvania, Philadelphia, Pennsylvania, USA.
9Departments of Oncology and Gynecology and Obstetrics, Johns Hopkins University School of Medicine, Baltimore, Maryland, USA.
Address correspondence to: Geoffrey I. Shapiro, Dana-Farber Cancer Institute, 450 Brookline Avenue, Mayer 446, Boston, Massachusetts, USA. Phone: 617.632.4942; geoffrey_shapiro@dfci.harvard.edu.
Authorship note: BK and TBB contributed equally to this work.
Find articles by Jiao, Y. in: PubMed | Google Scholar
1Department of Medical Oncology, Dana-Farber Cancer Institute (DFCI), Boston, Massachusetts, USA.
2Department of Medicine, Brigham and Women’s Hospital and Harvard Medical School, Boston, Massachusetts, USA.
3Center for DNA Damage and Repair, DFCI, Boston, Massachusetts, USA.
4Department of Radiation Oncology, DFCI and Harvard Medical School, Boston, Massachusetts, USA.
5Belfer Center for Applied Cancer Science, DFCI, Boston, Massachusetts, USA.
6Department of Data Science, DFCI and Harvard H.T. Chan School of Public Health, Boston, Massachusetts, USA.
7Massachusetts General Hospital Biostatistics and Harvard Medical School, Boston, Massachusetts, USA.
8Ovarian Cancer Research Center, Perelman School of Medicine, University of Pennsylvania, Philadelphia, Pennsylvania, USA.
9Departments of Oncology and Gynecology and Obstetrics, Johns Hopkins University School of Medicine, Baltimore, Maryland, USA.
Address correspondence to: Geoffrey I. Shapiro, Dana-Farber Cancer Institute, 450 Brookline Avenue, Mayer 446, Boston, Massachusetts, USA. Phone: 617.632.4942; geoffrey_shapiro@dfci.harvard.edu.
Authorship note: BK and TBB contributed equally to this work.
Find articles by Yu, J. in: PubMed | Google Scholar
1Department of Medical Oncology, Dana-Farber Cancer Institute (DFCI), Boston, Massachusetts, USA.
2Department of Medicine, Brigham and Women’s Hospital and Harvard Medical School, Boston, Massachusetts, USA.
3Center for DNA Damage and Repair, DFCI, Boston, Massachusetts, USA.
4Department of Radiation Oncology, DFCI and Harvard Medical School, Boston, Massachusetts, USA.
5Belfer Center for Applied Cancer Science, DFCI, Boston, Massachusetts, USA.
6Department of Data Science, DFCI and Harvard H.T. Chan School of Public Health, Boston, Massachusetts, USA.
7Massachusetts General Hospital Biostatistics and Harvard Medical School, Boston, Massachusetts, USA.
8Ovarian Cancer Research Center, Perelman School of Medicine, University of Pennsylvania, Philadelphia, Pennsylvania, USA.
9Departments of Oncology and Gynecology and Obstetrics, Johns Hopkins University School of Medicine, Baltimore, Maryland, USA.
Address correspondence to: Geoffrey I. Shapiro, Dana-Farber Cancer Institute, 450 Brookline Avenue, Mayer 446, Boston, Massachusetts, USA. Phone: 617.632.4942; geoffrey_shapiro@dfci.harvard.edu.
Authorship note: BK and TBB contributed equally to this work.
Find articles by Martignetti, D. in: PubMed | Google Scholar
1Department of Medical Oncology, Dana-Farber Cancer Institute (DFCI), Boston, Massachusetts, USA.
2Department of Medicine, Brigham and Women’s Hospital and Harvard Medical School, Boston, Massachusetts, USA.
3Center for DNA Damage and Repair, DFCI, Boston, Massachusetts, USA.
4Department of Radiation Oncology, DFCI and Harvard Medical School, Boston, Massachusetts, USA.
5Belfer Center for Applied Cancer Science, DFCI, Boston, Massachusetts, USA.
6Department of Data Science, DFCI and Harvard H.T. Chan School of Public Health, Boston, Massachusetts, USA.
7Massachusetts General Hospital Biostatistics and Harvard Medical School, Boston, Massachusetts, USA.
8Ovarian Cancer Research Center, Perelman School of Medicine, University of Pennsylvania, Philadelphia, Pennsylvania, USA.
9Departments of Oncology and Gynecology and Obstetrics, Johns Hopkins University School of Medicine, Baltimore, Maryland, USA.
Address correspondence to: Geoffrey I. Shapiro, Dana-Farber Cancer Institute, 450 Brookline Avenue, Mayer 446, Boston, Massachusetts, USA. Phone: 617.632.4942; geoffrey_shapiro@dfci.harvard.edu.
Authorship note: BK and TBB contributed equally to this work.
Find articles by Sadatrezaei, G. in: PubMed | Google Scholar
1Department of Medical Oncology, Dana-Farber Cancer Institute (DFCI), Boston, Massachusetts, USA.
2Department of Medicine, Brigham and Women’s Hospital and Harvard Medical School, Boston, Massachusetts, USA.
3Center for DNA Damage and Repair, DFCI, Boston, Massachusetts, USA.
4Department of Radiation Oncology, DFCI and Harvard Medical School, Boston, Massachusetts, USA.
5Belfer Center for Applied Cancer Science, DFCI, Boston, Massachusetts, USA.
6Department of Data Science, DFCI and Harvard H.T. Chan School of Public Health, Boston, Massachusetts, USA.
7Massachusetts General Hospital Biostatistics and Harvard Medical School, Boston, Massachusetts, USA.
8Ovarian Cancer Research Center, Perelman School of Medicine, University of Pennsylvania, Philadelphia, Pennsylvania, USA.
9Departments of Oncology and Gynecology and Obstetrics, Johns Hopkins University School of Medicine, Baltimore, Maryland, USA.
Address correspondence to: Geoffrey I. Shapiro, Dana-Farber Cancer Institute, 450 Brookline Avenue, Mayer 446, Boston, Massachusetts, USA. Phone: 617.632.4942; geoffrey_shapiro@dfci.harvard.edu.
Authorship note: BK and TBB contributed equally to this work.
Find articles by Mukkavalli, S. in: PubMed | Google Scholar
1Department of Medical Oncology, Dana-Farber Cancer Institute (DFCI), Boston, Massachusetts, USA.
2Department of Medicine, Brigham and Women’s Hospital and Harvard Medical School, Boston, Massachusetts, USA.
3Center for DNA Damage and Repair, DFCI, Boston, Massachusetts, USA.
4Department of Radiation Oncology, DFCI and Harvard Medical School, Boston, Massachusetts, USA.
5Belfer Center for Applied Cancer Science, DFCI, Boston, Massachusetts, USA.
6Department of Data Science, DFCI and Harvard H.T. Chan School of Public Health, Boston, Massachusetts, USA.
7Massachusetts General Hospital Biostatistics and Harvard Medical School, Boston, Massachusetts, USA.
8Ovarian Cancer Research Center, Perelman School of Medicine, University of Pennsylvania, Philadelphia, Pennsylvania, USA.
9Departments of Oncology and Gynecology and Obstetrics, Johns Hopkins University School of Medicine, Baltimore, Maryland, USA.
Address correspondence to: Geoffrey I. Shapiro, Dana-Farber Cancer Institute, 450 Brookline Avenue, Mayer 446, Boston, Massachusetts, USA. Phone: 617.632.4942; geoffrey_shapiro@dfci.harvard.edu.
Authorship note: BK and TBB contributed equally to this work.
Find articles by Gokhale, P. in: PubMed | Google Scholar
1Department of Medical Oncology, Dana-Farber Cancer Institute (DFCI), Boston, Massachusetts, USA.
2Department of Medicine, Brigham and Women’s Hospital and Harvard Medical School, Boston, Massachusetts, USA.
3Center for DNA Damage and Repair, DFCI, Boston, Massachusetts, USA.
4Department of Radiation Oncology, DFCI and Harvard Medical School, Boston, Massachusetts, USA.
5Belfer Center for Applied Cancer Science, DFCI, Boston, Massachusetts, USA.
6Department of Data Science, DFCI and Harvard H.T. Chan School of Public Health, Boston, Massachusetts, USA.
7Massachusetts General Hospital Biostatistics and Harvard Medical School, Boston, Massachusetts, USA.
8Ovarian Cancer Research Center, Perelman School of Medicine, University of Pennsylvania, Philadelphia, Pennsylvania, USA.
9Departments of Oncology and Gynecology and Obstetrics, Johns Hopkins University School of Medicine, Baltimore, Maryland, USA.
Address correspondence to: Geoffrey I. Shapiro, Dana-Farber Cancer Institute, 450 Brookline Avenue, Mayer 446, Boston, Massachusetts, USA. Phone: 617.632.4942; geoffrey_shapiro@dfci.harvard.edu.
Authorship note: BK and TBB contributed equally to this work.
Find articles by Cheng, S. in: PubMed | Google Scholar
1Department of Medical Oncology, Dana-Farber Cancer Institute (DFCI), Boston, Massachusetts, USA.
2Department of Medicine, Brigham and Women’s Hospital and Harvard Medical School, Boston, Massachusetts, USA.
3Center for DNA Damage and Repair, DFCI, Boston, Massachusetts, USA.
4Department of Radiation Oncology, DFCI and Harvard Medical School, Boston, Massachusetts, USA.
5Belfer Center for Applied Cancer Science, DFCI, Boston, Massachusetts, USA.
6Department of Data Science, DFCI and Harvard H.T. Chan School of Public Health, Boston, Massachusetts, USA.
7Massachusetts General Hospital Biostatistics and Harvard Medical School, Boston, Massachusetts, USA.
8Ovarian Cancer Research Center, Perelman School of Medicine, University of Pennsylvania, Philadelphia, Pennsylvania, USA.
9Departments of Oncology and Gynecology and Obstetrics, Johns Hopkins University School of Medicine, Baltimore, Maryland, USA.
Address correspondence to: Geoffrey I. Shapiro, Dana-Farber Cancer Institute, 450 Brookline Avenue, Mayer 446, Boston, Massachusetts, USA. Phone: 617.632.4942; geoffrey_shapiro@dfci.harvard.edu.
Authorship note: BK and TBB contributed equally to this work.
Find articles by Skates, S. in: PubMed | Google Scholar
1Department of Medical Oncology, Dana-Farber Cancer Institute (DFCI), Boston, Massachusetts, USA.
2Department of Medicine, Brigham and Women’s Hospital and Harvard Medical School, Boston, Massachusetts, USA.
3Center for DNA Damage and Repair, DFCI, Boston, Massachusetts, USA.
4Department of Radiation Oncology, DFCI and Harvard Medical School, Boston, Massachusetts, USA.
5Belfer Center for Applied Cancer Science, DFCI, Boston, Massachusetts, USA.
6Department of Data Science, DFCI and Harvard H.T. Chan School of Public Health, Boston, Massachusetts, USA.
7Massachusetts General Hospital Biostatistics and Harvard Medical School, Boston, Massachusetts, USA.
8Ovarian Cancer Research Center, Perelman School of Medicine, University of Pennsylvania, Philadelphia, Pennsylvania, USA.
9Departments of Oncology and Gynecology and Obstetrics, Johns Hopkins University School of Medicine, Baltimore, Maryland, USA.
Address correspondence to: Geoffrey I. Shapiro, Dana-Farber Cancer Institute, 450 Brookline Avenue, Mayer 446, Boston, Massachusetts, USA. Phone: 617.632.4942; geoffrey_shapiro@dfci.harvard.edu.
Authorship note: BK and TBB contributed equally to this work.
Find articles by Nasioudis, D. in: PubMed | Google Scholar
1Department of Medical Oncology, Dana-Farber Cancer Institute (DFCI), Boston, Massachusetts, USA.
2Department of Medicine, Brigham and Women’s Hospital and Harvard Medical School, Boston, Massachusetts, USA.
3Center for DNA Damage and Repair, DFCI, Boston, Massachusetts, USA.
4Department of Radiation Oncology, DFCI and Harvard Medical School, Boston, Massachusetts, USA.
5Belfer Center for Applied Cancer Science, DFCI, Boston, Massachusetts, USA.
6Department of Data Science, DFCI and Harvard H.T. Chan School of Public Health, Boston, Massachusetts, USA.
7Massachusetts General Hospital Biostatistics and Harvard Medical School, Boston, Massachusetts, USA.
8Ovarian Cancer Research Center, Perelman School of Medicine, University of Pennsylvania, Philadelphia, Pennsylvania, USA.
9Departments of Oncology and Gynecology and Obstetrics, Johns Hopkins University School of Medicine, Baltimore, Maryland, USA.
Address correspondence to: Geoffrey I. Shapiro, Dana-Farber Cancer Institute, 450 Brookline Avenue, Mayer 446, Boston, Massachusetts, USA. Phone: 617.632.4942; geoffrey_shapiro@dfci.harvard.edu.
Authorship note: BK and TBB contributed equally to this work.
Find articles by Konstantinopoulos, P. in: PubMed | Google Scholar
1Department of Medical Oncology, Dana-Farber Cancer Institute (DFCI), Boston, Massachusetts, USA.
2Department of Medicine, Brigham and Women’s Hospital and Harvard Medical School, Boston, Massachusetts, USA.
3Center for DNA Damage and Repair, DFCI, Boston, Massachusetts, USA.
4Department of Radiation Oncology, DFCI and Harvard Medical School, Boston, Massachusetts, USA.
5Belfer Center for Applied Cancer Science, DFCI, Boston, Massachusetts, USA.
6Department of Data Science, DFCI and Harvard H.T. Chan School of Public Health, Boston, Massachusetts, USA.
7Massachusetts General Hospital Biostatistics and Harvard Medical School, Boston, Massachusetts, USA.
8Ovarian Cancer Research Center, Perelman School of Medicine, University of Pennsylvania, Philadelphia, Pennsylvania, USA.
9Departments of Oncology and Gynecology and Obstetrics, Johns Hopkins University School of Medicine, Baltimore, Maryland, USA.
Address correspondence to: Geoffrey I. Shapiro, Dana-Farber Cancer Institute, 450 Brookline Avenue, Mayer 446, Boston, Massachusetts, USA. Phone: 617.632.4942; geoffrey_shapiro@dfci.harvard.edu.
Authorship note: BK and TBB contributed equally to this work.
Find articles by
Liu, J.
in:
PubMed
|
Google Scholar
|

1Department of Medical Oncology, Dana-Farber Cancer Institute (DFCI), Boston, Massachusetts, USA.
2Department of Medicine, Brigham and Women’s Hospital and Harvard Medical School, Boston, Massachusetts, USA.
3Center for DNA Damage and Repair, DFCI, Boston, Massachusetts, USA.
4Department of Radiation Oncology, DFCI and Harvard Medical School, Boston, Massachusetts, USA.
5Belfer Center for Applied Cancer Science, DFCI, Boston, Massachusetts, USA.
6Department of Data Science, DFCI and Harvard H.T. Chan School of Public Health, Boston, Massachusetts, USA.
7Massachusetts General Hospital Biostatistics and Harvard Medical School, Boston, Massachusetts, USA.
8Ovarian Cancer Research Center, Perelman School of Medicine, University of Pennsylvania, Philadelphia, Pennsylvania, USA.
9Departments of Oncology and Gynecology and Obstetrics, Johns Hopkins University School of Medicine, Baltimore, Maryland, USA.
Address correspondence to: Geoffrey I. Shapiro, Dana-Farber Cancer Institute, 450 Brookline Avenue, Mayer 446, Boston, Massachusetts, USA. Phone: 617.632.4942; geoffrey_shapiro@dfci.harvard.edu.
Authorship note: BK and TBB contributed equally to this work.
Find articles by Gaillard, S. in: PubMed | Google Scholar
1Department of Medical Oncology, Dana-Farber Cancer Institute (DFCI), Boston, Massachusetts, USA.
2Department of Medicine, Brigham and Women’s Hospital and Harvard Medical School, Boston, Massachusetts, USA.
3Center for DNA Damage and Repair, DFCI, Boston, Massachusetts, USA.
4Department of Radiation Oncology, DFCI and Harvard Medical School, Boston, Massachusetts, USA.
5Belfer Center for Applied Cancer Science, DFCI, Boston, Massachusetts, USA.
6Department of Data Science, DFCI and Harvard H.T. Chan School of Public Health, Boston, Massachusetts, USA.
7Massachusetts General Hospital Biostatistics and Harvard Medical School, Boston, Massachusetts, USA.
8Ovarian Cancer Research Center, Perelman School of Medicine, University of Pennsylvania, Philadelphia, Pennsylvania, USA.
9Departments of Oncology and Gynecology and Obstetrics, Johns Hopkins University School of Medicine, Baltimore, Maryland, USA.
Address correspondence to: Geoffrey I. Shapiro, Dana-Farber Cancer Institute, 450 Brookline Avenue, Mayer 446, Boston, Massachusetts, USA. Phone: 617.632.4942; geoffrey_shapiro@dfci.harvard.edu.
Authorship note: BK and TBB contributed equally to this work.
Find articles by Giuntoli, R. in: PubMed | Google Scholar
1Department of Medical Oncology, Dana-Farber Cancer Institute (DFCI), Boston, Massachusetts, USA.
2Department of Medicine, Brigham and Women’s Hospital and Harvard Medical School, Boston, Massachusetts, USA.
3Center for DNA Damage and Repair, DFCI, Boston, Massachusetts, USA.
4Department of Radiation Oncology, DFCI and Harvard Medical School, Boston, Massachusetts, USA.
5Belfer Center for Applied Cancer Science, DFCI, Boston, Massachusetts, USA.
6Department of Data Science, DFCI and Harvard H.T. Chan School of Public Health, Boston, Massachusetts, USA.
7Massachusetts General Hospital Biostatistics and Harvard Medical School, Boston, Massachusetts, USA.
8Ovarian Cancer Research Center, Perelman School of Medicine, University of Pennsylvania, Philadelphia, Pennsylvania, USA.
9Departments of Oncology and Gynecology and Obstetrics, Johns Hopkins University School of Medicine, Baltimore, Maryland, USA.
Address correspondence to: Geoffrey I. Shapiro, Dana-Farber Cancer Institute, 450 Brookline Avenue, Mayer 446, Boston, Massachusetts, USA. Phone: 617.632.4942; geoffrey_shapiro@dfci.harvard.edu.
Authorship note: BK and TBB contributed equally to this work.
Find articles by Martin, L. in: PubMed | Google Scholar
1Department of Medical Oncology, Dana-Farber Cancer Institute (DFCI), Boston, Massachusetts, USA.
2Department of Medicine, Brigham and Women’s Hospital and Harvard Medical School, Boston, Massachusetts, USA.
3Center for DNA Damage and Repair, DFCI, Boston, Massachusetts, USA.
4Department of Radiation Oncology, DFCI and Harvard Medical School, Boston, Massachusetts, USA.
5Belfer Center for Applied Cancer Science, DFCI, Boston, Massachusetts, USA.
6Department of Data Science, DFCI and Harvard H.T. Chan School of Public Health, Boston, Massachusetts, USA.
7Massachusetts General Hospital Biostatistics and Harvard Medical School, Boston, Massachusetts, USA.
8Ovarian Cancer Research Center, Perelman School of Medicine, University of Pennsylvania, Philadelphia, Pennsylvania, USA.
9Departments of Oncology and Gynecology and Obstetrics, Johns Hopkins University School of Medicine, Baltimore, Maryland, USA.
Address correspondence to: Geoffrey I. Shapiro, Dana-Farber Cancer Institute, 450 Brookline Avenue, Mayer 446, Boston, Massachusetts, USA. Phone: 617.632.4942; geoffrey_shapiro@dfci.harvard.edu.
Authorship note: BK and TBB contributed equally to this work.
Find articles by Tanyi, J. in: PubMed | Google Scholar
1Department of Medical Oncology, Dana-Farber Cancer Institute (DFCI), Boston, Massachusetts, USA.
2Department of Medicine, Brigham and Women’s Hospital and Harvard Medical School, Boston, Massachusetts, USA.
3Center for DNA Damage and Repair, DFCI, Boston, Massachusetts, USA.
4Department of Radiation Oncology, DFCI and Harvard Medical School, Boston, Massachusetts, USA.
5Belfer Center for Applied Cancer Science, DFCI, Boston, Massachusetts, USA.
6Department of Data Science, DFCI and Harvard H.T. Chan School of Public Health, Boston, Massachusetts, USA.
7Massachusetts General Hospital Biostatistics and Harvard Medical School, Boston, Massachusetts, USA.
8Ovarian Cancer Research Center, Perelman School of Medicine, University of Pennsylvania, Philadelphia, Pennsylvania, USA.
9Departments of Oncology and Gynecology and Obstetrics, Johns Hopkins University School of Medicine, Baltimore, Maryland, USA.
Address correspondence to: Geoffrey I. Shapiro, Dana-Farber Cancer Institute, 450 Brookline Avenue, Mayer 446, Boston, Massachusetts, USA. Phone: 617.632.4942; geoffrey_shapiro@dfci.harvard.edu.
Authorship note: BK and TBB contributed equally to this work.
Find articles by Latif, N. in: PubMed | Google Scholar
1Department of Medical Oncology, Dana-Farber Cancer Institute (DFCI), Boston, Massachusetts, USA.
2Department of Medicine, Brigham and Women’s Hospital and Harvard Medical School, Boston, Massachusetts, USA.
3Center for DNA Damage and Repair, DFCI, Boston, Massachusetts, USA.
4Department of Radiation Oncology, DFCI and Harvard Medical School, Boston, Massachusetts, USA.
5Belfer Center for Applied Cancer Science, DFCI, Boston, Massachusetts, USA.
6Department of Data Science, DFCI and Harvard H.T. Chan School of Public Health, Boston, Massachusetts, USA.
7Massachusetts General Hospital Biostatistics and Harvard Medical School, Boston, Massachusetts, USA.
8Ovarian Cancer Research Center, Perelman School of Medicine, University of Pennsylvania, Philadelphia, Pennsylvania, USA.
9Departments of Oncology and Gynecology and Obstetrics, Johns Hopkins University School of Medicine, Baltimore, Maryland, USA.
Address correspondence to: Geoffrey I. Shapiro, Dana-Farber Cancer Institute, 450 Brookline Avenue, Mayer 446, Boston, Massachusetts, USA. Phone: 617.632.4942; geoffrey_shapiro@dfci.harvard.edu.
Authorship note: BK and TBB contributed equally to this work.
Find articles by Heller, I. in: PubMed | Google Scholar
1Department of Medical Oncology, Dana-Farber Cancer Institute (DFCI), Boston, Massachusetts, USA.
2Department of Medicine, Brigham and Women’s Hospital and Harvard Medical School, Boston, Massachusetts, USA.
3Center for DNA Damage and Repair, DFCI, Boston, Massachusetts, USA.
4Department of Radiation Oncology, DFCI and Harvard Medical School, Boston, Massachusetts, USA.
5Belfer Center for Applied Cancer Science, DFCI, Boston, Massachusetts, USA.
6Department of Data Science, DFCI and Harvard H.T. Chan School of Public Health, Boston, Massachusetts, USA.
7Massachusetts General Hospital Biostatistics and Harvard Medical School, Boston, Massachusetts, USA.
8Ovarian Cancer Research Center, Perelman School of Medicine, University of Pennsylvania, Philadelphia, Pennsylvania, USA.
9Departments of Oncology and Gynecology and Obstetrics, Johns Hopkins University School of Medicine, Baltimore, Maryland, USA.
Address correspondence to: Geoffrey I. Shapiro, Dana-Farber Cancer Institute, 450 Brookline Avenue, Mayer 446, Boston, Massachusetts, USA. Phone: 617.632.4942; geoffrey_shapiro@dfci.harvard.edu.
Authorship note: BK and TBB contributed equally to this work.
Find articles by Simpkins, F. in: PubMed | Google Scholar
1Department of Medical Oncology, Dana-Farber Cancer Institute (DFCI), Boston, Massachusetts, USA.
2Department of Medicine, Brigham and Women’s Hospital and Harvard Medical School, Boston, Massachusetts, USA.
3Center for DNA Damage and Repair, DFCI, Boston, Massachusetts, USA.
4Department of Radiation Oncology, DFCI and Harvard Medical School, Boston, Massachusetts, USA.
5Belfer Center for Applied Cancer Science, DFCI, Boston, Massachusetts, USA.
6Department of Data Science, DFCI and Harvard H.T. Chan School of Public Health, Boston, Massachusetts, USA.
7Massachusetts General Hospital Biostatistics and Harvard Medical School, Boston, Massachusetts, USA.
8Ovarian Cancer Research Center, Perelman School of Medicine, University of Pennsylvania, Philadelphia, Pennsylvania, USA.
9Departments of Oncology and Gynecology and Obstetrics, Johns Hopkins University School of Medicine, Baltimore, Maryland, USA.
Address correspondence to: Geoffrey I. Shapiro, Dana-Farber Cancer Institute, 450 Brookline Avenue, Mayer 446, Boston, Massachusetts, USA. Phone: 617.632.4942; geoffrey_shapiro@dfci.harvard.edu.
Authorship note: BK and TBB contributed equally to this work.
Find articles by Parmar, K. in: PubMed | Google Scholar
1Department of Medical Oncology, Dana-Farber Cancer Institute (DFCI), Boston, Massachusetts, USA.
2Department of Medicine, Brigham and Women’s Hospital and Harvard Medical School, Boston, Massachusetts, USA.
3Center for DNA Damage and Repair, DFCI, Boston, Massachusetts, USA.
4Department of Radiation Oncology, DFCI and Harvard Medical School, Boston, Massachusetts, USA.
5Belfer Center for Applied Cancer Science, DFCI, Boston, Massachusetts, USA.
6Department of Data Science, DFCI and Harvard H.T. Chan School of Public Health, Boston, Massachusetts, USA.
7Massachusetts General Hospital Biostatistics and Harvard Medical School, Boston, Massachusetts, USA.
8Ovarian Cancer Research Center, Perelman School of Medicine, University of Pennsylvania, Philadelphia, Pennsylvania, USA.
9Departments of Oncology and Gynecology and Obstetrics, Johns Hopkins University School of Medicine, Baltimore, Maryland, USA.
Address correspondence to: Geoffrey I. Shapiro, Dana-Farber Cancer Institute, 450 Brookline Avenue, Mayer 446, Boston, Massachusetts, USA. Phone: 617.632.4942; geoffrey_shapiro@dfci.harvard.edu.
Authorship note: BK and TBB contributed equally to this work.
Find articles by D’Andrea, A. in: PubMed | Google Scholar
1Department of Medical Oncology, Dana-Farber Cancer Institute (DFCI), Boston, Massachusetts, USA.
2Department of Medicine, Brigham and Women’s Hospital and Harvard Medical School, Boston, Massachusetts, USA.
3Center for DNA Damage and Repair, DFCI, Boston, Massachusetts, USA.
4Department of Radiation Oncology, DFCI and Harvard Medical School, Boston, Massachusetts, USA.
5Belfer Center for Applied Cancer Science, DFCI, Boston, Massachusetts, USA.
6Department of Data Science, DFCI and Harvard H.T. Chan School of Public Health, Boston, Massachusetts, USA.
7Massachusetts General Hospital Biostatistics and Harvard Medical School, Boston, Massachusetts, USA.
8Ovarian Cancer Research Center, Perelman School of Medicine, University of Pennsylvania, Philadelphia, Pennsylvania, USA.
9Departments of Oncology and Gynecology and Obstetrics, Johns Hopkins University School of Medicine, Baltimore, Maryland, USA.
Address correspondence to: Geoffrey I. Shapiro, Dana-Farber Cancer Institute, 450 Brookline Avenue, Mayer 446, Boston, Massachusetts, USA. Phone: 617.632.4942; geoffrey_shapiro@dfci.harvard.edu.
Authorship note: BK and TBB contributed equally to this work.
Find articles by
Shapiro, G.
in:
PubMed
|
Google Scholar
|
Published July 7, 2026 - More info
J Clin Invest. 2026;136(16):e197645. https://doi.org/10.1172/JCI197645.
© 2026 Hao et al. This work is licensed under the Creative Commons Attribution 4.0 International License. To view a copy of this license, visit http://creativecommons.org/licenses/by/4.0/.
Received: July 16, 2025; Accepted: June 18, 2026


-
Results
Deficiency of PTEN protein and lipid phosphatase activities confers ATR inhibitor sensitivity. To evaluate the effects of ATR inhibition in PARP inhibitor-resistant HGSOC models, we treated organoid cultures generated from 3 previously characterized BRCA1-mutant patient-derived xenograft (PDX) models (DF59, DF68, and DF101). These PDX-derived organoids (PDXOs) were resistant to PARP inhibition (Figure 1A, left), consistent with the known restoration of HR in these models (14, 32). However, these PDXOs had variable sensitivity to ATR inhibition. Compared with DF59, the PDXOs DF68 and DF101 exhibited markedly higher sensitivity to the ATR inhibitor tuvusertib (M1774) (Figure 1A, right). DF68 and DF101, but not DF59, were reported to have PTEN copy loss based on whole-exome sequencing of the parental PDX models (14). Consistent with these sequencing data, we did not detect PTEN protein expression in the DF68 or DF101 PDXOs by Western blotting (Figure 1B), raising the possibility that PTEN loss increased sensitivity to ATR inhibitor monotherapy.
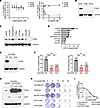 Figure 1
Deficiency of PTEN protein and lipid phosphatase activities confers ATR inhibitor sensitivity. (A) PARP inhibitor–resistant PDXOs of ovarian cancer exhibit variable sensitivity to the ATR inhibitor tuvusertib. Data represent the mean ± SD. (B) Western blot analysis of PTEN expression in PDXO models showing PTEN deficiency in tuvusertib-sensitive models. (C) Western blot analysis of PTEN expression in ovarian cancer cell lines. (D) Colony formation assay evaluating tuvusertib sensitivity across ovarian cancer cell lines. PTEN-deficient TOV21G cells show the highest sensitivity. Data represent the mean ± SD. (E) Western blot analysis of lysates from WT and PTEN CRISPR-KO cells, confirming PTEN loss in KO clones. (F) CellTiter-Glo (CTG) assay showing increased sensitivity of PTEN-KO clones to ATR inhibition. Data represent the mean ± SD. **P < 0.01, ***P < 0.001, and ****P < 0.0001, by 1-way ANOVA with Tukey’s post hoc test. (G) Reexpression of WT and mutant PTEN in PTEN-KO cells via lentiviral transduction. (H) Colony formation assay demonstrating enhanced sensitivity of PTEN-KO cells to tuvusertib and the rescue effect of PTEN reexpression. (I) Quantification of colony formation assays using ImageJ. Data represent the mean ± SD.
To further examine the association of PTEN deficiency with ATR inhibitor sensitivity, we tested PTEN protein expression and tuvusertib sensitivity in 10 additional ovarian cancer cell lines (Figure 1, C and D, and Supplemental Figure 1, A–D; supplemental material available online with this article; https://doi.org/10.1172/JCI197645DS1). TOV21G, an ovarian cancer cell line with known PTEN deletion (33, 34), had no PTEN expression (Figure 1C) and was the most sensitive cell line (Figure 1D). Additionally, we examined PTEN expression and ATR inhibitor sensitivity in the BRCA2-mutant PEO1 and PEO4 cell line pair, which originated from the same patient; however, PEO4 carries a BRCA2 reversion mutation conferring PARP inhibitor resistance (35, 36). Notably, PEO4 cells exhibited higher PTEN expression compared with PEO1 cells. Cell viability assays demonstrated that PTENlo-expressing PEO1 cells were approximately 5 times more sensitive to tuvusertib than PTENhi- expressing PEO4 cells, as confirmed by colony formation assays (Supplemental Figure 1, A–D). Furthermore, HGSOC cell lines in the DepMap datasets harboring PTEN mutations were also more sensitive to the ATR inhibitors ceralasertib (AZD6738), VE-821, and AZ20, as reflected by more negative log2 fold-change values compared with control treatment (Supplemental Figure 1E). Together, these data suggest that ATR inhibitor sensitivity increased with PTEN loss.
To directly assess the effect of PTEN loss on ATR inhibitor sensitivity, we generated PTEN-KO cells from the OVCAR8 cell line using CRISPR/Cas9 technology. Western blots confirmed the absence of PTEN expression in KO clones (Figure 1E). Use of the isogenic pair allowed us to control for confounding baseline genomic alterations that drive replication stress, including TP53 mutation, BRCA1 methylation, CCNE1 gain, and MYC amplification (33, 37–39). Drug sensitivity assays revealed that PTEN-KO cells had significantly lower IC50 values for ATR inhibitors than did PTEN-proficient parental cells (Figure 1F). We further confirmed the effects of PTEN KO in BRCA1/2 WT TYKNU cells, in which PTEN deficiency also increased sensitivity to ATR inhibition (Supplemental Figure 1F). Additionally, PTEN KO in PEO4 conferred tuvusertib sensitivity (Supplemental Figure 1G), similar to that observed in PEO1 cells.
PTEN has both protein phosphatase and lipid phosphatase activities. To determine which of these activities influenced ATR inhibitor sensitivity, we reexpressed WT PTEN and 2 PTEN mutants (C124S and G129E) in PTEN-KO cells using lentiviral vectors. Both protein and lipid phosphatase activities are impaired in the C124S mutant, whereas the G129E mutant is only deficient in lipid phosphatase activity (30). Cells expressing these PTEN mutants were analyzed for tuvusertib sensitivity alongside cells with reexpressed WT PTEN. Western blots confirmed the expression of WT or mutant PTEN and the expected effects on phosphorylated AKT (pAKT) expression (Figure 1G). Colony formation assays indicated that WT PTEN fully restored resistance to tuvusertib, whereas the C124S mutant did not (Figure 1, H and I). The G129E mutant partially restored resistance, suggesting that loss of both protein and lipid phosphatase functions of PTEN contributed to ATR inhibitor sensitivity.
Loss of PTEN leads to uncoupling of helicase and polymerase activities at the replication fork after ATR inhibition, resulting in the accumulation of ssDNA and replication stress. ATR inhibitors induce replication fork dysregulation and compromise cell-cycle checkpoints to promote the accumulation of ssDNA and replication stress that triggers cell death (17, 18). ATR, as well as ATM, will slow replication fork progression under replication stress by phosphorylating S108 on the MCM2 subunit of the replicative MCM helicase (40), effectively acting as replication fork brakes. Upon ATR inhibition, the DNA polymerase stalls as demonstrated by nucleotide incorporation in fiber assays, leading to ssDNA accumulation unless the helicase is simultaneously slowed through alternative pathways. Similar to ATR, PTEN, as a protein phosphatase, can deactivate MCM2 by dephosphorylating the activating S41 site (41), raising the possibility that PTEN-deficient cells will be unable to restrict MCM2 during ATR inhibitor exposure, leading to greater accumulation of ssDNA and exacerbated replication stress.
To determine whether MCM2 regulation was altered in PTEN-deficient cells, we examined MCM2 pS41 and pS108 levels after ATR inhibition by Western blotting (Figure 2A). In both PTEN WT and PTEN-KO cells, we noted induction of ubiquitinated proliferating cell nuclear antigen (Ub-PCNA), a marker of stalled replication forks. However, pMCM2 S41 levels were reduced after ATR inhibition in PTEN WT, but not PTEN-KO, cells. In parallel, MCM2 pS108 levels were upregulated only in WT cells but not in KO cells, indicating a lack of MCM2 restriction after ATR inhibition in PTEN-deficient cells.
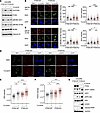 Figure 2
Loss of PTEN leads to uncoupling of helicase and polymerase activities at the replication fork after ATR inhibition, resulting in the accumulation of ssDNA and replication stress. (A) Western blot analysis of chromatin-bound fractions from WT and PTEN-KO cells after ATR inhibitor treatment, showing the expression of pMCM2 and Ub-PCNA. (B and C) Cells were labeled with BrdU (10 μM) for 48 hours, followed by treatment with DMSO or tuvusertib (1 μM) for 16 hours. Cells were then pre-extracted and subjected to native BrdU immunostaining to detect ssDNA. Samples were costained separately with antibodies against either pMCM2 S41 or pMCM2 S108. Original magnification, ×63. Scale bars: 10 μm. Fluorescence intensities were quantified using CellProfiler. (D) Immunofluorescence staining of RPA and γH2AX in OVCAR8 PTEN WT and PTEN-KO cells treated with DMSO or tuvusertib (1 μM) for 24 hours, following pre-extraction. Increased RS and DNA damage were observed in PTEN-deficient cells upon ATR inhibition. Scale bars: 100 μm. (E and F) Quantification of RPA and γH2AX fluorescence intensities using CellProfiler. Each dot represents an individual cell from 3 independent experiments, with at least 200 cells analyzed per experiment. Symbols represent the mean of each biological replicate. (G) Western blot analysis of lysates from OVCAR8 and OVCAR8-PTEN-KO cells treated with tuvusertib (1 μM) for 24 hours. ATR inhibition induces increased replication stress and DNA damage in PTEN-deficient cells. Data are presented as the mean ± SD (n = 3 independent experiments per group). Statistical significance was assessed using biological replicate means by 1-way ANOVA with Tukey’s multiple-comparison test (*P < 0.05, **P < 0.01, ***P < 0.001, and ****P < 0.0001).
To define the catalytic requirements underlying PTEN-mediated regulation of MCM2 phosphorylation, we reconstituted PTEN-deficient cells with WT PTEN or separation-of-function mutants. Reexpression of WT PTEN fully restored physiological MCM2 phosphorylation dynamics in response to ATR inhibition (Supplemental Figure 2A). As expected, the catalytically inactive C124S mutant failed to restore suppression of activating pMCM2 S41 phosphorylation or induction of inhibitory pMCM2 S108 phosphorylation. In contrast, the G129E mutant, which has protein phosphatase but not lipid phosphatase activity, restored the reduction in pMCM2 S41 phosphorylation but failed to promote phosphorylation at the inhibitory S108 site. These findings reveal a dual regulatory mechanism whereby the protein phosphatase activity of PTEN was sufficient to restrain S41 phosphorylation, whereas its lipid phosphatase activity was required to facilitate S108 phosphorylation.
The hyperactivation of MCM2 after ATR inhibition in PTEN-deficient cells was accompanied by a reduction in fork speed (Supplemental Figure 2B). Although the reduction in fork speed was less pronounced in PTEN-KO cells compared with WT cells, persistent MCM2 activation after ATR inhibition in PTEN-KO cells resulted in uncoupling of helicase and polymerase activities with unrestrained DNA unwinding, whereas DNA polymerase activity was impeded.
To validate these findings at the single-cell level and to determine whether impaired MCM2 regulation was associated with ssDNA accumulation, we performed immunofluorescence costaining for pMCM2 S41 or pMCM2 S108 together with native BrdU (Figure 2, B and C). In PTEN-proficient cells, ATR inhibition reduced pMCM2 S41 and increased pMCM2 S108 staining, consistent with our Western blot results (Figure 2A) and with adaptive modulation of helicase activity under replication stress conditions. In contrast, PTEN-deficient cells failed to appropriately downregulate pMCM2 S41 or induce pMCM2 S108 following ATR inhibition. Notably, native BrdU staining was significantly increased in PTEN-deficient cells after ATR inhibition compared with PTEN-proficient cells, indicating enhanced accumulation of ssDNA, supporting the contention that PTEN loss impairs adaptive MCM2 phosphorylation dynamics and is associated with exacerbated replication stress following ATR inhibition.
To determine whether this specific dysregulation was sufficient to drive ssDNA accumulation, we expressed MCM2 phosphomutants in PTEN-proficient cells (Supplemental Figure 2C). Following ATR inhibition, cells expressing either the S41D phosphomimetic mutant or the S108A nonphosphorylatable mutant exhibited significantly increased native BrdU intensity compared with WT MCM2-expressing controls (Supplemental Figure 2D). Strikingly, the S41D/S108A double mutant produced markedly augmented accumulation of ssDNA, effectively phenocopying the elevated BrdU levels observed in PTEN-deficient cells. These data demonstrate that coordinated regulation of MCM2 phosphorylation at S41 and S108 was required to restrict helicase activity and prevent excessive DNA unwinding, and that disruption of this balance caused by PTEN deficiency was sufficient to drive excessive ssDNA accumulation under ATR inhibition.
In addition to native BrdU staining (Figure 2, B and C), we also quantified ssDNA levels using chromatin-bound replication protein A (RPA), a ssDNA-binding protein in PTEN WT and -KO cells treated with tuvusertib. As with native BrdU, the basal level of RPA on chromatin was higher in PTEN-deficient cells than in proficient cells and was further increased by ATR inhibition (Figure 2, D and E). Taken together, these results show that, in response to ATR inhibition, PTEN loss led to induction of pathological replication structures characterized by the accumulation of ssDNA resulting from MCM2 dysregulation.
Because these ssDNA structures resulting from impaired replication induced by ATR inhibition are converted into double-stranded breaks, we also assessed DNA damage and replication stress markers in response to tuvusertib treatment. Higher levels of phosphorylated histone H2AX (γH2AX) were induced by ATR inhibition in PTEN-KO cells compared with PTEN WT cells, as shown by immunofluorescence and Western blotting (Figure 2, D, F, and G). In concentration-dependent and time-course experiments, expression of γH2AX, as well as the replication stress markers phosphorylated Krüppel-associated box (KRAB)-associated protein 1 (pKAP1) and pRPA, was increased at lower concentrations of tuvusertib and earlier after treatment in PTEN-KO cells (Supplemental Figure 2, E and F). Basal levels of pRPA and cleaved PARP in addition to γH2AX were higher in PTEN-KO cells and were further increased after ATR inhibition (Figure 2G), suggesting that a higher degree of replication stress and cell death was induced by ATR inhibition in PTEN-KO cells compared with WT cells. Additionally, PTEN-deficient TOV21G cells exhibited a higher degree of replication stress (pRPA and pKAP1) and DNA damage (γH2AX) after tuvusertib treatment compared with the PTEN-proficient cell lines (Supplemental Figure 2G). Consequently, loss of PTEN predisposed cells to a higher degree of replication stress and DNA damage in response to ATR inhibition, consistent with dysregulation of MCM2 and replication fork dynamics.
PTEN loss alters CHK1 nuclear localization, compromises cell-cycle checkpoint control, and reduces ATM and DNA-PK–mediated compensation after ATR inhibition. The ATR/CHK1 pathway enforces a checkpoint at the S/G2 transition to ensure the completion of DNA replication, but compensation by ATM and DNA–dependent proteinase K (DNA-PK) is a common mechanism by which cells avoid lethality from ATR inhibition (42, 43). ATM and DNA-PK phosphorylate CHK1 at S317 and S345, similar to ATR, to limit cell-cycle progression and the accumulation of replication stress. Phosphorylation of CHK1 at S317 and S345 promotes the retention of CHK1 in the nucleus, supporting its cell-cycle checkpoint functions. In contrast, CHK1 is sequestered in the cytoplasm of PTEN-deficient cells, as loss of the lipid phosphatase activity of PTEN promotes AKT-mediated phosphorylation of CHK1 and its cytoplasmic localization (44). Consistent with this model of CHK1 localization, we observed greater enrichment of CHK1 in the cytoplasmic fraction in PTEN-KO OVCAR8 cells compared with PTEN WT cells (Figure 3A). However, it is unclear how ATR inhibition affects CHK1 localization and whether, in PTEN-deficient cells, PTEN loss or compensatory ATM or DNA-PK activities are dominant in determining CHK1 localization after ATR inhibition.
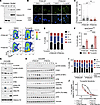 Figure 3
PTEN loss alters CHK1 nuclear localization, compromises cell-cycle checkpoint control, and reduces ATM and DNA-PK–mediated compensation after ATR inhibition. (A) Western blot analysis of nuclear and cytoplasmic fractions from WT and PTEN-KO cells showing CHK1 protein localization and distribution. (B) Immunofluorescence staining for CHK1 in PTEN WT and PTEN-KO cells to confirm subcellular localization changes. Scale bars: 100 μm. (C) Quantification of CHK1 nuclear-to-cytoplasmic fluorescence intensity ratios using CellProfiler. Each dot represents an individual cell from 3 independent experiments, with at least 200 cells analyzed per experiment. Symbols represent the mean of each biological replicate. Data are presented as the mean ± SD (n = 3 independent experiments per group). **P < 0.01; statistical significance was assessed using biological replicate means by 1-way ANOVA with Tukey’s multiple-comparison test. (D) PTEN-proficient and -deficient cells were treated with tuvusertib (1 μM, 24 h) and pulsed with BrdU (10 μM, 30 min). Cells were stained for pHH3, BrdU, and DAPI. Flow cytometric results for BrdU and DAPI are shown. (E) Cell-cycle distribution of PTEN WT and PTEN-KO cells, categorized by G1, G1/S, S, S/G2, and G2/M phases. (F) Quantification of BrdU+ and pHH3hi cells, representing populations undergoing potential mitotic catastrophe. Data represent the mean ± SD. ***P < 0.001 and ****P < 0.0001, by 1-way ANOVA with Tukey’s post hoc test. (G) Western blot analysis of chromatin-bound fractions from cells treated with DMSO or tuvusertib (1 μM, 24 h), confirming reduced ATM and DNA-PK–mediated adaptation in PTEN-deficient cells upon ATR inhibition. (H) Western blot analysis of whole-cell lysates from cells treated with DMSO or tuvusertib (1 μM) over a 24-hour time course, demonstrating reduced ATM and DNA-PK compensation in PTEN-deficient cells following ATR inhibition. (I) Cell-cycle distribution of PTEN WT and PTEN-KO cells treated with DMSO, tuvusertib, or tuvusertib combined with ATM and DNA-PK inhibitors (ATMi + DNA-PKi). (J) CTG assay showing tuvusertib sensitivity in PTEN WT and PTEN-KO cells with or without ATMi + DNA-PKi. Data represent the mean ± SD.
To determine whether the localization of CHK1 is altered by ATR inhibition in PTEN-KO cells, we subjected tuvusertib-treated PTEN-KO and WT cells to immunofluorescence, and the nuclear-to-cytoplasmic ratio of CHK1 was quantified using CellProfiler (Figure 3, B and C). The baseline nuclear-to-cytoplasmic ratio for CHK1 was significantly lower in PTEN-deficient cells. The nuclear-to-cytoplasmic ratio for CHK1 increased after tuvusertib treatment in both PTEN WT and -KO cells, although the degree of increase in PTEN-KO cells was significantly less than in PTEN WT cells. These results indicate that CHK1 nuclear localization after ATR inhibition was impaired by PTEN loss.
We evaluated CHK1 localization in PTEN-deficient cells reconstituted with WT or PTEN catalytic mutants to define the catalytic activities of PTEN underlying CHK1 localization (Supplemental Figure 3A). Reexpression of WT PTEN fully restored nuclear enrichment of CHK1 following ATR inhibition, but neither the catalytically inactive C124S mutant nor the lipid phosphatase–deficient G129E mutant rescued CHK1 nuclear localization. These findings indicate that the lipid phosphatase activity of PTEN was required to promote CHK1 nuclear retention and prevent its cytoplasmic sequestration during replication stress.
The relative reduction in nuclear CHK1 after tuvusertib treatment in PTEN-deficient cells compared with WT cells raised the possibility that PTEN loss compromised cell-cycle checkpoints in the absence of ATR signaling. ATR-CHK1–mediated checkpoint control at the S/G2 transition ensures completion of genome duplication before mitosis and prevents DNA replication, detected by BrdU incorporation, from occurring in high phospho–histone H3 (pHH3hi) mitotic cells. Consequently, when ATR signaling was inhibited, PTEN WT cells accumulated in the S phase, while PTEN-KO cells progressed to the G2/M phase (Figure 3, D and E), suggesting that the S/G2 transition was compromised in PTEN-deficient cells. Additionally, we found that there were more BrdU+ cells with high pHH3 levels in PTEN-deficient OVCAR8 cells after ATR inhibitor exposure (Figure 3F), indicating that these cells were entering mitosis without completing DNA replication, potentially leading to mitotic catastrophe.
To determine if the dysregulated cell-cycle progression observed in PTEN-KO cells after ATR inhibition coincided with impaired ATM- and DNA-PK–mediated compensation, we assessed the levels of pATM and pDNA-PK after tuvusertib treatment. PTEN-KO cells had reduced levels of pATM and pDNA-PK and increased levels of γH2AX after 24 hours of ATR inhibitor treatment compared with PTEN WT cells (Figure 3G), suggesting that ATM/DNA-PK–mediated compensation after ATR inhibition was compromised. In both PTEN WT and -KO cells, phosphorylation of the activating S345 site on CHK1 was absent 2 hours after ATR inhibition (Figure 3H). pCHK1 levels remained low in PTEN-KO cells during the course of ATR inhibitor exposure; in contrast, in PTEN WT cells, pCHK1 levels approached baseline levels after 16 hours of ATR inhibition. These results demonstrate that PTEN WT but not PTEN-KO cells were able to establish robust ATM and DNA-PK–mediated compensation during loss of ATR signaling.
To determine whether this impaired compensation by ATM and DNA-PK following ATR inhibition contributes to the cell-cycle checkpoint defect and ATR inhibitor hypersensitivity observed in PTEN-deficient cells, both ATM and DNA-PK were inhibited during tuvusertib treatment in PTEN WT and -KO cells. Inhibition of ATM and DNA-PK during tuvusertib treatment increased the G2/M population in PTEN WT cells to levels comparable to those observed in PTEN-KO cells (Figure 3I and Supplemental Figure 3B), indicating PTEN loss compromised ATM and DNA-PK–mediated compensation following ATR inhibition. In line with the altered cell-cycle distribution, inhibition of ATM and DNA-PK sensitized PTEN WT cells to tuvusertib, recapitulating the hypersensitive phenotype of PTEN-deficient cells (Figure 3J). In contrast, ATM and DNA-PK inhibition only minimally enhanced ATR inhibitor sensitivity in PTEN-KO cells, suggesting that this compensatory pathway was already compromised in the absence of PTEN. Taken together, these data suggest that PTEN loss prevented the nuclear localization of CHK1 after ATR inhibition, compromised the S/G2 cell-cycle checkpoint leading to premature mitotic entry, and impaired compensatory ATM and DNA-PK activity in response to a loss of ATR signaling.
PTEN loss increases cell death and impairs cellular proliferation after combined ATR and PARP inhibition. The increased G2/M progression in PTEN-KO cells after ATR inhibition raised the possibility that ATR inhibition could induce replication fork instability in PTEN-deficient cells, as mitotic kinase activity prior to the completion of DNA replication triggers replication fork disassembly and collapse (45). As demonstrated by DNA fiber assays, OVCAR8 PTEN-KO cells have lower replication fork stability at baseline compared with WT cells, with further compromise after ATR inhibition (Figure 4A). The effects of ATR inhibition also extended to BRCA1-mutant PARP inhibitor-resistant HGSOC organoid models that demonstrated stable replication forks at baseline. Tuvusertib monotherapy only compromised replication fork stability in the PTEN-deficient DF68 and DF101 models but did not compromise fork stability in the PTEN-proficient DF59 model (Figure 4B, tuvusertib monotherapy treatment vs. vehicle).
 Figure 4
PTEN loss impairs RAD51-mediated fork protection following ATR inhibition. (A) DNA fiber assay assessing replication fork stability in PTEN WT and PTEN-KO cells. IdU and CldU track lengths were measured using ImageJ, and the IdU/CldU ratio was calculated to indicate fork stability. (B) DNA fiber assay in 3 organoid models treated with niraparib, tuvusertib, or their combination. ATR inhibition induced fork instability only in PTEN-deficient models. (C) Western blot analysis of chromatin-bound fractions from PTEN WT and PTEN-KO cells following ATR inhibitor treatment, showing reduced RAD51 accumulation in PTEN-deficient cells. (D) Immunofluorescence staining for RAD51 foci in OVCAR8 PTEN WT and PTEN-KO cells treated with DMSO, niraparib, tuvusertib, or their combination. Scale bars: 10 μm. (E) Quantification of RAD51 foci per cell. Each dot represents an individual DNA fiber (A and B) or cell (E) from 3 independent experiments. Symbols represent the mean value of each biological replicate. Data are presented as the mean ± SD (n = 3 independent experiments per group). At least 100 DNA fibers (A and B) or 200 cells (E) were analyzed per experiment. Statistical analyses were performed using biological replicate means and assessed by 1-way ANOVA with Tukey’s multiple-comparison test (*P < 0.05, **P < 0.01, ***P < 0.001, and ****P < 0.0001).
RAD51 is a CHK1 substrate that plays a critical role in stabilizing replication forks. Given that PTEN-deficient cells have less nuclear CHK1 and diminished CHK1 activation after ATR inhibition, we expected and observed a greater reduction in chromatin-associated RAD51 levels in both OVCAR8 and TYKNU PTEN-KO cells after tuvusertib treatment (Figure 4C and Supplemental Figure 4A).
To further evaluate RAD51 function, we assessed the formation of RAD51 foci in response to tuvusertib. Consistent with the Western blots of chromatin-associated RAD51 (Figure 4C and Supplemental Figure 4A), there were significantly fewer foci only in PTEN-KO cells after ATR inhibition (OVCAR8 RAD51 immunofluorescence shown in Figure 4D with quantification in Figure 4E, left 4 treatment groups; TYKNU quantification in Supplemental Figure 4B). Together, these findings suggest that PTEN loss impaired RAD51-mediated fork protection following ATR inhibition. These results also extended to the formation of RAD51 foci after PARP inhibitor exposure. In response to the PARP inhibitor niraparib, PTEN WT cells mounted a robust accumulation of RAD51 foci that was attenuated but not completely extinguished by ATR inhibition. In contrast, PTEN-KO cells exhibited diminished formation of RAD51 foci in response to PARP inhibition that were further reduced by the addition of ATR inhibition, resulting in a mean of fewer than 5 foci per cell (OVCAR8 shown in Figure 4, D and E, right-hand 4 treatment groups; TYKNU quantification in Supplemental Figure 4B). The loss of RAD51 foci after ATR inhibition in PTEN-KO cells suggests that ATR inhibition may sensitize PTEN-deficient cells to PARP inhibition to a greater degree than PTEN-expressing cells.
The markedly diminished formation of RAD51 foci in PTEN-KO cells following combined ATR and PARP inhibition is expected to translate to reduced replication fork stability. To test this possibility, we assessed fork stability in the PDXO models after treatment with tuvusertib combined with the PARP inhibitor niraparib. Replication fork stability, reduced by ATR inhibitor monotherapy, was further compromised in the PTEN-deficient DF68 and DF101 models by niraparib in the presence of tuvusertib. Notably, fork stability was also compromised by combination treatment in the DF59 model (Figure 4B, combined tuvusertib and niraparib treatments compared with controls).
We also examined ssDNA gap formation in response to these treatments. In ssDNA gap assays, only combination treatment, and not monotherapy, induced ssDNA gaps in the 3 organoid models, irrespective of PTEN expression (Supplemental Figure 4C). The induction of ssDNA gaps along with fork instability in the combination-treated samples suggests that combined ATR and PARP inhibitor therapy synergized through the dysregulation of multiple replication fork pathways.
Consistent with the biological effects on replication fork dynamics, tuvusertib and niraparib combined were synergistic across the models. However, in the PTEN-proficient DF59 model, synergism was only seen at high tuvusertib concentrations, whereas effects in the DF68 and DF101 PTEN-deficient models were observed at substantially lower concentrations (Figure 5A). Similarly, PTEN-deficient cell lines were also more responsive to combined ATR and PARP inhibition, with enhanced synergy in PTEN-KO OVCAR8 cells compared with PTEN WT cells (Figure 5B). The enhanced synergistic effects translated to a greater degree of apoptosis in response to tuvusertib alone or when combined with niraparib in PTEN-KO cells compared with WT cells (Figure 5C). Taken together, our results indicate that PTEN deficiency conferred sensitivity to ATR inhibition but also greater sensitivity to combined ATR and PARP inhibition in HGSOC models.
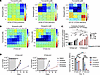 Figure 5
PTEN loss increases cell death and impairs cellular proliferation after combined ATR and PARP inhibition. (A and B) Bliss synergy plots of niraparib and tuvusertib in PDXO models and OVCAR8 cells. (C) Caspase activation assay quantifying apoptosis in OVCAR8 PTEN WT and PTEN-KO cells treated with tuvusertib (0, 1.2, 3.7 nM) with or without niraparib (0.37 μM). Luminescence intensity reflects caspase activity. Data represent the mean ± SD. Statistical significance was determined by 1-way ANOVA with Tukey’s post hoc test (*P < 0.05 and **P < 0.01). (D) Washout experiment in PTEN-proficient and PTEN-deficient cells. After 9 days of treatment, drugs were washed off, and cell regrowth was monitored until day 25. Cell numbers were counted at each time point. Data represent the mean ± SD. Statistical significance was determined by 1-way ANOVA with Tukey’s post hoc test (*P < 0.05, **P < 0.01, ***P < 0.001, and ****P < 0.0001).
In addition to greater effects of combination treatment during drug exposure, we hypothesized that the greater degree of apoptosis may translate to more prolonged effects on tumor cell proliferation in PTEN-deficient versus -proficient cells. To assess this possibility, we conducted washout experiments in OVCAR8 PTEN WT and -KO cells and assessed cell number changes during the treatment period and after drug washout (Figure 5D). As shown previously, PTEN-deficient cells were more sensitive to ATR inhibitor monotherapy than were PTEN-proficient cells. After exposure to combination therapy, the growth of both PTEN-proficient and PTEN-deficient tumor cells was suppressed, but regrowth occurred quickly after treatment removal in PTEN-proficient cells, whereas the inhibitory effect on tumor cell proliferation persisted much longer in PTEN-deficient cells.
PTEN deficiency confers increased sensitivity to ATR and combined ATR/PARP inhibition in vivo. To evaluate the efficacy of combined ATR and PARP inhibition in vivo, we conducted 4-arm experiments using PTEN WT and -KO OVCAR8 xenografts (Figure 6A). Combination therapy resulted in profound tumor growth inhibition in both PTEN-proficient and -deficient tumors; however, regression was primarily observed in mice bearing PTEN-deficient tumors (Figure 6B). Nine of 10 PTEN-deficient xenografts showed a reduction in tumor size during exposure to the combination therapy, whereas 8 of 10 PTEN-proficient xenografts showed some degree of tumor growth. These results confirmed that PTEN-deficient tumors were more sensitive to ATR inhibitor monotherapy and combined ATR/PARP inhibition. Notably, tumor relapse occurred immediately after the dosing period in PTEN-proficient tumors, whereas antitumor effects of the combination therapy persisted much longer in PTEN-deficient xenografts.
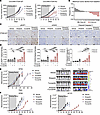 Figure 6
PTEN deficiency confers increased sensitivity to ATR and combined ATR/PARP inhibition in vivo. (A) In vivo xenograft study using OVCAR8 PTEN WT and PTEN-KO cells implanted into nude mice, treated with vehicle, niraparib (45 mg/kg), tuvusertib (25 mg/kg), or their combination for 28 days. PTEN-KO tumors exhibited increased sensitivity to ATR inhibition alone and substantial tumor regression with combination therapy. Tumor growth inhibition persisted longer in the PTEN-KO models after treatment cessation. Data represent the mean ± SEM. (B) Waterfall plot depicting tumor regression in PTEN WT and PTEN-KO groups after combination treatment. PTEN-KO tumors showed a greater size reduction, with 9 of 10 PTEN-KO mice showing tumor growth regression and 8 of 10 PTEN WT mice exhibiting tumor growth inhibition. (C and D) IHC staining of xenograft tumors for pKAP1, γH2AX, and cleaved caspase 3. Tuvusertib alone and in combination with niraparib induced higher levels of replication stress and DNA damage markers, as well as increased apoptosis, in PTEN-deficient tumors compared with PTEN-proficient tumors. Scale bars: 50 μm. Data represent the mean ± SD. Statistical significance was determined by 1-way ANOVA with Tukey’s post hoc test (**P < 0.01, ***P < 0.001, and ****P < 0.0001). (E and F) Efficacy of niraparib, tuvusertib, and their combination in PDX models with PTEN proficiency (DF59) and deficiency (DF68, DF101). PTEN-deficient models exhibited greater sensitivity to tuvusertib monotherapy and sustained tumor growth inhibition following treatment cessation. Data represent the mean ± SEM.
Levels of pKAP1, γH2AX, and cleaved caspase 3 were analyzed in these tumors by IHC to assess replication stress, DNA damage, and apoptosis induced by these treatments (Figure 6, C and D). Tuvusertib alone and in combination with niraparib induced higher levels of pKAP1 and γH2AX in PTEN-deficient tumors compared with PTEN-proficient tumors. We confirmed these results by Western blotting, which also showed higher levels of pRPA at baseline and after ATR inhibitor monotherapy or combination treatment in PTEN-deficient tumors (Supplemental Figure 5). The increased replication stress and DNA damage observed in PTEN-deficient tumors translated to a greater degree of apoptosis in response to ATR inhibition, which was further increased in combination with PARP inhibition, as demonstrated by IHC for cleaved caspase 3 (Figure 6, C and D). As in our in vitro studies, the greater degree of induction of apoptosis in PTEN-deficient cells probably contributed to the persistent antitumor effects of combination treatment after the cessation of dosing (Figure 5D and Figure 6A).
We performed similar experiments using PTEN-proficient (DF59) or PTEN-deficient (DF68 and DF101) PDX models. Consistent with the results in organoid models derived from these PDXs, as well as with the OVCAR8 xenograft data, the PTEN-deficient models DF68 and DF101 showed greater sensitivity to tuvusertib monotherapy than did the DF59 PDX model (Figure 6, E and F). During the treatment period, combined tuvusertib and niraparib produced marked tumor growth inhibition in all 3 PDXs, so that the combination overcame resistance to both monotherapies in the DF59 model. However, upon cessation of dosing, DF59 tumors immediately resumed growth, whereas the PTEN-deficient models demonstrated prolonged tumor growth inhibition well beyond the treatment period. As with OVCAR8 xenografts, IHC showed that the PTEN-deficient DF68 and DF101 models had higher basal levels of pKAP1 and γH2AX, which were further increased by ATR inhibition or combined ATR and PARP inhibition (Supplemental Figure 6A). These findings were further confirmed by Western blotting of xenograft lysates (Supplemental Figure 6B). Additionally, combined treatment increased pKAP1 and γH2AX levels in the PTEN-proficient DF59 model, while PARP inhibition reduced PAR levels in both the DF59 monotherapy and combination therapy cohorts (Supplemental Figure 6, C and D). Consistent with our xenograft model results, the PTEN-deficient DF101 model exhibited a greater degree of apoptosis in response to tuvusertib, either as a monotherapy or in combination with niraparib, compared with the PTEN-proficient DF59 model (Supplemental Figure 6E).
PTEN deficiency confers benefit to ATR inhibitor–based treatment in a clinical trial of combined ATR and PARP inhibition. To explore whether patients with HGSOC expressing low levels of PTEN derive greater benefit from ATR inhibition than those with higher levels of expression, we analyzed PTEN expression in archival, pre-treatment and on-treatment biopsies in patients with platinum-sensitive HGSOC, irrespective of homologous recombination deficiency (HRD) status, who were treated with a combination of the ATR inhibitor ceralasertib combined with olaparib (Combination ATR and PARP Inhibitor [CAPRI]; NCT03462342) (46). PTEN staining was optimized using OVCAR8 WT and PTEN-KO cells (Figure 7A). Across 8 patients in whom we could compare archival and pre-treatment biopsies, there were no statistically significant differences in the levels of PTEN between the 2 groups. Among the 19 patients for whom archival or pre-treatment PTEN was assessable by IHC, those with tumors with lower PTEN expression had improved progression-free survival (PFS) compared with those with PTENhi-expressing tumors (Figure 7B). In addition, patients with tumors expressing low levels of PTEN had a greater degree of tumor reduction (Figure 7C). Interestingly, in 10 matched archival or pre- and on-treatment biopsy pairs, PTEN expression levels tended to rise, suggesting a possible adaptation to combination therapy (Figure 7D). This adaptation also occurred in in vitro experiments in response to PARP or combined PARP and ATR inhibition (Supplemental Figure 7A). Taken together, these data suggest that patients with HGSOC with low PTEN expression experienced improved clinical benefit with combined ATR and PARP inhibitor treatment compared with those with higher PTEN levels.
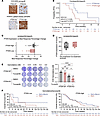 Figure 7
PTEN deficiency confers benefit to ATR inhibitor-based treatment in clinical trials. (A) Representative images of PTEN IHC in HGSOC patient biopsy samples. OVCAR8 WT and PTEN-KO xenograft tumors were used to optimize the staining protocol. Scale bars: 100 μm. (B) Kaplan-Meier survival curves from the CAPRI trial showing that patients with low PTEN expression had improved PFS. (C) Tumor regression percentages plotted for patients based on PTEN expression. Tumors with low PTEN levels showed greater reductions in size. (D) PTEN expression levels in 10 matched archival or pre- and on-treatment biopsy pairs, suggesting potential adaptive changes in response to combination therapy. (E) Colony formation assay showing that combining ATR inhibitor with gemcitabine significantly reduced cell viability in PTEN-KO cells compared with PTEN-WT cells. Statistical significance was determined by 1-way ANOVA with Tukey’s post hoc test (*P < 0.05, **P < 0.01, ***P < 0.001, and ****P < 0.0001). (F) Kaplan-Meier survival curves from a phase II study of gemcitabine (Gem) with or without the ATR inhibitor berzosertib (Berzo) in platinum-resistant ovarian cancer. Patients were stratified by PTEN expression levels. In patients with high PTEN expression, adding ATRi to gemcitabine did not improve overall survival, whereas in patients with low PTEN expression, the combination greatly improved survival compared with gemcitabine alone.
PTEN deficiency confers benefit to ATR inhibitor–based treatment in combination with gemcitabine. ATR inhibition is also being developed as a strategy to exacerbate chemotherapy-induced replication stress. To determine whether low PTEN expression confers broader sensitivity to ATR inhibitor–based therapies beyond combined ATR and PARP inhibition, we tested the combination of tuvusertib and gemcitabine using OVCAR8 cells. In PTEN-KO OVCAR8 cells, tuvusertib significantly increased sensitivity to gemcitabine (Figure 7E). We did not observe this effect in PTEN WT cells. Furthermore, tuvusertib alone, and in combination with gemcitabine, induced higher levels of replication stress and DNA damage biomarkers, including pKAP1, pRPA, and γH2AX, in PTEN-deficient cells compared with PTEN-proficient cells (Supplemental Figure 7B). These findings suggest that ATR inhibition exacerbated gemcitabine-induced replication stress in PTEN-deficient cells, leading to cell death.
To investigate whether the observed replication stress is associated with aberrant DNA helicase activity and DNA polymerase-helicase uncoupling, we examined MCM2 pS41 and pS108 levels after tuvusertib and gemcitabine treatments. Ub-PCNA levels were increased in both PTEN WT and -KO cells upon combination therapy, indicating replication fork stalling (Supplemental Figure 7C). However, MCM2 pS41 levels failed to decrease following tuvusertib and gemcitabine combination treatments in PTEN-KO cells in contrast to PTEN WT cells. Furthermore, unlike in PTEN WT cells, MCM2 pS108 levels were not increased in PTEN-KO cells after combined tuvusertib and gemcitabine treatment. These differential effects on MCM2 phosphorylation suggest higher MCM2 activity after combined ATR inhibition with gemcitabine treatment in PTEN-deficient cells, similar to the MCM2 dysregulation observed with ATR inhibitor monotherapy (Figure 2A). Collectively, these findings suggest that PTEN-deficient cells had increased uncoupling of DNA polymerase and helicase, leading to more replication stress induced by ATR inhibition in combination with gemcitabine.
Finally, we assessed PTEN expression in archival samples from patients with platinum-resistant HGSOC enrolled in a randomized phase II trial of gemcitabine with or without the ATR inhibitor berzosertib (National Cancer Institute [NCI] CTEP 9944; NCT02595892), in which patients receiving the combination experienced a benefit in PFS and numerically improved overall survival (OS) (19, 20). Of the 70 patients enrolled, archival samples for PTEN IHC were available from 58 patients. For patients with tumors expressing high levels of PTEN, the addition of berzosertib did not significantly improve OS (HR, 0.89). In contrast, for patients with tumors expressing low levels of PTEN, there was a trend toward improvement in OS for those receiving the combination therapy (HR, 0.43; Figure 7F), suggesting that low PTEN levels may confer clinical benefit more broadly with ATR inhibitor–based therapies.


Copyright © 2026 American Society for Clinical Investigation
ISSN: 0021-9738 (print), 1558-8238 (online)