
Advertisement
Research ArticleHematologyMetabolismOncology
Open Access |  10.1172/JCI199709
SLC15A3-mediated dipeptide metabolism confers antimetabolite resistance in lymphoma via mTORC1 activation
Haojun Yang,1,2,3 Vincenzo Andrea Zingaro,1,2 Kevin Boardman,1,2 Ashish Noronha,1,2 Ekin Guney,1,2,4,5 Lingru Xue,1,2 Saishma Hoigebazar,1,2 Isabelle Liu,1,2,6 Sohit Miglani,1,2 Siyu Chen,6,7 Hieu Vu,8 Kwun Wah Wen,1,4 Hao G. Nguyen,1,2 Hani Goodarzi,6,7 Ralph J. DeBerardinis,9,10 and Davide Ruggero1,2,11
1Helen Diller Family Comprehensive Cancer Center, and
2Department of Urology, School of Medicine, UCSF, San Francisco, California, USA.
3Department of Pharmacological Sciences, School of Medicine, Stony Brook University, Stony Brook, New York, USA.
4Department of Pathology,
5Department of Neurology, and
6Department of Biochemistry & Biophysics, UCSF, San Francisco, California, USA.
7Arc Institute, Palo Alto, California, USA.
8Department of Pathology and Center of Excellence for Leukemia Studies, St. Jude Children’s Research Hospital, Memphis, Tennessee, USA.
9Eugene McDermott Center for Human Growth and Development, Children’s Research Institute, Department of Pediatrics, and
10Howard Hughes Medical Institute, University of Texas Southwestern Medical Center, Dallas, Texas, USA.
11Department of Cellular and Molecular Pharmacology, UCSF, San Francisco, California, USA.
Address correspondence to: Davide Ruggero, 1450 3rd St., San Francisco, California, 94158, USA. Email: Davide.Ruggero@ucsf.edu. Or to: Haojun Yang, 101 Nicolls Road, Stony Brook, New York, 11794, USA. Email: Haojun.Yang@stonybrook.edu.
Find articles by Yang, H. in: PubMed | Google Scholar
1Helen Diller Family Comprehensive Cancer Center, and
2Department of Urology, School of Medicine, UCSF, San Francisco, California, USA.
3Department of Pharmacological Sciences, School of Medicine, Stony Brook University, Stony Brook, New York, USA.
4Department of Pathology,
5Department of Neurology, and
6Department of Biochemistry & Biophysics, UCSF, San Francisco, California, USA.
7Arc Institute, Palo Alto, California, USA.
8Department of Pathology and Center of Excellence for Leukemia Studies, St. Jude Children’s Research Hospital, Memphis, Tennessee, USA.
9Eugene McDermott Center for Human Growth and Development, Children’s Research Institute, Department of Pediatrics, and
10Howard Hughes Medical Institute, University of Texas Southwestern Medical Center, Dallas, Texas, USA.
11Department of Cellular and Molecular Pharmacology, UCSF, San Francisco, California, USA.
Address correspondence to: Davide Ruggero, 1450 3rd St., San Francisco, California, 94158, USA. Email: Davide.Ruggero@ucsf.edu. Or to: Haojun Yang, 101 Nicolls Road, Stony Brook, New York, 11794, USA. Email: Haojun.Yang@stonybrook.edu.
Find articles by Zingaro, V. in: PubMed | Google Scholar
1Helen Diller Family Comprehensive Cancer Center, and
2Department of Urology, School of Medicine, UCSF, San Francisco, California, USA.
3Department of Pharmacological Sciences, School of Medicine, Stony Brook University, Stony Brook, New York, USA.
4Department of Pathology,
5Department of Neurology, and
6Department of Biochemistry & Biophysics, UCSF, San Francisco, California, USA.
7Arc Institute, Palo Alto, California, USA.
8Department of Pathology and Center of Excellence for Leukemia Studies, St. Jude Children’s Research Hospital, Memphis, Tennessee, USA.
9Eugene McDermott Center for Human Growth and Development, Children’s Research Institute, Department of Pediatrics, and
10Howard Hughes Medical Institute, University of Texas Southwestern Medical Center, Dallas, Texas, USA.
11Department of Cellular and Molecular Pharmacology, UCSF, San Francisco, California, USA.
Address correspondence to: Davide Ruggero, 1450 3rd St., San Francisco, California, 94158, USA. Email: Davide.Ruggero@ucsf.edu. Or to: Haojun Yang, 101 Nicolls Road, Stony Brook, New York, 11794, USA. Email: Haojun.Yang@stonybrook.edu.
Find articles by Boardman, K. in: PubMed | Google Scholar
1Helen Diller Family Comprehensive Cancer Center, and
2Department of Urology, School of Medicine, UCSF, San Francisco, California, USA.
3Department of Pharmacological Sciences, School of Medicine, Stony Brook University, Stony Brook, New York, USA.
4Department of Pathology,
5Department of Neurology, and
6Department of Biochemistry & Biophysics, UCSF, San Francisco, California, USA.
7Arc Institute, Palo Alto, California, USA.
8Department of Pathology and Center of Excellence for Leukemia Studies, St. Jude Children’s Research Hospital, Memphis, Tennessee, USA.
9Eugene McDermott Center for Human Growth and Development, Children’s Research Institute, Department of Pediatrics, and
10Howard Hughes Medical Institute, University of Texas Southwestern Medical Center, Dallas, Texas, USA.
11Department of Cellular and Molecular Pharmacology, UCSF, San Francisco, California, USA.
Address correspondence to: Davide Ruggero, 1450 3rd St., San Francisco, California, 94158, USA. Email: Davide.Ruggero@ucsf.edu. Or to: Haojun Yang, 101 Nicolls Road, Stony Brook, New York, 11794, USA. Email: Haojun.Yang@stonybrook.edu.
Find articles by Noronha, A. in: PubMed | Google Scholar
1Helen Diller Family Comprehensive Cancer Center, and
2Department of Urology, School of Medicine, UCSF, San Francisco, California, USA.
3Department of Pharmacological Sciences, School of Medicine, Stony Brook University, Stony Brook, New York, USA.
4Department of Pathology,
5Department of Neurology, and
6Department of Biochemistry & Biophysics, UCSF, San Francisco, California, USA.
7Arc Institute, Palo Alto, California, USA.
8Department of Pathology and Center of Excellence for Leukemia Studies, St. Jude Children’s Research Hospital, Memphis, Tennessee, USA.
9Eugene McDermott Center for Human Growth and Development, Children’s Research Institute, Department of Pediatrics, and
10Howard Hughes Medical Institute, University of Texas Southwestern Medical Center, Dallas, Texas, USA.
11Department of Cellular and Molecular Pharmacology, UCSF, San Francisco, California, USA.
Address correspondence to: Davide Ruggero, 1450 3rd St., San Francisco, California, 94158, USA. Email: Davide.Ruggero@ucsf.edu. Or to: Haojun Yang, 101 Nicolls Road, Stony Brook, New York, 11794, USA. Email: Haojun.Yang@stonybrook.edu.
Find articles by Guney, E. in: PubMed | Google Scholar
1Helen Diller Family Comprehensive Cancer Center, and
2Department of Urology, School of Medicine, UCSF, San Francisco, California, USA.
3Department of Pharmacological Sciences, School of Medicine, Stony Brook University, Stony Brook, New York, USA.
4Department of Pathology,
5Department of Neurology, and
6Department of Biochemistry & Biophysics, UCSF, San Francisco, California, USA.
7Arc Institute, Palo Alto, California, USA.
8Department of Pathology and Center of Excellence for Leukemia Studies, St. Jude Children’s Research Hospital, Memphis, Tennessee, USA.
9Eugene McDermott Center for Human Growth and Development, Children’s Research Institute, Department of Pediatrics, and
10Howard Hughes Medical Institute, University of Texas Southwestern Medical Center, Dallas, Texas, USA.
11Department of Cellular and Molecular Pharmacology, UCSF, San Francisco, California, USA.
Address correspondence to: Davide Ruggero, 1450 3rd St., San Francisco, California, 94158, USA. Email: Davide.Ruggero@ucsf.edu. Or to: Haojun Yang, 101 Nicolls Road, Stony Brook, New York, 11794, USA. Email: Haojun.Yang@stonybrook.edu.
Find articles by Xue, L. in: PubMed | Google Scholar
1Helen Diller Family Comprehensive Cancer Center, and
2Department of Urology, School of Medicine, UCSF, San Francisco, California, USA.
3Department of Pharmacological Sciences, School of Medicine, Stony Brook University, Stony Brook, New York, USA.
4Department of Pathology,
5Department of Neurology, and
6Department of Biochemistry & Biophysics, UCSF, San Francisco, California, USA.
7Arc Institute, Palo Alto, California, USA.
8Department of Pathology and Center of Excellence for Leukemia Studies, St. Jude Children’s Research Hospital, Memphis, Tennessee, USA.
9Eugene McDermott Center for Human Growth and Development, Children’s Research Institute, Department of Pediatrics, and
10Howard Hughes Medical Institute, University of Texas Southwestern Medical Center, Dallas, Texas, USA.
11Department of Cellular and Molecular Pharmacology, UCSF, San Francisco, California, USA.
Address correspondence to: Davide Ruggero, 1450 3rd St., San Francisco, California, 94158, USA. Email: Davide.Ruggero@ucsf.edu. Or to: Haojun Yang, 101 Nicolls Road, Stony Brook, New York, 11794, USA. Email: Haojun.Yang@stonybrook.edu.
Find articles by Hoigebazar, S. in: PubMed | Google Scholar
1Helen Diller Family Comprehensive Cancer Center, and
2Department of Urology, School of Medicine, UCSF, San Francisco, California, USA.
3Department of Pharmacological Sciences, School of Medicine, Stony Brook University, Stony Brook, New York, USA.
4Department of Pathology,
5Department of Neurology, and
6Department of Biochemistry & Biophysics, UCSF, San Francisco, California, USA.
7Arc Institute, Palo Alto, California, USA.
8Department of Pathology and Center of Excellence for Leukemia Studies, St. Jude Children’s Research Hospital, Memphis, Tennessee, USA.
9Eugene McDermott Center for Human Growth and Development, Children’s Research Institute, Department of Pediatrics, and
10Howard Hughes Medical Institute, University of Texas Southwestern Medical Center, Dallas, Texas, USA.
11Department of Cellular and Molecular Pharmacology, UCSF, San Francisco, California, USA.
Address correspondence to: Davide Ruggero, 1450 3rd St., San Francisco, California, 94158, USA. Email: Davide.Ruggero@ucsf.edu. Or to: Haojun Yang, 101 Nicolls Road, Stony Brook, New York, 11794, USA. Email: Haojun.Yang@stonybrook.edu.
Find articles by Liu, I. in: PubMed | Google Scholar
1Helen Diller Family Comprehensive Cancer Center, and
2Department of Urology, School of Medicine, UCSF, San Francisco, California, USA.
3Department of Pharmacological Sciences, School of Medicine, Stony Brook University, Stony Brook, New York, USA.
4Department of Pathology,
5Department of Neurology, and
6Department of Biochemistry & Biophysics, UCSF, San Francisco, California, USA.
7Arc Institute, Palo Alto, California, USA.
8Department of Pathology and Center of Excellence for Leukemia Studies, St. Jude Children’s Research Hospital, Memphis, Tennessee, USA.
9Eugene McDermott Center for Human Growth and Development, Children’s Research Institute, Department of Pediatrics, and
10Howard Hughes Medical Institute, University of Texas Southwestern Medical Center, Dallas, Texas, USA.
11Department of Cellular and Molecular Pharmacology, UCSF, San Francisco, California, USA.
Address correspondence to: Davide Ruggero, 1450 3rd St., San Francisco, California, 94158, USA. Email: Davide.Ruggero@ucsf.edu. Or to: Haojun Yang, 101 Nicolls Road, Stony Brook, New York, 11794, USA. Email: Haojun.Yang@stonybrook.edu.
Find articles by Miglani, S. in: PubMed | Google Scholar
1Helen Diller Family Comprehensive Cancer Center, and
2Department of Urology, School of Medicine, UCSF, San Francisco, California, USA.
3Department of Pharmacological Sciences, School of Medicine, Stony Brook University, Stony Brook, New York, USA.
4Department of Pathology,
5Department of Neurology, and
6Department of Biochemistry & Biophysics, UCSF, San Francisco, California, USA.
7Arc Institute, Palo Alto, California, USA.
8Department of Pathology and Center of Excellence for Leukemia Studies, St. Jude Children’s Research Hospital, Memphis, Tennessee, USA.
9Eugene McDermott Center for Human Growth and Development, Children’s Research Institute, Department of Pediatrics, and
10Howard Hughes Medical Institute, University of Texas Southwestern Medical Center, Dallas, Texas, USA.
11Department of Cellular and Molecular Pharmacology, UCSF, San Francisco, California, USA.
Address correspondence to: Davide Ruggero, 1450 3rd St., San Francisco, California, 94158, USA. Email: Davide.Ruggero@ucsf.edu. Or to: Haojun Yang, 101 Nicolls Road, Stony Brook, New York, 11794, USA. Email: Haojun.Yang@stonybrook.edu.
Find articles by Chen, S. in: PubMed | Google Scholar
1Helen Diller Family Comprehensive Cancer Center, and
2Department of Urology, School of Medicine, UCSF, San Francisco, California, USA.
3Department of Pharmacological Sciences, School of Medicine, Stony Brook University, Stony Brook, New York, USA.
4Department of Pathology,
5Department of Neurology, and
6Department of Biochemistry & Biophysics, UCSF, San Francisco, California, USA.
7Arc Institute, Palo Alto, California, USA.
8Department of Pathology and Center of Excellence for Leukemia Studies, St. Jude Children’s Research Hospital, Memphis, Tennessee, USA.
9Eugene McDermott Center for Human Growth and Development, Children’s Research Institute, Department of Pediatrics, and
10Howard Hughes Medical Institute, University of Texas Southwestern Medical Center, Dallas, Texas, USA.
11Department of Cellular and Molecular Pharmacology, UCSF, San Francisco, California, USA.
Address correspondence to: Davide Ruggero, 1450 3rd St., San Francisco, California, 94158, USA. Email: Davide.Ruggero@ucsf.edu. Or to: Haojun Yang, 101 Nicolls Road, Stony Brook, New York, 11794, USA. Email: Haojun.Yang@stonybrook.edu.
Find articles by Vu, H. in: PubMed | Google Scholar
1Helen Diller Family Comprehensive Cancer Center, and
2Department of Urology, School of Medicine, UCSF, San Francisco, California, USA.
3Department of Pharmacological Sciences, School of Medicine, Stony Brook University, Stony Brook, New York, USA.
4Department of Pathology,
5Department of Neurology, and
6Department of Biochemistry & Biophysics, UCSF, San Francisco, California, USA.
7Arc Institute, Palo Alto, California, USA.
8Department of Pathology and Center of Excellence for Leukemia Studies, St. Jude Children’s Research Hospital, Memphis, Tennessee, USA.
9Eugene McDermott Center for Human Growth and Development, Children’s Research Institute, Department of Pediatrics, and
10Howard Hughes Medical Institute, University of Texas Southwestern Medical Center, Dallas, Texas, USA.
11Department of Cellular and Molecular Pharmacology, UCSF, San Francisco, California, USA.
Address correspondence to: Davide Ruggero, 1450 3rd St., San Francisco, California, 94158, USA. Email: Davide.Ruggero@ucsf.edu. Or to: Haojun Yang, 101 Nicolls Road, Stony Brook, New York, 11794, USA. Email: Haojun.Yang@stonybrook.edu.
Find articles by Wen, K. in: PubMed | Google Scholar
1Helen Diller Family Comprehensive Cancer Center, and
2Department of Urology, School of Medicine, UCSF, San Francisco, California, USA.
3Department of Pharmacological Sciences, School of Medicine, Stony Brook University, Stony Brook, New York, USA.
4Department of Pathology,
5Department of Neurology, and
6Department of Biochemistry & Biophysics, UCSF, San Francisco, California, USA.
7Arc Institute, Palo Alto, California, USA.
8Department of Pathology and Center of Excellence for Leukemia Studies, St. Jude Children’s Research Hospital, Memphis, Tennessee, USA.
9Eugene McDermott Center for Human Growth and Development, Children’s Research Institute, Department of Pediatrics, and
10Howard Hughes Medical Institute, University of Texas Southwestern Medical Center, Dallas, Texas, USA.
11Department of Cellular and Molecular Pharmacology, UCSF, San Francisco, California, USA.
Address correspondence to: Davide Ruggero, 1450 3rd St., San Francisco, California, 94158, USA. Email: Davide.Ruggero@ucsf.edu. Or to: Haojun Yang, 101 Nicolls Road, Stony Brook, New York, 11794, USA. Email: Haojun.Yang@stonybrook.edu.
Find articles by Nguyen, H. in: PubMed | Google Scholar
1Helen Diller Family Comprehensive Cancer Center, and
2Department of Urology, School of Medicine, UCSF, San Francisco, California, USA.
3Department of Pharmacological Sciences, School of Medicine, Stony Brook University, Stony Brook, New York, USA.
4Department of Pathology,
5Department of Neurology, and
6Department of Biochemistry & Biophysics, UCSF, San Francisco, California, USA.
7Arc Institute, Palo Alto, California, USA.
8Department of Pathology and Center of Excellence for Leukemia Studies, St. Jude Children’s Research Hospital, Memphis, Tennessee, USA.
9Eugene McDermott Center for Human Growth and Development, Children’s Research Institute, Department of Pediatrics, and
10Howard Hughes Medical Institute, University of Texas Southwestern Medical Center, Dallas, Texas, USA.
11Department of Cellular and Molecular Pharmacology, UCSF, San Francisco, California, USA.
Address correspondence to: Davide Ruggero, 1450 3rd St., San Francisco, California, 94158, USA. Email: Davide.Ruggero@ucsf.edu. Or to: Haojun Yang, 101 Nicolls Road, Stony Brook, New York, 11794, USA. Email: Haojun.Yang@stonybrook.edu.
Find articles by Goodarzi, H. in: PubMed | Google Scholar
1Helen Diller Family Comprehensive Cancer Center, and
2Department of Urology, School of Medicine, UCSF, San Francisco, California, USA.
3Department of Pharmacological Sciences, School of Medicine, Stony Brook University, Stony Brook, New York, USA.
4Department of Pathology,
5Department of Neurology, and
6Department of Biochemistry & Biophysics, UCSF, San Francisco, California, USA.
7Arc Institute, Palo Alto, California, USA.
8Department of Pathology and Center of Excellence for Leukemia Studies, St. Jude Children’s Research Hospital, Memphis, Tennessee, USA.
9Eugene McDermott Center for Human Growth and Development, Children’s Research Institute, Department of Pediatrics, and
10Howard Hughes Medical Institute, University of Texas Southwestern Medical Center, Dallas, Texas, USA.
11Department of Cellular and Molecular Pharmacology, UCSF, San Francisco, California, USA.
Address correspondence to: Davide Ruggero, 1450 3rd St., San Francisco, California, 94158, USA. Email: Davide.Ruggero@ucsf.edu. Or to: Haojun Yang, 101 Nicolls Road, Stony Brook, New York, 11794, USA. Email: Haojun.Yang@stonybrook.edu.
Find articles by DeBerardinis, R. in: PubMed | Google Scholar
1Helen Diller Family Comprehensive Cancer Center, and
2Department of Urology, School of Medicine, UCSF, San Francisco, California, USA.
3Department of Pharmacological Sciences, School of Medicine, Stony Brook University, Stony Brook, New York, USA.
4Department of Pathology,
5Department of Neurology, and
6Department of Biochemistry & Biophysics, UCSF, San Francisco, California, USA.
7Arc Institute, Palo Alto, California, USA.
8Department of Pathology and Center of Excellence for Leukemia Studies, St. Jude Children’s Research Hospital, Memphis, Tennessee, USA.
9Eugene McDermott Center for Human Growth and Development, Children’s Research Institute, Department of Pediatrics, and
10Howard Hughes Medical Institute, University of Texas Southwestern Medical Center, Dallas, Texas, USA.
11Department of Cellular and Molecular Pharmacology, UCSF, San Francisco, California, USA.
Address correspondence to: Davide Ruggero, 1450 3rd St., San Francisco, California, 94158, USA. Email: Davide.Ruggero@ucsf.edu. Or to: Haojun Yang, 101 Nicolls Road, Stony Brook, New York, 11794, USA. Email: Haojun.Yang@stonybrook.edu.
Find articles by Ruggero, D. in: PubMed | Google Scholar
Published July 15, 2026 - More info
J Clin Invest. 2026;136(14):e199709. https://doi.org/10.1172/JCI199709.
© 2026 Yang et al. This work is licensed under the Creative Commons Attribution 4.0 International License. To view a copy of this license, visit http://creativecommons.org/licenses/by/4.0/.
Received: September 2, 2025; Accepted: May 6, 2026

Related article:
Abstract
Malignant cells must rapidly synthesize nucleotides to grow and proliferate. Antimetabolite chemotherapies throw a wrench in this process by administering decoy molecules resembling nucleotide precursors that cells cannot use, such as 6-mercaptopurine (6MP) and methotrexate. While this approach remains an essential tool in the treatment of lymphoblastic leukemias and B cell non-Hodgkin lymphomas, approximately 1 in 3 patients will eventually develop therapy-resistant malignancies. In this issue of the JCI, Yang et al. investigated the metabolic adaptations that enable therapy-resistant tumors to grow in the presence of these drugs. Using their previously described mouse model of MYC-driven large B cell lymphoma, they identified that increased expression of the vesicular oligopeptide and histidine transporter SLC15A3 drives dipeptide accumulation in therapy-resistant cells. In lieu of finding other ways to make more nucleotides, these adaptations force cell growth by boosting mTOR signaling. This cunning adaptation, however, is also a vulnerability that can be targeted clinically.
Authors
Carlos Carmona-Fontaine
-
Results
Nucleotide deficiency–resistant large B cell lymphoma upregulates dipeptide metabolism. The Myc oncogene relies on the PRPS2-dependent nucleotide pathway for lymphoma initiation and progression. However, a percentage of Myc-transgenic mice eventually bypass nucleotide deficiency to form tumors (7). To investigate how large B cell lymphoma cancer cells rewire specific metabolic pathways to acquire resistance to PRPS2-mediated nucleotide deficiency, we performed an unbiased ultrahigh performance liquid chromatography-tandem mass spectrometry (UHPLC-MS) metabolomic profiling of B cells isolated from wild-type, Prps2null, Eμ-Myc/+, and Eμ-Myc/+ Prps2null mice as premalignant samples, as well as lymphoma cells from Eμ-Myc/+ and Eμ-Myc/+ Prps2null mice as tumor samples. This profiling identified a total of 529 known metabolites, and their normalized levels (adjusted to Bradford protein concentration) across all mouse genetic backgrounds comparing premalignant cells and tumors, which are presented in the heatmap (Figure 1A and Supplemental Table 1; supplemental material available online with this article; https://doi.org/10.1172/JCI199709DS1). To provide functional context, metabolites were grouped into 8 superpathways based on broad biochemical domains: amino acid, nucleotide, lipid, peptide, carbohydrate, xenobiotic, energy, and cofactors/vitamins. Within tumors, a distinct cluster emerged that clearly distinguished Eμ-Myc/+ from Eμ-Myc/+ Prps2null lymphomas and was enriched in metabolites belonging to the peptide superpathway (Figure 1A). To further quantify metabolic rewiring in response to Prps2 deletion during Myc-driven tumorigenesis, we calculated the differential abundance (DA) score, a summary statistic commonly used in metabolomics enrichment analysis (Figure 1B). The DA score captures the overall direction of change within each pathway by comparing the number of significantly increased versus decreased metabolites. In Eμ-Myc/+ Prps2null tumors, the DA score revealed an overall decrease in the nucleotide superpathway compared with Eμ-Myc/+ lymphomas (Figure 1B). Specifically, Eμ-Myc/+ Prps2null tumors exhibited significant decreases in adenine, cytidine, and thymidine compared with Eμ-Myc/+ lymphomas, along with nonsignificant reductions in AICAR, inosine, and hypoxanthine, as well as in the nucleosides/bases adenosine, guanosine, and guanine (Supplemental Figure 1A and Supplemental Table 1). These data suggest that Myc-overexpressing tumors can circumvent the effects of nucleotide depletion independently of restoring nucleotide levels. Interestingly, the peptide superpathway exhibited the greatest increase among all superpathways in Eμ-Myc/+ Prps2null tumors (Figure 1B). Particularly, we observed an augmentation in dipeptides — peptides composed of 2 amino acids (Supplemental Figure 1B). The significantly upregulated dipeptides predominantly contained glutamine or glycerol paired with essential amino acids, including leucine, isoleucine, and valine (Figure 1C). These findings suggest a specific metabolic reprogramming of dipeptide metabolism in nucleotide-deficient Eμ-Myc/+ Prps2null lymphomas.
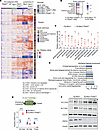 Figure 1
Genetically antinucleotide-resistant lymphoma specifically upregulates dipeptides and their transporter SLC15A3. (A) Heatmap showing relative metabolite levels (compared with WT B cells) of premalignant (PM) B cells from WT, Prps2null, Eμ-Myc/+, and Eμ-Myc/+ Prps2null mice and lymphomas (T) from Eμ-Myc/+, and Eμ-Myc/+ Prps2null mice (n = 5). (B) Differential abundance (DA) score for each superpathway (n = 5). A DA score approaching 1 indicates a coordinated increase in metabolite abundance within the pathway, whereas a score near –1 indicates widespread depletion. (C) Relative levels of significantly altered dipeptides between lymphoma from Eμ-Myc/+ Prps2null and Eμ-Myc/+ mice. (D) Top enriched pathways enriched in genes that are upregulated at both transcriptional and translational levels using BioPlanet pathway enrichment analysis. (E) Relative mRNA expression of indicated genes comparing lymphoma between Eμ-Myc/+ Prps2null and Eμ-Myc/+ mice. (F) Immunoblot analysis of indicated proteins in lymphoma from Eμ-Myc/+ Prps2null and Eμ-Myc/+ mice. β-Actin serves as the loading control. Individual data and mean ± SEM were presented in C and E and analyzed using 2-way ANOVA; *P < 0.05, **P < 0.01; ****P < 0.0001.
As Myc directly regulates both transcription and translation, to gain a deeper understanding of gene expression changes underlying the activation of specific metabolic pathways associated with resistance to nucleotide deficiency, we conducted RNA-seq and Ribo-seq analyses to profile the transcriptome and translatome of Eμ-Myc/+ Prps2null lymphomas in comparison with Eμ-Myc/+ lymphomas. The analysis of these omics approaches revealed that the top enriched pathway in Eμ-Myc/+ Prps2null lymphomas corresponds to Transport of amino acids/oligopeptides, which was upregulated at both the transcriptional and translational levels (Figure 1D, Supplemental Figure 1C, and Supplemental Table 2). This finding is consistent with our metabolomics results showing an increase in the peptide superpathway. Among the proteins belonging to this pathway, we identified SLC15A3, a transporter that is specific for dipeptides (9). B cells express 2 dipeptide transporters, SLC15A3 and SLC15A4 (10, 11). We further validated that only Slc15a3, but not Slc15a4, was upregulated in Eμ-Myc/+ Prps2null lymphomas at the mRNA (Figure 1E) and protein levels (Figure 1F), while there was no increase of SLC15A3 or SLC15A4 in premalignant B cells (Supplemental Figure 1D). In addition to dipeptides, SLC15A3 also transports histidine (9). Consistent with increased Slc15a3 expression, metabolites involved in histidine metabolism were also elevated in Eμ-Myc/+ Prps2null lymphomas (Supplemental Figure 1E). Together, these findings demonstrate a distinct upregulation of dipeptide metabolism and its transporter, SLC15A3, in Myc-driven lymphoma upon nucleotide deprivation.
Pharmacologically nucleotide-deficient B cell lymphomas upregulate SLC15A3 and dipeptide metabolism. To strengthen the clinical significance of our data, we next sought to investigate whether the dipeptide pathway may also contribute to chemotherapy-induced resistance to nucleotide deficiency in human cancer cells. To this end, we generated an antimetabolite-resistant lymphoma cell line. We utilized Ramos cells, a human B lymphocyte cell line derived from a patient with Burkitt lymphoma commonly used as a model for B cell biology and Burkitt lymphoma. We treated Ramos cells with 6MP, a chemotherapy drug that targets the second step after PRPS2 within the purine biosynthesis pathway (Figure 2A) and is widely used in the treatment of lymphoma and leukemia (4, 12, 13). By subjecting the cells to a low-dose, long-term 6MP treatment followed by gradual dose escalation, we established a 6MP-resistant Ramos cell line (6MPR) capable of tolerating up to 10 μM 6MP (Figure 2B). Similar to Eμ-Myc/+ Prps2null lymphomas, SLC15A3 levels were significantly elevated in 6MPR cells at both mRNA levels and protein levels (Figure 2, C and D), while SLC15A4 remained unchanged. In addition, 6MPR Ramos cells exhibited an increase of dipeptide uptake, as demonstrated by treatment with an AMCA-labeled dipeptide (Figure 2E and Supplemental Figure 2A). Knockdown of SLC15A3 in resistant cells significantly decreased the AMCA-labeled dipeptide uptake (Figure 2F and Supplemental Figure 2, B and C).
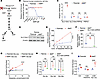 Figure 2
6MP-resistant human lymphomas upregulate SLC15A3 and dipeptide uptake. (A) Schematic of the de novo purine biosynthesis pathway starting from ribose-5-phosphate. (B) Relative cell survival of parental Ramos cells and 6MP-resistant (6MPR) Ramos cells treated with varying concentrations of 6MP for 2 days. (C) Relative mRNA expression levels of SLC15A3 and SLC15A4 in parental and 6MPR Ramos cells. (D) Immunoblot analysis of SLC15A3 protein levels in parental and 6MPR Ramos cells. β-Actin serves as the loading control. (E) Quantification of dipeptide-AMCA (7-amino-4-methylcoumarin-3-acetic acid, a fluorescent reference) levels in cell lysates from parental or 6MPR Ramos cells treated with increasing concentrations of dipeptide-AMCA. (F) Relative dipeptide-AMCA in parental and 6MPR Ramos cells or 6MPR with SLC15A3 shRNA in basal condition. (G) Cell viability of parental and 6MPR Ramos cells treated with varying concentrations of Gly-Leu or Gly-Sar in amino acid–free HBSS medium. (H) Cell viability of parental and 6MPR Ramos cells treated with varying concentrations of 1 mM different dipeptides in amino acid–free HBSS medium. (I) Cell viability of parental and 6MPR Ramos cells treated with 1 mM Gly-Leu or histidine in amino acid–free HBSS medium. Individual data and mean ± SEM were presented in B, C, and E–I, and E–I were analyzed using 2-way ANOVA; *P < 0.05, **P < 0.01; ***P < 0.001; ****P < 0.0001.
To investigate the functional role of upregulated dipeptides in 6MP-resistant cells, we assessed cell viability in amino acid–free HBSS supplemented with Gly-Leu, a dipeptide enriched in Eμ-Myc/+ Prps2null lymphomas. Supplementation with Gly-Leu showed a dose-dependent effect on resistant cell survival but not with a nonhydrolysable dipeptide (Gly-Sar) (Figure 2G). We further examined the dipeptides with another 2 essential amino acids, Gly-Ile and Gly-Val, and found that all dipeptides with essential amino acids selectively enhanced the survival of 6MPR cells but not parental cells. Importantly, downregulation of SLC15A3 attenuated this survival advantage (Figure 2H). In contrast, Gly-Ala, the dipeptide with a nonessential amino acid, failed to enhance resistant cells’ survival, as did supplementation with free histidine (Figure 2I). These findings suggest that antimetabolite-resistant lymphomas upregulate dipeptide metabolism and adopt a novel mechanism to utilize dipeptides as an alternative nutrient source to support survival.
Elevated dipeptides enhance mTORC1 activation in resistant lymphoma through SLC15A3. To investigate how dipeptides contribute to cell survival and resistance, we examined the utilization of dipeptides in antimetabolite-resistant lymphoma. We focused on the significantly upregulated dipeptides, which consist of glycine/glutamine and essential amino acids (Figure 1D). Glycine and glutamine are important for de novo nucleotide biosynthesis; essential amino acids such as leucine, isoleucine, and valine are substrates in branched-chain amino acid (BCAA) metabolism and potent activators of mTORC1 activation, a central regulator of cell proliferation and survival (Figure 3A). One hypothesis is that glycine and glutamine from dipeptides may contribute carbon (from glycine) and nitrogen (from glutamine) atoms, respectively, to fuel nucleotide biosynthesis. To test this, we performed isotope tracing experiments using (13C)-labeled glycine with leucine and (15N)-labeled glutamine with leucine. We detected significant increases in GMP and XMP levels in 6MPR cells derived from the dipeptide of (13C)-labeled glycine with leucine but no changes in pyrimidines from the (AMIDE-15N)-glutamine–containing dipeptide (Figure 3, B and C). Next, we investigated whether the essential amino acid component of the dipeptides supports BCAA metabolism by tracing (13C)-labeled leucine with glutamine. However, no significant differences were found in BCAA pathway metabolites between parental and resistant cells (Figure 3D).
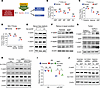 Figure 3
Elevated dipeptides are associated with enhanced mTORC1 activation in resistant lymphomas. (A) Schematic of pathways derived from dipeptide consisting of Gly/Gln with branched-chain amino acids (BCAA). (B) Percentage of 13C within different metabolites from parental or 6MP-resistant Ramos cells treated with (13C) Gly-Leu. (C) Percentage of 15N within different metabolites from parental or 6MP-resistant Ramos cells treated with (15N) Gln-Leu. (D) Percentage of 13C within different metabolites from parental or 6MP-resistant Ramos cells treated with Gln-(13C) Leu. (E) Immunoblot analysis of indicated proteins in Ramos cells treated with different concentrations of Gly-Leu in serum-free medium. (F) Immunoblot analysis of indicated proteins in parental or 6MP-resistant Ramos cells in full medium condition. (Internal control β-actin was the same one from Figure 2D.) (G) Immunoblot analysis of indicated proteins in Eμ-Myc/+ Prps2null and Eμ-Myc/+ lymphomas. (H) Immunoblot analysis of the indicated proteins in parental and 6MP-resistant Ramos cells with or without shRNA-mediated knockdown of SLC15A3 under basal conditions. (I) Relative cell survival of parental and 6MP-resistant Ramos cells with or without SLC15A3 knockdown, treated with vehicle or 6MP for 2 days. (J) Immunoblot analysis of the indicated proteins in parental and 6MP-resistant Ramos cells with or without shRNA-mediated knockdown of SLC38A9 or Sestrin2 under basal conditions. Individual data and mean ± SEM were presented in B–D and I and analyzed using 2-way ANOVA; *P < 0.05, **P < 0.01; ****P < 0.0001.
We then assessed the dipeptides’ effect on the mTORC1 signaling pathway. Similar to leucine alone, short-term Gly-Leu exposure in serum-free medium induced mTORC1 activity, as shown by increased phosphorylation of downstream targets S6 ribosomal protein (P-S6RP) and eukaryotic translation initiation factor 4E-binding protein 1 (P-4EBP1) (Figure 3E). In basal condition, 6MPR cells exhibited elevated mTORC1 activity, as evidenced by a stronger phosphorylation of S6RP (Figure 3F), as well as its upstream kinase P-S6K and another mTORC1 target phospho-ULK1 (Ser757) (Supplemental Figure 3A). Similarly, genetically resistant Eμ-Myc/+ Prps2null lymphoma displayed enhanced mTORC1 activation, particularly elevated P-S6RP levels and P-S6K levels (Figure 3G and Supplemental Figure 3A). As an increase in mTORC1 activity stimulates protein synthesis, we assessed protein synthesis in cells using a puromycin incorporation assay and found an increase in overall translation in 6MPR cells (Supplemental Figure 3B). This result is also consistent with the large subset of genes that show increased translation (more than 2,500 genes with logTER > 0.5, adjusted P < 0.05 in ribosome profiling data) in Eμ-Myc/+ Prps2null lymphomas (Supplemental Figure 3C and Supplemental Table 3). These genes are enriched in Translation and Ribosome proteins pathways, which are known to be activated downstream of mTOR. Further analysis of their 5′ untranslated regions (5′ UTRs) revealed significant enrichment of 5′ terminal oligopyrimidine (5′TOP) motifs, a hallmark of mTOR-dependent translational control (14) (Supplemental Table 4). Together, these results support an increase in mTOR pathway activity observed in resistant lymphoma.
To further investigate the role of dipeptide metabolism in bypassing nucleotide deficiency during MYC-driven lymphomagenesis, we used shRNA to downregulate SLC15A3 in 6MPR Ramos cells. Excitingly, knockdown of SLC15A3 back to parental levels led to a reduction in mTORC1 activity, specifically decreasing P-S6RP levels (Figure 3H), suggesting SLC15A3 is required for the mTOR activation in the resistant cells. Additionally, SLC15A3 downregulation reverted the resistance of 6MPR cells to 6MP treatment (Figure 3I), indicating its essential role in mediating resistance adaptation. To determine whether SLC15A3-driven mTORC1 activation engages the canonical leucine-sensing pathway, we downregulated the lysosomal amino acid transporter SLC38A9 (15) and the leucine sensor Sestrin2 (16) in both parental and 6MPR Ramos cells (Supplemental Figure 3D). Under basal feeding conditions, SLC38A9 knockdown substantially reduced mTOR activity in resistant cells to levels comparable to parental cells, despite persistently elevated SLC15A3 (Figure 3J and Supplemental Figure 3E), indicating that enhanced mTOR activity in resistant cells is SLC38A9 dependent. In contrast, Sestrin2 downregulation increased mTOR activity in parental cells but had no further effect in resistant cells (Figure 3J and Supplemental Figure 3E), suggesting that SLC15A3 upregulation saturates the nutrient-induced mTOR pathway. These data support a model in which SLC15A3 promotes mTORC1 activation through canonical leucine-sensing mechanisms. Together, our findings suggest that lymphomas that bypass nucleotide deficiency reprogram their metabolism to increase dipeptide uptake and that dipeptides containing essential amino acids robustly activate the mTORC1 pathway in an SLC15A3-dependent manner to sustain growth under nucleotide-deficient stress.
Enhanced SLC15A3 and mTOR colocalization in 6MP-resistant cells. SLC15A3 is known to localize to late endosomes and lysosomes, where it facilitates the export of dipeptides/histidine out from the lysosome to the cytosol (9, 17). mTORC1 is activated at the lysosomal surface in response to amino acid sensing, a process mediated by direct interactions with lysosomal amino acid transporters such as SLC38A9, which exports essential amino acids such as leucine from the lysosome (18). We hypothesized that SLC15A3 may regulate mTORC1 activation by interacting with mTOR at the lysosome and transporting dipeptides containing essential amino acids. To test this hypothesis, we used a proximity ligation assay (PLA), a molecular technique that detects protein-protein interactions occurring within a few nanometers. Strikingly, while interactions between SLC15A3 and mTOR were undetectable in parental cells, we observed a robust PLA signal, visualized as distinct red puncta, in 6MPR cells (Figure 4, A and B, and Supplemental Figure 4, A and B). Co-immunoprecipitation confirmed the colocalization between SLC15A3 and mTOR, particularly in 6MPR cells, as confirmed by quantification (Supplemental Figure 4, C and D). Importantly, these PLA puncta partially colocalized with the lysosomal marker LAMP2 (Figure 4, A, C, and D), and this increased in the resistant cells, revealing that SLC15A3 and mTOR are colocalized on the lysosome. Furthermore, we examined whether SLC15A3 lysosomal localization is regulated by nutrient availability. PLA analysis between SLC15A3 and LAMP2 revealed increased lysosomal localization of SLC15A3 following serum and amino acid starvation, as indicated by the presence of SLC15A3–LAMP2 puncta. In contrast, serum refeeding abolished this colocalization (Supplemental Figure 4, E and F), which is consistent with the lower puncta of SLC15A3 and mTOR we observed in the basal parental cells. These findings suggest that SLC15A3 localization and its interaction with mTOR are steps of an adaptive response to stress, such as nutrient or nucleotide deprivation.
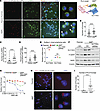 Figure 4
SLC15A3 colocalizes with mTOR in 6MP-resistant lymphoma. (A) Representative images and (B) quantification of proximity ligation assay (PLA) staining (red) using mTOR and SLC15A3 antibodies and LAMP2 (lysosomal-associated membrane protein 2) staining (green), which is a marker for lysosome, in parental 6MP-resistant Ramos cells; white arrows point at the colocalization. (C) Number of LAMP2 and PLA puncta colocalizations per cell in parental 6MP-resistant Ramos cells. (D) Percentage of puncta that colocalize with LAMP2 in parental 6MP-resistant Ramos cells. (E) Relative mRNA levels of Slc15a3 and Slc15a4 in parental and 6MP-resistant Eμ-Myc/+ lymphoma cells without or with shRNA-mediated knockdown of Slc15a3. (F) Immunoblot analysis of the indicated proteins in parental and 6MP-resistant Eμ-Myc/+ lymphoma cells under basal conditions. (G) Relative cell survival of parental and 6MP-resistant Eμ-Myc/+ lymphoma cells with or without shRNA-mediated Slc15a3 knockdown, treated with vehicle or 6MP for 2 days. (H) Representative images and (I) quantification of PLA staining (red) using mTOR and SLC15A3 antibodies and LAMP2 staining (green) in parental 6MP-resistant Eμ-Myc/+ lymphoma cells. Individual data and mean ± SEM were shown in B–E, G, and I. B, C, and I were analyzed using 2-sided t test, and E and G were analyzed using 2-way ANOVA; **P < 0.01; ****P < 0.0001.
We extended this analysis to a transplantable Eμ-Myc/+ lymphoma model derived from Eμ-Myc/+ mice (19), and using the same method, we generated a 6MPR line (Figure 4G). These resistant lymphomas recapitulated key features observed in Ramos cells, including increased SLC15A3 but not SLC15A4 expression (Figure 4E), enhanced mTOR pathway as evidenced by elevated P-S6RP levels, and reduced mTORC1 activity upon knockdown of SLC15A3 and restored sensitivity to 6MP (Figure 4, F and G). Consistently, SLC15A3 showed increased colocalization with mTOR in these resistant Eμ-Myc/+ lymphoma cells (Figure 4, H and I). In addition, we assessed lysosomal acidification and function using acridine orange staining, which revealed increased lysosomal acidification in both resistant Ramos cells and the resistant Eμ-Myc/+ lymphoma line (Supplemental Figure 5, A and B). These findings support a model in which antimetabolite-resistant lymphoma cells cope with stress by upregulating SLC15A3, thereby driving mTORC1 activation through direct engagement of mTOR at the lysosome.
Antimetabolite-resistant lymphoma is sensitive to rapamycin. Resistant lymphomas exhibited elevated P-S6RP, leading us to hypothesize that they might be sensitive to the mTOR inhibitor, rapamycin, which primarily targets the S6K/P-S6RP axis but not P-4EBP/eIF4E axis of the mTORC1 pathway (20–23). To test this hypothesis, we treated cells with a titration of rapamycin. While rapamycin had little effect on parental Ramos cells, it significantly impaired the survival of 6MPR cells (Figure 5A). In contrast, consistent with previous studies (24), ATP-competitive mTOR inhibitors that suppress SK6/P-S6RP and the 4EBP/eIF4E axis, such as Rapalink, reduced viability in both parental and resistant cells, with resistant cells showing greater sensitivity (Supplemental Figure 6A). Similarly, 6MPR Eμ-Myc/+ lymphomas also displayed marked sensitivity to rapamycin (Figure 5B) but similar high sensitivity to Rapalink (Supplemental Figure 6B). These findings demonstrate that SLC15A3-driven mTORC1 activation not only promotes resistance to 6MP but also creates a therapeutic vulnerability to rapamycin.
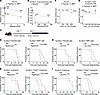 Figure 5
Resistant lymphomas are more sensitive to rapamycin and active VD3. (A) Relative cell survival of parental and 6MP-resistant Ramos cells and (B) Eμ-Myc/+ lymphoma cells treated with different concentrations of rapamycin for 2 days. (C) Scheme of allograft lymphoma mouse model with the drug treatment. (D) Kaplan-Meier survival curves of wild-type B6 mouse tail vein injected with parental (n = 5 for vehicle [veh], n = 9 for drug) or 6MP-resistant Eμ-Myc/+ lymphoma (n = 12 for veh, n = 6 for drug) and (E) wild-type B6 mouse tail vein injected with Eμ-Myc/+ (n = 5 for veh, n = 5 for drug) or Eμ-Myc/+ Prps2null lymphoma (n = 10 for veh, n = 10 for drug), treated with vehicle or rapamycin starting 1 week postinjection. (F) Relative cell survival of parental and 6MP-resistant Ramos cells and (G) Eμ-Myc/+ lymphoma cells treated with different concentrations of 1,25-VD3 for 2 days. (H) Kaplan-Meier survival curves of wild-type B6 mouse tail vein injected with parental (n = 5 for veh, n = 5 for drug) or 6MP-resistant Eμ-Myc/+ lymphoma (n = 5 for veh, n = 6 for drug) and (I) wild-type B6 mouse tail vein injected with Eμ-Myc/+ (n = 5 for veh, n = 5 for drug) or Eμ-Myc/+ Prps2null lymphoma (n = 6 for veh, n = 9 for drug), treated with vehicle or 1,25-VD3 starting 1 week postinjection. Individual data and mean ± SEM were shown in A, B, F, and G and analyzed using 2-way ANOVA; D, E, H, and I were analyzed using log-rank (Mantel-Cox) test; **P < 0.01; ****P < 0.0001. 1,25-VD3, 1,25-dihydroxyvitamin D3.
To assess therapeutic responses of rapamycin in vivo, we established an allograft lymphoma model by intravenously injecting 6MPR Eμ-Myc/+ cells into wild-type B6 mice (Figure 5C). While rapamycin treatment had little effect on mice bearing parental Eμ-Myc/+ lymphoma, it significantly prolonged the survival of mice harboring 6MPR tumors (Figure 5D). We next tested the genetically nucleotide deficiency–resistant lymphoma model by injecting Eμ-Myc/+ or Eμ-Myc/+ Prps2null lymphoma into the wild-type B6 mice. Consistent with the pharmacologically resistant model, rapamycin selectively extended the lifespan of mice bearing the Eμ-Myc/+ Prps2null lymphoma (Figure 5E), which showed no effect on Eμ-Myc/+ tumors. These data support the effectiveness of rapamycin in targeting lymphoma under conditions of nucleotide deficiency.
Antimetabolite-resistant lymphoma is sensitive to active vitamin D3. To explore potential upstream regulators of SLC15A3 in resistant cells for therapeutic tractability, we sought to identify transcription regulators of SLC15A3 by interrogating multiple publicly available transcription factor (TF) datasets, including ARCHS4 TF Coexpression, JASPAR PWM Human 2025, and TF Perturbation–Expression. Across these independent analyses, the vitamin D receptor (VDR) emerged as a consistently predicted TF associated with SLC15A3 expression (Supplemental Table 5 and Supplemental Figure 6C). VDR is a nuclear receptor that functions as a ligand-activated TF upon binding active VD3 (such as 1,25-VD3, a strong VDR ligand), and binds vitamin D response elements in the promoter region to modulate transcription of target genes. We found several strong vitamin D response elements within the SLC15A3 promoter region (Supplemental Figure 6D). VDR has been shown to act as either an activator or repressor depending on the target genes and cell type (25, 26). Interestingly, in our metabolomics data, we found that the VDR ligand 1,25-VD3 was significantly reduced in both 6MP-resistant cells and Eμ-Myc/+ Prps2null tumors (Supplemental Figure 6, E and F). Given that SLC15A3 was upregulated in these resistant cells, we hypothesized that, in this context, VDR may act as a repressor and that reduced levels of its ligand result in increased SLC15A3 expression.
To test this hypothesis, we treated cells with 1,25-VD3 and found that activating the VD3 pathway significantly reduced SLC15A3 expression, with a more pronounced effect in resistant cells, but showed no effect on SLC15A4 (Supplemental Figure 6G). Functionally, 1,25-VD3 treatment attenuated the mTOR pathway specifically in resistant cells (Supplemental Figure 6H) and increased cell death in these cells (Figure 5, F and G). Overexpression of SLC15A3 cDNA rescued this sensitivity (Supplemental Figure 6, I and J), while partial downregulation of SLC15A3 increased sensitivity to 1,25-VD3 (Supplemental Figure 6K). Excitingly, in allograft lymphoma models, active VD3 treatment selectively prolonged the lifespan of mice bearing 6MPR Eμ-Myc/+ cells or Eμ-Myc/+ Prps2null lymphoma but not parental lymphoma (Figure 5, H and I). Together, these observations suggest a role for VDR signaling in modulating SLC15A3 expression and function in resistant lymphoma.
SLC15A3 levels positively correlate with antimetabolite treatment in lymphoma patients and various human cancers. To evaluate the clinical relevance of these findings, we analyzed patient lymphoma biopsies collected before and after antimetabolite chemotherapy. Strikingly, immunofluorescence analysis showed a significant increase of SLC15A3 expression in posttreatment samples from the same patients (Figure 6, A and B), suggesting a similar increase of SLC15A3-dipeptide metabolism occurs in lymphoma after antimetabolite therapy. To extend these observations across different cancer types following antimetabolite treatment, we examined nearly 500 human cancer cell lines using the PRISM Repurposing Public 24Q2 screen. SLC15A3 transcript expression positively correlated with resistance to 6MP (Figure 6C and Supplemental Table 6). A similar significant correlation was observed with methotrexate, another widely used antimetabolite (Figure 6D and Supplemental Table 7). We further generated a methotrexate-resistant Ramos cell line (MTXR; Figure 6E) capable of tolerating up to 1 μM methotrexate. Consistent with 6MPR data, MTXR cells showed increased SLC15A3, but not SLC15A4, expression (Figure 6F) and showed enhanced sensitivity to rapamycin (Figure 6G). These results indicate that antimetabolite-resistant cancer cells upregulate the dipeptide-SLC15A3/mTOR axis and highlight rapamycin, an FDA-approved mTOR inhibitor, as a potential therapeutic strategy for patients with antimetabolite-resistant lymphoma.
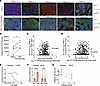 Figure 6
Targeting nucleotide biosynthesis upregulates SLC15A3 in lymphoma patients’ biopsies and various human cancers. (A) Representative image of immunofluorescence of SLC15A3 in lymphoma patients’ biopsies collected before and after antimetabolite chemotherapy. Scale bar = 100 µm. (B) Quantification of SLC15A3 levels in lymphoma patients’ biopsies collected before and after antimetabolite chemotherapy. (C) Two-dimensional plot of the log2 SLC15A3 expression levels compared with the sensitivity of mercaptopurine (6MP) in 487 human cell lines based on PRISM Repurposing Screen. (D) Two-dimensional plot of the log2 SLC15A3 expression levels compared with the sensitivity of methotrexate in 491 human cell lines based on PRISM Repurposing Screen. (E) Relative cell survival of parental Ramos cells and methotrexate-resistant (MTXR) Ramos cells treated with varying concentrations of methotrexate for 2 days. (F) Relative mRNA expression levels of SLC15A3 and SLC15A4 in parental and methotrexate-resistant Ramos cells. (G) Relative cell survival of parental and methotrexate-resistant Ramos cells treated with different concentration of rapamycin for 2 days. Individual data and mean ± SEM were shown in B–G. B was analyzed using 2-sided t test, C and D were analyzed using simple linear regression, and F and G were analyzed using 2-way ANOVA; **P < 0.01; ****P < 0.0001.


Copyright © 2026 American Society for Clinical Investigation
ISSN: 0021-9738 (print), 1558-8238 (online)