
Advertisement
Research ArticleCell biologyHepatologyMetabolism
Open Access |  10.1172/JCI197556
Hepatic glutathione depletion ameliorates MASLD through selective protein oxidation and inhibition of lipogenesis
Xiang-Yu Liu,1,2 Guoxiao Wang,1 Yingying Yu,1 Haopeng Xiao,3,4,5,6 Kentaro Oh-hashi,7,8 Xu Shi,9 Shuning Zheng,9 Robert Gerszten,2,9 and C. Ronald Kahn1
1Section of Integrative Physiology and Metabolism, Joslin Diabetes Center, and Department of Medicine, Harvard Medical School, Boston, Massachusetts, USA.
2Broad Institute of MIT and Harvard, Cambridge, Massachusetts, USA.
3Department of Biochemistry, and
4Stanford Cancer Institute, Stanford University School of Medicine, Stanford, California, USA.
5Department of Cancer Biology, Dana-Farber Cancer Institute, Boston, Massachusetts, USA.
6Department of Cell Biology, Harvard Medical School, Boston, Massachusetts, USA.
7Center for One Medicine Innovative Translational Research (COMIT), Institute for Advanced Study, and
8Department of Chemistry and Biomolecular Science, Faculty of Engineering, Gifu University, Yanagido, Gifu, Japan.
9Division of Cardiovascular Medicine, Beth Israel Deaconess Medical Center, Harvard Medical School, Boston, Massachusetts, USA.
Address correspondence to: C. Ronald Kahn, 3 Blackfan Street, Room 0511, Boston, Massachusetts, 02115, USA. Phone: 617.735.3836; Email: C.Ronald.Kahn@joslin.harvard.edu.
Authorship note: XYL and GXW contributed equally to this work.
Find articles by Liu, X. in: PubMed | Google Scholar
1Section of Integrative Physiology and Metabolism, Joslin Diabetes Center, and Department of Medicine, Harvard Medical School, Boston, Massachusetts, USA.
2Broad Institute of MIT and Harvard, Cambridge, Massachusetts, USA.
3Department of Biochemistry, and
4Stanford Cancer Institute, Stanford University School of Medicine, Stanford, California, USA.
5Department of Cancer Biology, Dana-Farber Cancer Institute, Boston, Massachusetts, USA.
6Department of Cell Biology, Harvard Medical School, Boston, Massachusetts, USA.
7Center for One Medicine Innovative Translational Research (COMIT), Institute for Advanced Study, and
8Department of Chemistry and Biomolecular Science, Faculty of Engineering, Gifu University, Yanagido, Gifu, Japan.
9Division of Cardiovascular Medicine, Beth Israel Deaconess Medical Center, Harvard Medical School, Boston, Massachusetts, USA.
Address correspondence to: C. Ronald Kahn, 3 Blackfan Street, Room 0511, Boston, Massachusetts, 02115, USA. Phone: 617.735.3836; Email: C.Ronald.Kahn@joslin.harvard.edu.
Authorship note: XYL and GXW contributed equally to this work.
Find articles by Wang, G. in: PubMed | Google Scholar
1Section of Integrative Physiology and Metabolism, Joslin Diabetes Center, and Department of Medicine, Harvard Medical School, Boston, Massachusetts, USA.
2Broad Institute of MIT and Harvard, Cambridge, Massachusetts, USA.
3Department of Biochemistry, and
4Stanford Cancer Institute, Stanford University School of Medicine, Stanford, California, USA.
5Department of Cancer Biology, Dana-Farber Cancer Institute, Boston, Massachusetts, USA.
6Department of Cell Biology, Harvard Medical School, Boston, Massachusetts, USA.
7Center for One Medicine Innovative Translational Research (COMIT), Institute for Advanced Study, and
8Department of Chemistry and Biomolecular Science, Faculty of Engineering, Gifu University, Yanagido, Gifu, Japan.
9Division of Cardiovascular Medicine, Beth Israel Deaconess Medical Center, Harvard Medical School, Boston, Massachusetts, USA.
Address correspondence to: C. Ronald Kahn, 3 Blackfan Street, Room 0511, Boston, Massachusetts, 02115, USA. Phone: 617.735.3836; Email: C.Ronald.Kahn@joslin.harvard.edu.
Authorship note: XYL and GXW contributed equally to this work.
Find articles by Yu, Y. in: PubMed | Google Scholar
1Section of Integrative Physiology and Metabolism, Joslin Diabetes Center, and Department of Medicine, Harvard Medical School, Boston, Massachusetts, USA.
2Broad Institute of MIT and Harvard, Cambridge, Massachusetts, USA.
3Department of Biochemistry, and
4Stanford Cancer Institute, Stanford University School of Medicine, Stanford, California, USA.
5Department of Cancer Biology, Dana-Farber Cancer Institute, Boston, Massachusetts, USA.
6Department of Cell Biology, Harvard Medical School, Boston, Massachusetts, USA.
7Center for One Medicine Innovative Translational Research (COMIT), Institute for Advanced Study, and
8Department of Chemistry and Biomolecular Science, Faculty of Engineering, Gifu University, Yanagido, Gifu, Japan.
9Division of Cardiovascular Medicine, Beth Israel Deaconess Medical Center, Harvard Medical School, Boston, Massachusetts, USA.
Address correspondence to: C. Ronald Kahn, 3 Blackfan Street, Room 0511, Boston, Massachusetts, 02115, USA. Phone: 617.735.3836; Email: C.Ronald.Kahn@joslin.harvard.edu.
Authorship note: XYL and GXW contributed equally to this work.
Find articles by
Xiao, H.
in:
PubMed
|
Google Scholar
|

1Section of Integrative Physiology and Metabolism, Joslin Diabetes Center, and Department of Medicine, Harvard Medical School, Boston, Massachusetts, USA.
2Broad Institute of MIT and Harvard, Cambridge, Massachusetts, USA.
3Department of Biochemistry, and
4Stanford Cancer Institute, Stanford University School of Medicine, Stanford, California, USA.
5Department of Cancer Biology, Dana-Farber Cancer Institute, Boston, Massachusetts, USA.
6Department of Cell Biology, Harvard Medical School, Boston, Massachusetts, USA.
7Center for One Medicine Innovative Translational Research (COMIT), Institute for Advanced Study, and
8Department of Chemistry and Biomolecular Science, Faculty of Engineering, Gifu University, Yanagido, Gifu, Japan.
9Division of Cardiovascular Medicine, Beth Israel Deaconess Medical Center, Harvard Medical School, Boston, Massachusetts, USA.
Address correspondence to: C. Ronald Kahn, 3 Blackfan Street, Room 0511, Boston, Massachusetts, 02115, USA. Phone: 617.735.3836; Email: C.Ronald.Kahn@joslin.harvard.edu.
Authorship note: XYL and GXW contributed equally to this work.
Find articles by Oh-hashi, K. in: PubMed | Google Scholar
1Section of Integrative Physiology and Metabolism, Joslin Diabetes Center, and Department of Medicine, Harvard Medical School, Boston, Massachusetts, USA.
2Broad Institute of MIT and Harvard, Cambridge, Massachusetts, USA.
3Department of Biochemistry, and
4Stanford Cancer Institute, Stanford University School of Medicine, Stanford, California, USA.
5Department of Cancer Biology, Dana-Farber Cancer Institute, Boston, Massachusetts, USA.
6Department of Cell Biology, Harvard Medical School, Boston, Massachusetts, USA.
7Center for One Medicine Innovative Translational Research (COMIT), Institute for Advanced Study, and
8Department of Chemistry and Biomolecular Science, Faculty of Engineering, Gifu University, Yanagido, Gifu, Japan.
9Division of Cardiovascular Medicine, Beth Israel Deaconess Medical Center, Harvard Medical School, Boston, Massachusetts, USA.
Address correspondence to: C. Ronald Kahn, 3 Blackfan Street, Room 0511, Boston, Massachusetts, 02115, USA. Phone: 617.735.3836; Email: C.Ronald.Kahn@joslin.harvard.edu.
Authorship note: XYL and GXW contributed equally to this work.
Find articles by Shi, X. in: PubMed | Google Scholar
1Section of Integrative Physiology and Metabolism, Joslin Diabetes Center, and Department of Medicine, Harvard Medical School, Boston, Massachusetts, USA.
2Broad Institute of MIT and Harvard, Cambridge, Massachusetts, USA.
3Department of Biochemistry, and
4Stanford Cancer Institute, Stanford University School of Medicine, Stanford, California, USA.
5Department of Cancer Biology, Dana-Farber Cancer Institute, Boston, Massachusetts, USA.
6Department of Cell Biology, Harvard Medical School, Boston, Massachusetts, USA.
7Center for One Medicine Innovative Translational Research (COMIT), Institute for Advanced Study, and
8Department of Chemistry and Biomolecular Science, Faculty of Engineering, Gifu University, Yanagido, Gifu, Japan.
9Division of Cardiovascular Medicine, Beth Israel Deaconess Medical Center, Harvard Medical School, Boston, Massachusetts, USA.
Address correspondence to: C. Ronald Kahn, 3 Blackfan Street, Room 0511, Boston, Massachusetts, 02115, USA. Phone: 617.735.3836; Email: C.Ronald.Kahn@joslin.harvard.edu.
Authorship note: XYL and GXW contributed equally to this work.
Find articles by Zheng, S. in: PubMed | Google Scholar
1Section of Integrative Physiology and Metabolism, Joslin Diabetes Center, and Department of Medicine, Harvard Medical School, Boston, Massachusetts, USA.
2Broad Institute of MIT and Harvard, Cambridge, Massachusetts, USA.
3Department of Biochemistry, and
4Stanford Cancer Institute, Stanford University School of Medicine, Stanford, California, USA.
5Department of Cancer Biology, Dana-Farber Cancer Institute, Boston, Massachusetts, USA.
6Department of Cell Biology, Harvard Medical School, Boston, Massachusetts, USA.
7Center for One Medicine Innovative Translational Research (COMIT), Institute for Advanced Study, and
8Department of Chemistry and Biomolecular Science, Faculty of Engineering, Gifu University, Yanagido, Gifu, Japan.
9Division of Cardiovascular Medicine, Beth Israel Deaconess Medical Center, Harvard Medical School, Boston, Massachusetts, USA.
Address correspondence to: C. Ronald Kahn, 3 Blackfan Street, Room 0511, Boston, Massachusetts, 02115, USA. Phone: 617.735.3836; Email: C.Ronald.Kahn@joslin.harvard.edu.
Authorship note: XYL and GXW contributed equally to this work.
Find articles by
Gerszten, R.
in:
PubMed
|
Google Scholar
|
1Section of Integrative Physiology and Metabolism, Joslin Diabetes Center, and Department of Medicine, Harvard Medical School, Boston, Massachusetts, USA.
2Broad Institute of MIT and Harvard, Cambridge, Massachusetts, USA.
3Department of Biochemistry, and
4Stanford Cancer Institute, Stanford University School of Medicine, Stanford, California, USA.
5Department of Cancer Biology, Dana-Farber Cancer Institute, Boston, Massachusetts, USA.
6Department of Cell Biology, Harvard Medical School, Boston, Massachusetts, USA.
7Center for One Medicine Innovative Translational Research (COMIT), Institute for Advanced Study, and
8Department of Chemistry and Biomolecular Science, Faculty of Engineering, Gifu University, Yanagido, Gifu, Japan.
9Division of Cardiovascular Medicine, Beth Israel Deaconess Medical Center, Harvard Medical School, Boston, Massachusetts, USA.
Address correspondence to: C. Ronald Kahn, 3 Blackfan Street, Room 0511, Boston, Massachusetts, 02115, USA. Phone: 617.735.3836; Email: C.Ronald.Kahn@joslin.harvard.edu.
Authorship note: XYL and GXW contributed equally to this work.
Find articles by
Kahn, C.
in:
PubMed
|
Google Scholar
|
Published April 15, 2026 - More info
J Clin Invest. 2026;136(8):e197556. https://doi.org/10.1172/JCI197556.
© 2026 Liu et al. This work is licensed under the Creative Commons Attribution 4.0 International License. To view a copy of this license, visit http://creativecommons.org/licenses/by/4.0/.
Received: July 3, 2025; Accepted: February 17, 2026

Related video:
Depletion of hepatic glutathione and selective protein oxidation and inhibition of lipogenesis
In this episode, Xiang-Yu Liu explains that the manuscript's findings revise the conventional view of GSH in protein redox and demonstrate that targeted redox manipulation through GSH depletion protects against MASLD.

-
Introduction
Glutathione (GSH) is a tripeptide composed of cysteine, glycine, and glutamic acid. Within cells, GSH exists in 2 interconvertible states: the reduced form (GSH) and the oxidized form (GSSG). The conversion of GSH to GSSG is traditionally viewed as being coupled to the clearance of reactive oxygen species (ROS) and the reduction of oxidized proteins (Figure 1A), positioning GSH as a key antioxidant that globally mitigates oxidative stress on proteins (1–3). However, the physiological and pathophysiological roles of GSH remain largely unexplored in vivo, substantially limiting our ability to therapeutically target GSH in disease contexts.
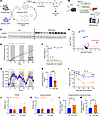 Figure 1
Hepatic GSH depletion improves insulin sensitivity. (A) The role of GSH and its depletion by Chac1. Cys-Gly, cysteinylglycine; ROS, reactive oxygen species. (B) Liver-specific Chac1 overexpression using AAV8. (C) Overexpression of Chac1 in liver assessed by immunoblot. (D) Metabolomic analysis on livers from control and hepatic GSH-depleted mice (n = 7). (E) Cumulative food intake by control or GSH-depleted mice (n = 6). (F) Body weights of mice after AAV injection (n = 9–11). (G) Respiratory exchange ratio of mice measured by metabolic cage (n = 6). (H and I) Blood glucose levels of mice after overnight fasting (H, n = 9–11) or during an insulin tolerance test (I, n = 8–10). (J and K) Relative levels of serum insulin and glucagon of mice during fasting (J) or after glucose injection (K) assessed using ELISA (insulin ELISA: Crystal Chem, 90080; glucagon ELISA: Crystal Chem, 81518). (L and M) Percentage of hepatic insulin action (L) and whole-body glycogen synthesis rate (M) of mice during hyperinsulinemic-euglycemic clamps (n = 7–9). *P < 0.05, **P < 0.01, ***P < 0.001, ****P < 0.0001. GSH-dep, GSH depletion.
GSH is primarily synthesized in liver, and decreased levels of circulating GSH have been reported in liver diseases, including metabolic dysfunction–associated steatotic liver disease (MASLD) and metabolic dysfunction–associated steatohepatitis (MASH) (4, 5). Together with the evidence of elevated oxidative stress in MASLD/MASH (6, 7), it has been widely assumed that hepatic GSH depletion is detrimental, leading to disease progression. Although this widely accepted assumption appears intuitive, it remains largely untested for several reasons. First, many studies have focused on plasma GSH levels or its constituent amino acids, which may not accurately reflect hepatic GSH status (4). Second, the reported decrease in plasma GSH levels among patients with MASLD has not been consistently reproduced across independent cohorts (4, 8). Third, and most importantly, the relationship between decreased GSH and MASLD is primarily based on association rather than demonstrated causality. Thus, the widely assumed detrimental effect of GSH depletion in MASLD remains largely unproven and lacks direct causal evidence.
Given the assumption that GSH depletion contributes to MASLD progression, GSH supplementation has been proposed as a therapeutic strategy. Clinical randomized controlled trials have begun to investigate the effects of GSH supplementation on MASLD/MASH. GSH has been administered through various routes, including intravenous and oral delivery. However, evidence supporting an increase in hepatic GSH levels following supplementation remains controversial (9), and the therapeutic outcomes for MASLD are inconclusive because of inconsistencies in study protocols and variable results across independent cohorts (10). Moreover, recent well-controlled animal studies have demonstrated that hepatic GSH may actually promote lipid accumulation and exacerbate MASLD (11–14), though the underlying molecular mechanisms remain largely undefined. Taken together, these findings indicate a need to critically reassess the role of GSH in hepatocyte function and development of MASLD.
GSH degradation has been believed to occur primarily in the extracellular space. After being exported from cells by multidrug resistance protein, extracellular and circulating GSH is hydrolyzed by γ-glutamyltransferase (GGT), an enzyme localized at the outer surface of cell membranes, to produce glutamic acid and cysteinylglycine (Cys-Gly) (15, 16). More recently, an intracellular GSH degradation pathway has been identified, catalyzed by the enzyme cation transport regulator homolog 1 (Chac1). Chac1 is highly conserved among species (Supplemental Figure 1A; supplemental material available online with this article; https://doi.org/10.1172/JCI197556DS1) and specifically degrades GSH to 5-oxoproline and Cys-Gly (17–19). A paralog of Chac1 in the mammalian genome is Chac2. Although Chac2 has also been proposed to function as a GSH-degrading enzyme based on its approximately 50% sequence similarity to Chac1, it shows about 20-fold lower catalytic efficiency than Chac1 on GSH degradation (20). Consequently, Chac2 is mostly considered to serve as an enzyme for slow turnover of intracellular GSH or potentially to have other primary enzymatic functions. Furthermore, in liver, Chac1 protein is moderately expressed, whereas Chac2 protein is undetectable (21). Thus, Chac1 is likely to function as the major enzyme mediating intracellular GSH degradation in liver.
In this study, to examine the role of hepatic GSH depletion on protein oxidation and MASLD progression, we have overexpressed Chac1 specifically in liver to induce GSH depletion. Surprisingly, our data reveal that GSH depletion protects against MASLD progression, and it does not induce general oxidative stress response. Mechanistically, in contrast with the canonical doctrine that GSH globally maintains proteins in a reduced state, we show that GSH depletion selectively oxidizes and promotes the degradation of fatty acid synthase (FASN), a key regulator of lipid metabolism. In addition, GSH depletion also suppresses lipogenesis by downregulating key lipogenic genes at the transcriptional level, further protecting against MASLD.
-
Results
Hepatic GSH depletion is achieved through Chac1 overexpression. Chac1 functions as a GSH-specific γ-glutamylcyclotransferase, catalyzing the degradation of GSH into 5-oxoproline and Cys-Gly, thereby decreasing intracellular GSH levels (Figure 1A) (17, 19). To achieve GSH depletion in liver, we engineered an adeno-associated virus (AAV) vector encoding Chac1 fused to a Myc tag, driven by the thyroxine-binding globulin (TBG) promoter to achieve liver-specific overexpression of Chac1 (Figure 1B). AAV vectors expressing GFP served as negative controls. qRT-PCR and immunoblot analyses confirmed robust overexpression of Chac1 in liver (Supplemental Figure 1B and Figure 1C). Metabolomic profiling of liver extracts revealed significant and specific decreases in both reduced (GSH) and oxidized (GSSG) glutathione levels, accompanied by an increase of 5-oxoproline, indicating effective GSH degradation by functional Chac1 (Figure 1D and Supplemental Figure 1C). Circulating GSH levels were also significantly decreased (Supplemental Figure 1D), indicating liver is the primary organ supplying GSH to the circulation. Interestingly, markers of oxidative stress response, including Nrf2 and Keap1, remained unchanged in liver (Supplemental Figure 1E). Consistent with this, Chac1 overexpression in hepatocytes did not change the ROS levels (Supplemental Figure 1F). Thus, these data indicate that Chac1-mediated GSH depletion does not elicit a compensatory oxidative stress response.
Hepatic GSH depletion increases insulin sensitivity. Mice with hepatic GSH depletion exhibited increased food intake compared with controls (Figure 1E), while body weight, physical activity, and energy expenditure remained unchanged (Figure 1F and Supplemental Figure 1, G and H). Tissue weights of liver, adipose tissue, and skeletal muscle were also comparable between groups (Supplemental Figure 1, I–N). Serum alanine aminotransferase (ALT) levels were similar, indicating GSH depletion did not cause overt liver injury (Supplemental Figure 1O). Interestingly, GSH-depleted mice displayed a significantly elevated respiratory exchange ratio (RER) (Figure 1G), indicating increased carbohydrate utilization. Consistent with this metabolic shift, these mice exhibited lower blood glucose levels both during fasting and insulin tolerance testing (Figure 1, H and I). The levels of insulin and glucagon during fasting or after glucose injection were comparable between GSH-depleted and control mice (Figure 1, J and K), indicating that the observed differences in blood glucose were not due to altered levels of the main glucose-controlling hormones. We therefore hypothesized that the decreased blood glucose levels in GSH-depleted mice resulted from increased insulin sensitivity. To test this directly, we performed hyperinsulinemic-euglycemic clamp studies (Supplemental Figure 1P). Indeed, GSH-depleted mice demonstrated a higher level of hepatic insulin action (Figure 1L), and increased whole-body glycogen synthesis (Figure 1M), supporting enhanced insulin sensitivity as a consequence of GSH depletion. Together, these data indicate that hepatic GSH depletion increases insulin sensitivity with enhanced carbohydrate utilization.
Hepatic GSH depletion protects against high-fat diet–induced MASLD. To investigate the effect of GSH depletion on the development of MASLD, mice were subjected to high-fat diet (HFD) feeding containing 60% fat. As in chow-fed mice, hepatic GSH levels were significantly decreased by approximately 90% following Chac1 overexpression (Figure 2A). Compared with control mice, GSH-depleted mice exhibited similar body weight gain (Supplemental Figure 2A) and food intake (Supplemental Figure 2B), a mild increase of carbon dioxide production (Supplemental Figure 2C), and similar RER (Supplemental Figure 2D) and locomotor activity (Supplemental Figure 2E). However, mice with depletion of hepatic glutathione showed significantly elevated whole-body energy expenditure (Figure 2B) and oxygen consumption (Figure 2C), indicating increased metabolic rate. Consistent with these findings, GSH-depleted mice showed significantly decreased weights of liver and epididymal (visceral) white adipose tissue (eWAT) (Figure 2, D and E), while weights of inguinal (subcutaneous) white adipose tissue (iWAT), brown adipose tissue (BAT), or skeletal muscle remained unchanged (Supplemental Figure 2, F–H). Histological and biochemical analysis of liver revealed marked decreases in hepatic lipid accumulation, lipid droplet formation, and fibrosis in GSH-depleted mice (Figure 2, F and G). These were accompanied by lower serum levels of ALT and aspartate aminotransferase (AST) (Figure 2, H and I), indicating protection against MASLD-induced liver injury. Similarly, eWAT from GSH-depleted mice displayed substantially decreased fibrosis and smaller adipocyte size, indicating decreased lipid storage and MASLD-associated inflammation in eWAT (Supplemental Figure 2I). GSH-depleted and control mice showed similar levels of circulating free fatty acid, triglyceride, and glycerol (Supplemental Figure 2, J–L), indicating that the decreased lipid storage in liver and eWAT was not accompanied by hyperlipidemia.
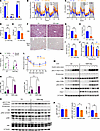 Figure 2
Hepatic GSH depletion protects against HFD-induced MASLD. (A) Levels of GSH and GSSG in livers of mice measured using Cayman Chemical Glutathione Assay Kit. (B and C) Energy expenditure (B) and oxygen consumption rate (C) of mice (n = 5). (D and E) Weights of liver (D) and eWAT (E) in control or GSH-depleted mice. (F) H&E and Sirius red staining in the liver. Scale bar: 80 μm. (G) Quantitative analysis of triglyceride (TG) levels in the liver. (H and I) Circulating levels of ALT (H) and AST (I) in mice. (J) Blood glucose levels of mice during fasting. (K) Levels of serum insulin during fasting or after glucose injection. (L) Blood glucose levels of mice during insulin tolerance test (n = 7). (M) Protein levels of key downstream effectors of insulin signaling in livers after insulin injection through vena cava. (N) Quantitative analysis of immunoblots in M. (O) Protein levels of inhibitory regulators of insulin signaling in livers. (P) Quantitative analysis of immunoblots in O. Mice were fed an HFD for 2 weeks before infection with AAV and were sacrificed 8 weeks later. *P < 0.05, **P < 0.01, ***P < 0.001, ****P < 0.0001. p, phosphorylated.
In addition to inducing fatty liver, HFD also promotes systemic metabolic syndrome with insulin resistance and glucose intolerance. Under HFD condition, GSH-depleted mice exhibited significantly lower fasting blood glucose levels (Figure 2J), decreased fasting insulin levels, and improved glucose-stimulated insulin secretion (Figure 2K), all indicative of enhanced insulin sensitivity. This was further supported by insulin tolerance tests, which demonstrated significantly improved glucose lowering in GSH-depleted mice (Figure 2L). To directly assess insulin signaling, mice were administered insulin via the vena cava, followed by immunoblotting of key downstream effectors in liver and eWAT. In livers of GSH-depleted mice, the levels of pAKT at T308 and S473 were lower under basal conditions but showed a greater fold increase upon insulin stimulation compared with control mice under HFD (Figure 2, M and N). A similar pattern was observed in eWAT, where pAKT at T308 displayed a lower basal level but a greater insulin-induced response (Supplemental Figure 2, M and N).
Excessive hepatic lipid accumulation has long been proposed to impair insulin signaling pathway and promote insulin resistance. Thus, we hypothesized that GSH depletion enhances insulin sensitivity by decreasing lipid-induced inhibitory events on insulin signaling. While lipid accumulation has multiple effects on cellular signaling, 3 major lipid-associated inhibitory phosphorylation events on the insulin signaling pathway include (a) acylglycerol-induced pIR at T1150 (human T1160) (22), (b) fatty acid–induced pIRS1 at S1097 (human S1101) (23), and (c) ER stress–mediated pJNK (24). We then examined these 3 events in GSH-depleted liver by immunoblotting. In HFD-fed mice, GSH depletion did not significantly decrease pIR T1150, but it significantly decreased levels of pIRS1 at S1097 and pJNK (Figure 2, O and P), indicating that attenuation of these 2 inhibitory nodes may contribute to the improved insulin sensitivity.
Taken together, these findings indicate that hepatic GSH depletion confers substantial protection against the development and progression of HFD-induced MASLD/MASH, with improved insulin sensitivity.
Hepatic GSH depletion suppresses lipogenesis and fibrosis through hepatocyte-intrinsic mechanisms. To identify the transcriptional adaptations underlying the metabolic changes induced by GSH depletion, we performed qRT-PCR to quantify the expression of key regulators of lipid and glucose metabolism, as well as fibrosis, in liver tissues from mice fed either a chow diet or HFD. The transcription factor (TF) Srebf1 (SREBP-1c) plays a central role in lipogenesis, and it is activated by insulin, glucose, or fatty acids, with its expression level maintained by itself as an autoregulatory feed-forward loop during lipogenesis (25, 26). GSH depletion significantly decreased the hepatic expression of Srebf1 and its direct downstream effector stearoyl-CoA desaturase (Scd1) under both chow and HFD conditions (Figure 3, A–C), indicating suppressed lipogenesis. In addition, under HFD conditions, most SREBP-1c downstream genes contributing to hepatic lipid accumulation were downregulated (Figure 3B). To determine whether decreased hepatic lipid accumulation could also be attributed to enhanced fatty acid β-oxidation, we examined the expression of key enzymes involved in this pathway, including Cpt1a, Acadm (MCAD), Acadl (LCAD), and Acadvl (VLCAD). However, GSH depletion led to either unchanged or decreased mRNA levels of these enzymes under both diets (Figure 3, A and B), indicating that fatty acid utilization was not upregulated. Thus, these data indicate that decreased lipid accumulation by GSH depletion is primarily due to diminished lipogenesis rather than increased fatty acid utilization.
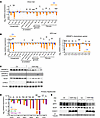 Figure 3
Hepatic GSH depletion suppresses lipogenesis and fibrosis. (A) Relative expression levels of key genes controlling lipogenesis, β-oxidation, gluconeogenesis, and fibrosis in livers of mice under chow diet. Expression was assessed by qRT-PCR (n = 9–11). Mice were fed a chow diet and were sacrificed 8 weeks after infection with AAV. (B) Relative expression levels of key genes controlling lipogenesis, β-oxidation, gluconeogenesis, and fibrosis in livers of mice after 10 weeks on HFD. Expression was assessed by qRT-PCR (n = 7). Mice were fed an HFD for 2 weeks before infection with AAV and were sacrificed 8 weeks later. (C) Protein levels of SREBP-1c, SCD1, and CHAC1 in livers of mice under HFD. (D) Relative expression levels of Chac1-regulated genes in primary hepatocytes under 100 μM free fatty acid (FA) treatment. Expression was assessed by qRT-PCR (n = 3). Adenovirus (Adv): 400 μL/mL medium. Cells were harvested 3 days postinfection. (E) Protein levels of SPP1, SCD1, and CHAC1 in primary hepatocytes under 100 μM free FA treatment. Primary hepatocytes were infected with Adv overexpressing GFP or Chac1. Adv: 400 μL/mL medium. Cells were harvested 3 days postinfection. *P < 0.05, **P < 0.01, ***P < 0.001, ****P < 0.0001.
Consistent with decreased fasting glucose levels and improved insulin tolerance observed under chow, and to a lesser extent under HFD conditions (Figure 1, H and I, and Figure 2, J and L), GSH depletion significantly downregulated gluconeogenic enzymes G6pc and Pck1 in chow-fed mice, with no substantial change under HFD (Figure 3, A and B).
Liver fibrosis is a key marker of MASLD/MASH progression, initiated by elevated hepatocyte expression of pro-fibrotic TFs such as Sox9 and secreted factors such as Spp1 (osteopontin) and Tgfb1 (TGF-β1). These factors activate hepatic stellate cells and fibroblasts to produce extracellular matrix proteins involved in collagen synthesis, with Col1a1 as one major player (27–29). Remarkably, GSH depletion significantly decreased the expression of these key fibrogenic factors under both chow and HFD conditions (Figure 3, A and B). Liver fibrosis is often accompanied by chronic inflammation, which further contributes to disease progression. Indeed, under HFD, GSH depletion also significantly decreased expression of Ccl2 and Tnfa (TNF-α), cytokines that promote inflammation and immune cell recruitment (Figure 3B). These results indicate that GSH depletion confers robust antifibrotic and antiinflammatory effects in liver.
Given the cellular heterogeneity of the liver and the complex intercellular crosstalk involved in disease progression (28), we then asked whether GSH depletion–induced suppression of lipogenesis and fibrosis is intrinsic to hepatocytes. To address this, we isolated primary mouse hepatocytes and infected them with adenoviruses expressing Chac1 or GFP, followed by treatment with BSA or BSA-conjugated fatty acids to mimic chow and HFD conditions, respectively. Consistent with in vivo findings, GSH depletion significantly decreased the expression of genes involved in lipogenesis and fibrosis in hepatocytes under both treatment conditions (Figure 3, D and E).
Taken together, these results demonstrate that hepatic GSH depletion induces a functional adaption in the transcriptional program, leading to decreased lipid accumulation and fibrosis in liver, and these effects are predominantly intrinsic to hepatocytes.
GSH depletion decreases hepatic neutral lipid accumulation under HFD. To elucidate the mechanisms by which GSH depletion protects against the development of MASLD, we performed untargeted lipidomic and metabolomic profiling on liver tissues from HFD-fed mice (Figure 4A). Lipidomic analysis revealed that GSH depletion significantly decreased levels of neutral lipids, including diacylglycerols (DAGs), triacylglycerols (TAGs), and cholesterol esters (CEs), while GSH depletion increased levels of sphingolipids and phospholipids (Figure 4, B and C, and Supplemental Figure 3, A–C), many of which have been shown to improve hepatic steatosis (26). Interestingly, among the decreased neutral lipid species, DAGs represented the most prominently decreased species (Figure 4C). It has been proposed that DAG accumulation is an important driver of hepatic/systemic insulin resistance and MASLD progression (30–32). Consistent with this, the majority of detected DAG species were significantly lower in livers of GSH-depleted mice under HFD conditions (Figure 4D).
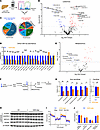 Figure 4
Hepatic lipid profile is remodeled by GSH depletion. (A) Metabolite and lipid profiling in mouse livers under HFD. HILIC, hydrophilic interaction liquid chromatography. (B) Volcano plot showing lipid alterations in mouse livers following GSH depletion. Red: upregulated lipids; Blue: downregulated lipids. (C) Distribution of lipid species regulated by GSH depletion. DAG, diacylglycerol; TAG, triacylglycerol; CE, cholesterol esters; SM, sphingomyelin; PE, phosphatidylethanolamine; PC, phosphatidylcholine; LPE, lysophosphatidylethanolamine; PS, phosphatidylserine; LPC, lysophosphatidylcholines. (D) Levels of DAGs in mouse livers. Lipids with -A and -B mean detected isomers with 2 peaks (n = 7). (E) Volcano plot showing metabolite alterations in mouse livers following GSH depletion. Red: upregulated metabolites; Blue: downregulated metabolites. (F) Metabolism of acylglycerols and carnitine shuttle in cytosol and mitochondria. (G) Levels of acyl-carnitines and free carnitine in mouse livers measured by metabolite profiling. (H) Protein levels of OXPHOS complexes in livers of mice under HFD. The β-tubulin loading control shown is identical to that in Figure 2O, as the same protein lysates were analyzed. (I) Oxygen consumption rate of HepG2 hepatocytes measured using the Agilent Seahorse XFe24 Analyzer under sequential treatment with oligomycin (Oligo), carbonyl cyanide p-trifluoromethoxyphenylhydrazone (FCCP), and rotenone plus antimycin A (Rot+AA). (J) Quantification of basal respiration, ATP-linked respiration, proton leak, and maximal respiration derived from I. Mice were fed an HFD for 2 weeks before infection with AAV and were sacrificed 8 weeks later. *P < 0.05, **P < 0.01, ***P < 0.001, ****P < 0.0001.
To further assess whether decreased accumulation of neutral lipids was driven by increased fatty acid utilization, we examined metabolites in this pathway. In this process, acyl-glycerol is converted to acyl-carnitine, followed by mitochondrial transport and β-oxidation. In line with decreased expression of key enzymes involving β-oxidation (Figure 3, A and B), metabolomic analysis demonstrated significantly decreased levels of multiple acyl-carnitine species, without alterations in free carnitine levels (Figure 4, E–G). Furthermore, GSH depletion did not change protein levels of oxidative phosphorylation (OXPHOS) complexes in liver under HFD (Figure 4H), and it did not alter mitochondrial respiration in hepatocytes (Figure 4, I and J). Taken together, these data indicate that the decreased accumulation of hepatic neutral lipids in GSH-depleted mice is primarily attributed to decreased lipogenesis, rather than enhanced fatty acid mobilization.
GSH depletion selectively oxidizes and destabilizes FASN. GSH plays a critical role in maintaining protein cysteine residues in a reduced state, and oxidized proteins are typically functionally impaired and prone to degradation (33, 34). Thus, we hypothesized that GSH depletion enhances the oxidation of key lipogenic factors, rendering them dysfunctional and targeting them for degradation.
To systemically assess reversible protein cysteine oxidation, we performed protein redoxome analysis (35) on liver samples from control and GSH-depleted mice. Using redox-specific cysteine-labeling strategies coupled with mass spectrometry, we quantified reversible oxidation states at individual cysteine residues (Figure 5A). Surprisingly, GSH depletion did not lead to global increase in protein oxidation but instead selectively enhanced oxidation at specific cysteine sites (Figure 5B and Supplemental Figure 4, A–D). A total of 11,611 cysteine sites were detected, of which only 1.8% exhibited increased levels of oxidation following GSH depletion. Motif analysis of the amino acid sequences flanking the cysteines with higher oxidation levels revealed a higher frequency of positively charged residues at positions -5 and -6 (Figure 5, C and D), indicating sequence-specific susceptibility to oxidation by GSH depletion. Gene Ontology (GO) enrichment analysis of proteins harboring cysteines that exhibit increased oxidation indicated a strong association with pathways involved in protein transport and lipid metabolism (Figure 5E). GeneMANIA interactome analysis (36) showed that lipid metabolism-related proteins form extensive physical interactions between themselves and with other proteins harboring oxidized cysteines (Figure 5F and Supplemental Figure 4E), indicating the potential for functional coregulation within a redox-sensitive lipid metabolic protein network.
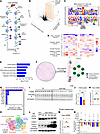 Figure 5
Selective protein oxidation by GSH depletion. (A) Protein redoxome analysis on mouse livers. SH, thiol; SOx, oxidized thiol; IAM, iodoacetamide; CPT, cysteine-reactive phosphate tags. (B) 3D volcano plot showing cysteines with differential levels of oxidation following GSH depletion. Red: cysteines with increased oxidation. Cysteines with significantly increased oxidation were defined as those with a P < 0.05, with a relative oxidation increase of at least 25%, and falling within the top 15% of all sites ranked by the absolute increase of oxidation level. (C) Motif analysis of cysteines with increased oxidation. Cysteine is fixed at the position 0. Over- and underrepresented motifs were identified using pLOGO (https://plogo.uconn.edu/). (D) Position weight matrix of amino acids in overrepresented motifs surrounding cysteine sites with increased oxidation. (E) Pathways enriched in proteins containing cysteines with increased oxidation. Pathways were identified using DAVID GO analysis (https://davidbioinformatics.nih.gov/) , with the top 5 pathways ranked by P value displayed. (F) Interactome of proteins containing cysteines with increased oxidation generated using GeneMANIA. (G) Rank of detected proteins by the number of cysteines with increased oxidation (top 10 shown). (H) Predicted structure of mouse FASN (AF-P19096-F1-v4). Cysteines with increased oxidation were labeled black. (I) Immunoblot analysis of FASN in mouse livers. The β-tubulin loading control is identical to Figure 1C, as the same protein lysates were analyzed. (J) Quantification of immunoblots. (K) Fasn mRNA levels in mouse liver. (L) Protein levels of FASN in primary hepatocytes following Chac1 overexpression using Adv. Cells were harvested 3 days postinfection. (M) Fasn mRNA levels in primary hepatocytes (Adv: 400 μL/mL medium; 3 days postinfection). (N) Lipid accumulation in primary hepatocytes. Cells were treated with siRNAs and palmitic acid (0.25 mM) 12 hours after infection with Adv overexpressing GFP or Chac1. Nile red staining was performed 3 days postinfection. ***P < 0.001.
To identify the most affected targets, we ranked all detected proteins based on the number of cysteine sites exhibiting increased oxidation in GSH-depleted livers. FASN emerged as the top candidate, with 10 cysteine sites showing increased oxidation levels, far exceeding other proteins, which had at most 2 sites (Figure 5G). FASN, a key enzyme in lipogenesis, catalyzes the synthesis of long-chain fatty acids, which are then used to synthesize neutral lipids, such as acylglycerols and CEs (37, 38). FASN has a complex structure composed of 2 distinct regions (the condensing region and the modifying region), each of which contains multiple catalytic domains (39). The condensing region includes regions with ketosynthase and acyl/malonyl transferase activities, while the modifying region includes dehydratase, enoyl reductase, ketoacyl reductase, and thioesterase domains (39, 40) (Figure 5H). Interestingly, these 10 cysteines with higher levels of oxidation were distributed across all domains of FASN (Figure 5H and Supplemental Figure 4F). Given that oxidized proteins are prone to degradation (34), we hypothesized GSH depletion could result in a lower level of FASN protein in liver. Indeed, immunoblot analysis revealed significantly decreased protein levels of FASN in livers from GSH-depleted mice (Figure 5, I and J), without decreased levels of Fasn mRNA (Figure 5K). These data indicate FASN was downregulated at the posttranslational level by oxidation-induced protein degradation due to GSH depletion.
We then asked whether GSH depletion–mediated FASN downregulation is intrinsic to hepatocytes. To test this, we infected mouse primary hepatocytes with adenoviruses expressing either Chac1 or GFP. Immunoblot analysis showed FASN protein levels were substantially decreased in a dose-dependent manner with Chac1 overexpression (Figure 5L), indicating this effect by GSH depletion is intrinsic to hepatocytes. Again, the Fasn mRNA levels remained unchanged (Figure 5M), reinforcing the posttranslational downregulation of FASN by GSH depletion.
Previous studies have suggested that Chac1 may also antagonize Notch signaling, especially in the process of neurogenesis (41, 42). To examine whether the decreased FASN levels could result from NOTCH inhibition, we assessed the level of Notch signaling by identifying the levels of NOTCH1, NOTCH2, and their most direct downstream effector, HES1 (43), in GSH-depleted livers. However, no significant changes were observed in these proteins (Supplemental Figure 4G), suggesting that the suppression of lipogenesis via FASN oxidation is independent of Notch signaling.
In addition to downregulating FASN at the posttranslational level, GSH depletion also decreased the key lipogenic genes at the transcriptional level, most notably Scd1 and Srebf1 (Figure 3, A–C). Interestingly, knockdown of Fasn, Scd1, or the combination of both together with Srebf1 significantly decreased lipid accumulation in primary hepatocytes to a degree comparable to that observed upon GSH depletion (Figure 5N). Notably, GSH depletion did not further decrease lipid accumulation in these knockdown conditions, indicating a lack of additive effect. Thus, these data indicate that Fasn and Scd1 may act within the same lipogenic pathway downstream of GSH depletion and that inhibition of either enzyme is sufficient to occlude the lipid-lowering effect.
Collectively, these data indicate that GSH depletion selectively promotes oxidation and degradation of FASN in hepatocytes. Combined with transcriptional inhibition of lipogenic genes, lipogenesis is thereby inhibited through both posttranslational and transcriptional mechanisms.
GSH depletion protects from methionine/choline-deficient diet–induced liver injury. To determine whether GSH depletion can also exert protective effects in a primarily MASH model, we overexpressed Chac1 in mouse liver using AAV8 followed by challenging mice with methionine/choline-deficient diets (MCDs) to induce MASH. In this context, GSH-depleted and control mice showed comparable body weights (Supplemental Figure 5A). GSH depletion modestly increased the weight of BAT, but the weights of liver and other metabolic organs, such as eWAT, iWAT, and muscle, were unchanged (Supplemental Figure 5, B–F). Fasting glucose levels were also similar between these 2 groups (Supplemental Figure 5G). Notably, however, GSH depletion significantly decreased circulating ALT levels (Supplemental Figure 5H), indicating protective effects against MCD-induced liver damage.
Chac1 expression is suppressed during feeding and MASLD/MASH. Given that Chac1 overexpression–mediated glutathione depletion substantially suppresses lipogenesis and mitigates MASLD/MASH progression, we asked whether Chac1 expression is regulated during normal metabolic transitions or in liver disease states. To this end, we analyzed transcriptomics from mouse livers under fasting conditions and at multiple time points following refeeding (44). Clustering analysis of the changes of expression revealed distinct transcriptional kinetics among genes during refeeding (Supplemental Figure 6A). Notably, Chac1 expression was significantly downregulated by approximately 95% as early as 3 hours after refeeding, and this suppression persisted for at least 12 hours (Figure 6A). The magnitude of Chac1 downregulation exceeded that of canonical refeeding-responsive genes controlling hepatic glucose metabolism, such as the downregulation of G6pc or upregulation of Gck (Figure 6A), indicating robust transcriptional suppression of Chac1 during feeding. Since insulin sensitivity plays a central role in transcriptional adaptation to metabolic cues, we next examined whether Chac1 expression is regulated by changes in insulin sensitivity. In mice overexpressing the insulin receptor in skeletal muscle (Supplemental Figure 6B) (45), transcriptomic profiling of muscle revealed a significant downregulation of Chac1 (Figure 6B and Supplemental Figure 6C). Thus, these data demonstrate that Chac1 expression is highly regulated corresponding to feeding and changes of insulin sensitivity.
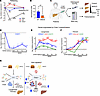 Figure 6
Transcriptional regulation of Chac1 in metabolic transitions and MASLD. (A) Relative expression of G6pc, Gck, and Chac1 in livers under fasting or after refeeding. Expression was assessed by transcriptomics (RNA-seq). Raw data were from National Center for Biotechnology Information (NCBI) Gene Expression Omnibus (GEO) GSE137385. (B) Relative expression of Chac1 in skeletal muscles of WT or muscle-specific insulin receptor overexpression (IRMOE) mice. The RNA-seq data were from accession number GSE149662. CPM, counts per million. (C) Schematic showing liver biopsy from patients with MASLD/MASH followed by histological scoring and transcriptomic analysis (RNA-seq). Raw data were from GSE135251. (D) Relative expression of CHAC1 in liver biopsies from MASLD/MASH. (E and F) Relative expression of key genes suppressed by hepatic Chac1 overexpression involved in lipogenesis (E) and fibrosis (F) in liver biopsies from MASLD/MASH. (G) Schematic showing hepatic GSH depletion by Chac1 overexpression protects from MASLD through selective protein oxidation and transcriptional regulation. Significance for transcriptomic analysis was determined using DESeq2, unless otherwise specified. For D–F, Wald’s test P value is indicated as *P < 0.05, **P < 0.01, ***P < 0.001, ****P < 0.0001; Benjamini-Hochberg P value is indicated as †P < 0.1.
Finally, we asked whether the expression of Chac1 is altered during the development of human MASLD/MASH. In the dataset from Govaere et al., more than 200 individual liver biopsies from patients were histologically scored to determine MASLD/MASH stage, followed by RNA-seq for transcriptomic profiling (46) (Figure 6C). Differential gene expression analysis revealed a continuous trajectory of transcriptional changes with stage of disease progression from MASLD to advanced MASH (Supplemental Figure 7, A and B), indicating substantial transcriptional remodeling during MASLD/MASH progression. Likewise, GO analysis demonstrated enrichment of extracellular matrix remodeling and fibrotic pathways, consistent with disease progression (Supplemental Figure 8). Interestingly, Chac1 was downregulated across the entire disease spectrum, beginning in early MASLD and remaining suppressed through progression to MASH with advanced fibrosis (Figure 6D). In contrast, the key lipogenic and fibrogenic genes that are suppressed by Chac1 overexpression–induced hepatic GSH depletion, including Srebf1, Scd, Dgat2, Spp1, Col1a1, and Sox9, were upregulated during disease progression (Figure 6, E and F).
Taken together, these data demonstrate that loss of Chac1 expression is associated with metabolic dysregulation and fibrosis in MASLD/MASH and that restoring Chac1 expression and the resulting GSH depletion may represent a potentially novel therapeutic strategy for halting MASLD/MASH progression.


Copyright © 2026 American Society for Clinical Investigation
ISSN: 0021-9738 (print), 1558-8238 (online)