
Advertisement
Research ArticleCell biologyHematology
Open Access |  10.1172/JCI196578
Methyltransferase complex subunit METTL3 maintains genome stability of erythroid cells via MTHFD1-mediated nucleotide biosynthesis
Linlin Zhang,1 Huizhi Zhao,1 Shihui Wang,2 Xueting Wu,1 Donghao Liu,1 Hengchao Zhang,1 Qianqian Yang,1 Ying Cheng,1 Xiuyun Wu,1 Jiangwei Zhao,1 Shijie Zhang,1 Huan Zhang,1 Haojian Zhang,3 Qiaozhen Kang,1 Lixiang Chen,1 Xiuli An,4 and Xiaoli Qu1
1School of Life Sciences, Zhengzhou University, Zhengzhou, China.
2Department of Hematology, Institute of Hematology, Henan Provincial People’s Hospital, People’s Hospital of Zhengzhou University, Zhengzhou, China.
3The State Key Laboratory Breeding Base of Basic Science of Stomatology and Key Laboratory of Oral Biomedicine Ministry of Education, School and Hospital of Stomatology, Wuhan University, Wuhan, China.
4Laboratory of Membrane Biology, New York Blood Center, New York, New York, USA.
Address correspondence to: Xiaoli Qu, School of Life Sciences, Zhengzhou University, Science Road 100, Zhengzhou, 450001, China. Phone: 86.17737783785; Email: qv1110xiaoli@126.com. Or to: Xiuli An, Laboratory of Membrane Biology, New York Blood Center, New York, New York, 10065, USA. Phone: 212.570.3247; Email: xan@nybc.org. Or to: Lixiang Chen, School of Life Sciences, Zhengzhou University, Science Road 100, Zhengzhou, 450001, China. Phone: 86.18538086609; Email: lxchen@zzu.edu.cn.
Authorship note: LZ and Huizhi Zhao contributed equally to this work.
Find articles by Zhang, L. in: PubMed | Google Scholar
1School of Life Sciences, Zhengzhou University, Zhengzhou, China.
2Department of Hematology, Institute of Hematology, Henan Provincial People’s Hospital, People’s Hospital of Zhengzhou University, Zhengzhou, China.
3The State Key Laboratory Breeding Base of Basic Science of Stomatology and Key Laboratory of Oral Biomedicine Ministry of Education, School and Hospital of Stomatology, Wuhan University, Wuhan, China.
4Laboratory of Membrane Biology, New York Blood Center, New York, New York, USA.
Address correspondence to: Xiaoli Qu, School of Life Sciences, Zhengzhou University, Science Road 100, Zhengzhou, 450001, China. Phone: 86.17737783785; Email: qv1110xiaoli@126.com. Or to: Xiuli An, Laboratory of Membrane Biology, New York Blood Center, New York, New York, 10065, USA. Phone: 212.570.3247; Email: xan@nybc.org. Or to: Lixiang Chen, School of Life Sciences, Zhengzhou University, Science Road 100, Zhengzhou, 450001, China. Phone: 86.18538086609; Email: lxchen@zzu.edu.cn.
Authorship note: LZ and Huizhi Zhao contributed equally to this work.
Find articles by Zhao, H. in: PubMed | Google Scholar
1School of Life Sciences, Zhengzhou University, Zhengzhou, China.
2Department of Hematology, Institute of Hematology, Henan Provincial People’s Hospital, People’s Hospital of Zhengzhou University, Zhengzhou, China.
3The State Key Laboratory Breeding Base of Basic Science of Stomatology and Key Laboratory of Oral Biomedicine Ministry of Education, School and Hospital of Stomatology, Wuhan University, Wuhan, China.
4Laboratory of Membrane Biology, New York Blood Center, New York, New York, USA.
Address correspondence to: Xiaoli Qu, School of Life Sciences, Zhengzhou University, Science Road 100, Zhengzhou, 450001, China. Phone: 86.17737783785; Email: qv1110xiaoli@126.com. Or to: Xiuli An, Laboratory of Membrane Biology, New York Blood Center, New York, New York, 10065, USA. Phone: 212.570.3247; Email: xan@nybc.org. Or to: Lixiang Chen, School of Life Sciences, Zhengzhou University, Science Road 100, Zhengzhou, 450001, China. Phone: 86.18538086609; Email: lxchen@zzu.edu.cn.
Authorship note: LZ and Huizhi Zhao contributed equally to this work.
Find articles by Wang, S. in: PubMed | Google Scholar
1School of Life Sciences, Zhengzhou University, Zhengzhou, China.
2Department of Hematology, Institute of Hematology, Henan Provincial People’s Hospital, People’s Hospital of Zhengzhou University, Zhengzhou, China.
3The State Key Laboratory Breeding Base of Basic Science of Stomatology and Key Laboratory of Oral Biomedicine Ministry of Education, School and Hospital of Stomatology, Wuhan University, Wuhan, China.
4Laboratory of Membrane Biology, New York Blood Center, New York, New York, USA.
Address correspondence to: Xiaoli Qu, School of Life Sciences, Zhengzhou University, Science Road 100, Zhengzhou, 450001, China. Phone: 86.17737783785; Email: qv1110xiaoli@126.com. Or to: Xiuli An, Laboratory of Membrane Biology, New York Blood Center, New York, New York, 10065, USA. Phone: 212.570.3247; Email: xan@nybc.org. Or to: Lixiang Chen, School of Life Sciences, Zhengzhou University, Science Road 100, Zhengzhou, 450001, China. Phone: 86.18538086609; Email: lxchen@zzu.edu.cn.
Authorship note: LZ and Huizhi Zhao contributed equally to this work.
Find articles by Wu, X. in: PubMed | Google Scholar
1School of Life Sciences, Zhengzhou University, Zhengzhou, China.
2Department of Hematology, Institute of Hematology, Henan Provincial People’s Hospital, People’s Hospital of Zhengzhou University, Zhengzhou, China.
3The State Key Laboratory Breeding Base of Basic Science of Stomatology and Key Laboratory of Oral Biomedicine Ministry of Education, School and Hospital of Stomatology, Wuhan University, Wuhan, China.
4Laboratory of Membrane Biology, New York Blood Center, New York, New York, USA.
Address correspondence to: Xiaoli Qu, School of Life Sciences, Zhengzhou University, Science Road 100, Zhengzhou, 450001, China. Phone: 86.17737783785; Email: qv1110xiaoli@126.com. Or to: Xiuli An, Laboratory of Membrane Biology, New York Blood Center, New York, New York, 10065, USA. Phone: 212.570.3247; Email: xan@nybc.org. Or to: Lixiang Chen, School of Life Sciences, Zhengzhou University, Science Road 100, Zhengzhou, 450001, China. Phone: 86.18538086609; Email: lxchen@zzu.edu.cn.
Authorship note: LZ and Huizhi Zhao contributed equally to this work.
Find articles by Liu, D. in: PubMed | Google Scholar
1School of Life Sciences, Zhengzhou University, Zhengzhou, China.
2Department of Hematology, Institute of Hematology, Henan Provincial People’s Hospital, People’s Hospital of Zhengzhou University, Zhengzhou, China.
3The State Key Laboratory Breeding Base of Basic Science of Stomatology and Key Laboratory of Oral Biomedicine Ministry of Education, School and Hospital of Stomatology, Wuhan University, Wuhan, China.
4Laboratory of Membrane Biology, New York Blood Center, New York, New York, USA.
Address correspondence to: Xiaoli Qu, School of Life Sciences, Zhengzhou University, Science Road 100, Zhengzhou, 450001, China. Phone: 86.17737783785; Email: qv1110xiaoli@126.com. Or to: Xiuli An, Laboratory of Membrane Biology, New York Blood Center, New York, New York, 10065, USA. Phone: 212.570.3247; Email: xan@nybc.org. Or to: Lixiang Chen, School of Life Sciences, Zhengzhou University, Science Road 100, Zhengzhou, 450001, China. Phone: 86.18538086609; Email: lxchen@zzu.edu.cn.
Authorship note: LZ and Huizhi Zhao contributed equally to this work.
Find articles by Zhang, H. in: PubMed | Google Scholar
1School of Life Sciences, Zhengzhou University, Zhengzhou, China.
2Department of Hematology, Institute of Hematology, Henan Provincial People’s Hospital, People’s Hospital of Zhengzhou University, Zhengzhou, China.
3The State Key Laboratory Breeding Base of Basic Science of Stomatology and Key Laboratory of Oral Biomedicine Ministry of Education, School and Hospital of Stomatology, Wuhan University, Wuhan, China.
4Laboratory of Membrane Biology, New York Blood Center, New York, New York, USA.
Address correspondence to: Xiaoli Qu, School of Life Sciences, Zhengzhou University, Science Road 100, Zhengzhou, 450001, China. Phone: 86.17737783785; Email: qv1110xiaoli@126.com. Or to: Xiuli An, Laboratory of Membrane Biology, New York Blood Center, New York, New York, 10065, USA. Phone: 212.570.3247; Email: xan@nybc.org. Or to: Lixiang Chen, School of Life Sciences, Zhengzhou University, Science Road 100, Zhengzhou, 450001, China. Phone: 86.18538086609; Email: lxchen@zzu.edu.cn.
Authorship note: LZ and Huizhi Zhao contributed equally to this work.
Find articles by Yang, Q. in: PubMed | Google Scholar
1School of Life Sciences, Zhengzhou University, Zhengzhou, China.
2Department of Hematology, Institute of Hematology, Henan Provincial People’s Hospital, People’s Hospital of Zhengzhou University, Zhengzhou, China.
3The State Key Laboratory Breeding Base of Basic Science of Stomatology and Key Laboratory of Oral Biomedicine Ministry of Education, School and Hospital of Stomatology, Wuhan University, Wuhan, China.
4Laboratory of Membrane Biology, New York Blood Center, New York, New York, USA.
Address correspondence to: Xiaoli Qu, School of Life Sciences, Zhengzhou University, Science Road 100, Zhengzhou, 450001, China. Phone: 86.17737783785; Email: qv1110xiaoli@126.com. Or to: Xiuli An, Laboratory of Membrane Biology, New York Blood Center, New York, New York, 10065, USA. Phone: 212.570.3247; Email: xan@nybc.org. Or to: Lixiang Chen, School of Life Sciences, Zhengzhou University, Science Road 100, Zhengzhou, 450001, China. Phone: 86.18538086609; Email: lxchen@zzu.edu.cn.
Authorship note: LZ and Huizhi Zhao contributed equally to this work.
Find articles by Cheng, Y. in: PubMed | Google Scholar
1School of Life Sciences, Zhengzhou University, Zhengzhou, China.
2Department of Hematology, Institute of Hematology, Henan Provincial People’s Hospital, People’s Hospital of Zhengzhou University, Zhengzhou, China.
3The State Key Laboratory Breeding Base of Basic Science of Stomatology and Key Laboratory of Oral Biomedicine Ministry of Education, School and Hospital of Stomatology, Wuhan University, Wuhan, China.
4Laboratory of Membrane Biology, New York Blood Center, New York, New York, USA.
Address correspondence to: Xiaoli Qu, School of Life Sciences, Zhengzhou University, Science Road 100, Zhengzhou, 450001, China. Phone: 86.17737783785; Email: qv1110xiaoli@126.com. Or to: Xiuli An, Laboratory of Membrane Biology, New York Blood Center, New York, New York, 10065, USA. Phone: 212.570.3247; Email: xan@nybc.org. Or to: Lixiang Chen, School of Life Sciences, Zhengzhou University, Science Road 100, Zhengzhou, 450001, China. Phone: 86.18538086609; Email: lxchen@zzu.edu.cn.
Authorship note: LZ and Huizhi Zhao contributed equally to this work.
Find articles by Wu, X. in: PubMed | Google Scholar
1School of Life Sciences, Zhengzhou University, Zhengzhou, China.
2Department of Hematology, Institute of Hematology, Henan Provincial People’s Hospital, People’s Hospital of Zhengzhou University, Zhengzhou, China.
3The State Key Laboratory Breeding Base of Basic Science of Stomatology and Key Laboratory of Oral Biomedicine Ministry of Education, School and Hospital of Stomatology, Wuhan University, Wuhan, China.
4Laboratory of Membrane Biology, New York Blood Center, New York, New York, USA.
Address correspondence to: Xiaoli Qu, School of Life Sciences, Zhengzhou University, Science Road 100, Zhengzhou, 450001, China. Phone: 86.17737783785; Email: qv1110xiaoli@126.com. Or to: Xiuli An, Laboratory of Membrane Biology, New York Blood Center, New York, New York, 10065, USA. Phone: 212.570.3247; Email: xan@nybc.org. Or to: Lixiang Chen, School of Life Sciences, Zhengzhou University, Science Road 100, Zhengzhou, 450001, China. Phone: 86.18538086609; Email: lxchen@zzu.edu.cn.
Authorship note: LZ and Huizhi Zhao contributed equally to this work.
Find articles by Zhao, J. in: PubMed | Google Scholar
1School of Life Sciences, Zhengzhou University, Zhengzhou, China.
2Department of Hematology, Institute of Hematology, Henan Provincial People’s Hospital, People’s Hospital of Zhengzhou University, Zhengzhou, China.
3The State Key Laboratory Breeding Base of Basic Science of Stomatology and Key Laboratory of Oral Biomedicine Ministry of Education, School and Hospital of Stomatology, Wuhan University, Wuhan, China.
4Laboratory of Membrane Biology, New York Blood Center, New York, New York, USA.
Address correspondence to: Xiaoli Qu, School of Life Sciences, Zhengzhou University, Science Road 100, Zhengzhou, 450001, China. Phone: 86.17737783785; Email: qv1110xiaoli@126.com. Or to: Xiuli An, Laboratory of Membrane Biology, New York Blood Center, New York, New York, 10065, USA. Phone: 212.570.3247; Email: xan@nybc.org. Or to: Lixiang Chen, School of Life Sciences, Zhengzhou University, Science Road 100, Zhengzhou, 450001, China. Phone: 86.18538086609; Email: lxchen@zzu.edu.cn.
Authorship note: LZ and Huizhi Zhao contributed equally to this work.
Find articles by Zhang, S. in: PubMed | Google Scholar
1School of Life Sciences, Zhengzhou University, Zhengzhou, China.
2Department of Hematology, Institute of Hematology, Henan Provincial People’s Hospital, People’s Hospital of Zhengzhou University, Zhengzhou, China.
3The State Key Laboratory Breeding Base of Basic Science of Stomatology and Key Laboratory of Oral Biomedicine Ministry of Education, School and Hospital of Stomatology, Wuhan University, Wuhan, China.
4Laboratory of Membrane Biology, New York Blood Center, New York, New York, USA.
Address correspondence to: Xiaoli Qu, School of Life Sciences, Zhengzhou University, Science Road 100, Zhengzhou, 450001, China. Phone: 86.17737783785; Email: qv1110xiaoli@126.com. Or to: Xiuli An, Laboratory of Membrane Biology, New York Blood Center, New York, New York, 10065, USA. Phone: 212.570.3247; Email: xan@nybc.org. Or to: Lixiang Chen, School of Life Sciences, Zhengzhou University, Science Road 100, Zhengzhou, 450001, China. Phone: 86.18538086609; Email: lxchen@zzu.edu.cn.
Authorship note: LZ and Huizhi Zhao contributed equally to this work.
Find articles by Zhang, H. in: PubMed | Google Scholar
1School of Life Sciences, Zhengzhou University, Zhengzhou, China.
2Department of Hematology, Institute of Hematology, Henan Provincial People’s Hospital, People’s Hospital of Zhengzhou University, Zhengzhou, China.
3The State Key Laboratory Breeding Base of Basic Science of Stomatology and Key Laboratory of Oral Biomedicine Ministry of Education, School and Hospital of Stomatology, Wuhan University, Wuhan, China.
4Laboratory of Membrane Biology, New York Blood Center, New York, New York, USA.
Address correspondence to: Xiaoli Qu, School of Life Sciences, Zhengzhou University, Science Road 100, Zhengzhou, 450001, China. Phone: 86.17737783785; Email: qv1110xiaoli@126.com. Or to: Xiuli An, Laboratory of Membrane Biology, New York Blood Center, New York, New York, 10065, USA. Phone: 212.570.3247; Email: xan@nybc.org. Or to: Lixiang Chen, School of Life Sciences, Zhengzhou University, Science Road 100, Zhengzhou, 450001, China. Phone: 86.18538086609; Email: lxchen@zzu.edu.cn.
Authorship note: LZ and Huizhi Zhao contributed equally to this work.
Find articles by Zhang, H. in: PubMed | Google Scholar
1School of Life Sciences, Zhengzhou University, Zhengzhou, China.
2Department of Hematology, Institute of Hematology, Henan Provincial People’s Hospital, People’s Hospital of Zhengzhou University, Zhengzhou, China.
3The State Key Laboratory Breeding Base of Basic Science of Stomatology and Key Laboratory of Oral Biomedicine Ministry of Education, School and Hospital of Stomatology, Wuhan University, Wuhan, China.
4Laboratory of Membrane Biology, New York Blood Center, New York, New York, USA.
Address correspondence to: Xiaoli Qu, School of Life Sciences, Zhengzhou University, Science Road 100, Zhengzhou, 450001, China. Phone: 86.17737783785; Email: qv1110xiaoli@126.com. Or to: Xiuli An, Laboratory of Membrane Biology, New York Blood Center, New York, New York, 10065, USA. Phone: 212.570.3247; Email: xan@nybc.org. Or to: Lixiang Chen, School of Life Sciences, Zhengzhou University, Science Road 100, Zhengzhou, 450001, China. Phone: 86.18538086609; Email: lxchen@zzu.edu.cn.
Authorship note: LZ and Huizhi Zhao contributed equally to this work.
Find articles by Kang, Q. in: PubMed | Google Scholar
1School of Life Sciences, Zhengzhou University, Zhengzhou, China.
2Department of Hematology, Institute of Hematology, Henan Provincial People’s Hospital, People’s Hospital of Zhengzhou University, Zhengzhou, China.
3The State Key Laboratory Breeding Base of Basic Science of Stomatology and Key Laboratory of Oral Biomedicine Ministry of Education, School and Hospital of Stomatology, Wuhan University, Wuhan, China.
4Laboratory of Membrane Biology, New York Blood Center, New York, New York, USA.
Address correspondence to: Xiaoli Qu, School of Life Sciences, Zhengzhou University, Science Road 100, Zhengzhou, 450001, China. Phone: 86.17737783785; Email: qv1110xiaoli@126.com. Or to: Xiuli An, Laboratory of Membrane Biology, New York Blood Center, New York, New York, 10065, USA. Phone: 212.570.3247; Email: xan@nybc.org. Or to: Lixiang Chen, School of Life Sciences, Zhengzhou University, Science Road 100, Zhengzhou, 450001, China. Phone: 86.18538086609; Email: lxchen@zzu.edu.cn.
Authorship note: LZ and Huizhi Zhao contributed equally to this work.
Find articles by Chen, L. in: PubMed | Google Scholar
1School of Life Sciences, Zhengzhou University, Zhengzhou, China.
2Department of Hematology, Institute of Hematology, Henan Provincial People’s Hospital, People’s Hospital of Zhengzhou University, Zhengzhou, China.
3The State Key Laboratory Breeding Base of Basic Science of Stomatology and Key Laboratory of Oral Biomedicine Ministry of Education, School and Hospital of Stomatology, Wuhan University, Wuhan, China.
4Laboratory of Membrane Biology, New York Blood Center, New York, New York, USA.
Address correspondence to: Xiaoli Qu, School of Life Sciences, Zhengzhou University, Science Road 100, Zhengzhou, 450001, China. Phone: 86.17737783785; Email: qv1110xiaoli@126.com. Or to: Xiuli An, Laboratory of Membrane Biology, New York Blood Center, New York, New York, 10065, USA. Phone: 212.570.3247; Email: xan@nybc.org. Or to: Lixiang Chen, School of Life Sciences, Zhengzhou University, Science Road 100, Zhengzhou, 450001, China. Phone: 86.18538086609; Email: lxchen@zzu.edu.cn.
Authorship note: LZ and Huizhi Zhao contributed equally to this work.
Find articles by An, X. in: PubMed | Google Scholar
1School of Life Sciences, Zhengzhou University, Zhengzhou, China.
2Department of Hematology, Institute of Hematology, Henan Provincial People’s Hospital, People’s Hospital of Zhengzhou University, Zhengzhou, China.
3The State Key Laboratory Breeding Base of Basic Science of Stomatology and Key Laboratory of Oral Biomedicine Ministry of Education, School and Hospital of Stomatology, Wuhan University, Wuhan, China.
4Laboratory of Membrane Biology, New York Blood Center, New York, New York, USA.
Address correspondence to: Xiaoli Qu, School of Life Sciences, Zhengzhou University, Science Road 100, Zhengzhou, 450001, China. Phone: 86.17737783785; Email: qv1110xiaoli@126.com. Or to: Xiuli An, Laboratory of Membrane Biology, New York Blood Center, New York, New York, 10065, USA. Phone: 212.570.3247; Email: xan@nybc.org. Or to: Lixiang Chen, School of Life Sciences, Zhengzhou University, Science Road 100, Zhengzhou, 450001, China. Phone: 86.18538086609; Email: lxchen@zzu.edu.cn.
Authorship note: LZ and Huizhi Zhao contributed equally to this work.
Find articles by Qu, X. in: PubMed | Google Scholar
Published March 10, 2026 - More info
J Clin Invest. 2026;136(9):e196578. https://doi.org/10.1172/JCI196578.
© 2026 Zhang et al. This work is licensed under the Creative Commons Attribution 4.0 International License. To view a copy of this license, visit http://creativecommons.org/licenses/by/4.0/.
Received: June 30, 2025; Accepted: February 26, 2026


-
Results
Deletion of Mettl3 using EpoR-tdTomato-Cre led to microcytic hypochromic anemia in mice. A previous study showed that knockdown of METTL3 in CD34+ cells impaired human erythropoiesis in vitro (32). To investigate the functional role of Mettl3 during erythropoiesis in vivo, we crossed Mettl3fl/fl mice (35) with EpoR-tdTomato-Cre mice, which efficiently recombine in erythroid cells and erythroblastic island (EBI) macrophages (33). The genotype was assessed by PCR (Figure 1A). As shown in Supplemental Figure 1, A–C, embryos of the Mettl3fl/fl EpoRCre/cre were smaller and appeared paler at the E14.5–E16.5 stages, yet their numbers remained consistent with Mendelian ratios (Supplemental Figure 1D; supplemental material available online with this article; https://doi.org/10.1172/JCI196578DS1). However, no individuals survived by 3 weeks after birth, suggesting perinatal lethality.
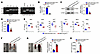 Figure 1
Mettl3 deletion using EpoR-tdTomato-Cre led to anemia in mice. (A) PCR genotyping analysis of EpoR-tdTomato-Cre and Mettl3-floxed mice. (B) Mettl3 mRNA expression level measured by qRT-PCR and normalized to β-actin in erythroid cells (n = 6/group). (C) Representative Western blot and quantitative analysis of Mettl3 knockout efficiency in mice erythroid cells (n = 3/group). (D) Quantification of m6A in total RNA of erythroid cells via colorimetric assay (n = 3–4/group). (E) Complete blood cell count analysis of peripheral blood (n = 9–10/group). (F) Representative images of dissected femurs. (G) Representative images of spleens and quantification of splenomegaly by spleen-to-body weight ratio (n = 7/group). (H) Mice serum EPO levels as measured by ELISA (n = 4/group). Data are presented as the mean ± SD. Comparisons between 2 groups were performed using an unpaired 2-tailed Student’s t test. *P < 0.05, **P < 0.01, ***P < 0.001. MCH, mean cellular hemoglobin; MCV, mean corpuscular volume.
To investigate the cause of lethality in the Mettl3fl/fl EpoRCre/cre mice, we analyzed E16.5 fetal liver cells and observed a significant reduction in the total cellularity along with exhaustion of long-term HSCs and a severe decrease in erythroid cells (Supplemental Figure 1, E–G). For subsequent studies, Mettl3fl/fl EpoRCre/– mice were used. As expected, Mettl3 was completely deleted in erythroid cells, as shown by the absence of its mRNA (Figure 1B) and protein (Figure 1C). Consequently, the global m6A level was significantly decreased in the enriched erythroid cells from the Mettl3fl/fl EpoRCre/– mice (Figure 1D). Analyses of peripheral blood revealed microcytic hypochromic anemia of the Mettl3fl/fl EpoRCre/– mice, as demonstrated by decreases in RBC counts, HGB, hematocrit (HCT), mean corpuscular volume, and mean cellular hemoglobin, along with increase in Retics (Figure 1E). Consistent with the decreased mean corpuscular volume, peripheral blood smear also revealed decreased size of mature erythrocytes of Mettl3fl/fl EpoRCre/– mice compared with control mice (Supplemental Figure 2A). Because microcytic hypochromic anemia is associated with impaired HGB synthesis (36), we examined the expression of genes involved in HGB biosynthesis and found that Alas2 and Fech, the key genes involved in heme biosynthesis, as well as α- and β-globin genes were significantly decreased in Mettl3-deficient erythroblasts compared with control erythroblasts (Supplemental Figure 2, B–G).
To determine if Mettl3 directly regulates HGB synthesis via m6A, we performed methylated RNA IP quantitative PCR (MeRIP-qPCR) using erythroblasts. Supplemental Figure 2, H–K, shows that high levels of m6A were detected on Alas2, Fech, Hba, and Hbb in control cells. Notably, Mettl3 deletion led to a reduction of m6A levels on Fech, Hba, and Hbb, but not Alas2. Moreover, the femur of Mettl3fl/fl EpoRCre/– mice was markedly paler (Figure 1F) and the spleen size of Mettl3fl/fl EpoRCre/– mice was significantly bigger (Figure 1G). Consistent with splenomegaly, Mettl3-deficient mice exhibited significantly increased blood EPO levels (Figure 1H) and an expansion of erythroblasts in the spleen (Supplemental Figure 3) compared with control mice. These findings demonstrate that deletion of Mettl3 using EpoR-tdTomato-Cre in mice resulted in compensatory microcytic hypochromic anemia.
Deletion of Mettl3 in erythroid cells resulted in impaired erythropoiesis. To investigate the cellular mechanisms for the anemia in Mettl3fl/fl EpoRCre/– mice, we first assessed erythroid progenitors in the BM by erythroid colony-forming assay using total BM cells and found that both BFU-E (Figure 2A) and CFU-E (Figure 2B) colonies were significantly decreased in the BM cells of the Mettl3fl/fl EpoRCre/– mice compared with control mice. We further analyzed erythroid progenitors by flow cytometry in which BFU-E and CFU-E cells were defined as Kit+CD71– and Kit+CD71+, respectively (33). Notably, the expression levels of Kit on Mettl3-deficient CFU-E cells were significantly decreased, with a subset of CFU-E cells exhibiting drastic reduction. Based on the expression levels of Kit, the Mettl3-deficient CFU-E cells could be divided into 2 populations, which we referred to as CFU-E and CFU-EKit-lo cells, respectively (Figure 2C and Supplemental Figure 4). Quantitative analysis of MFI revealed that Mettl3 deletion reduced the Kit expression by approximately 34% on CFU-E and approximately 89% on CFU-EKit-lo populations (Figure 2D). In parallel with decreased surface expression, the mRNA levels of Kit were also significantly decreased (Figure 2E).
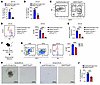 Figure 2
Mettl3 deficiency in erythroid cells impaired mouse BM erythropoiesis. (A) Quantification of BFU-E colonies in 5 × 10⁴ BM cells (n = 4/group). (B) Quantification of CFU-E colonies in 5 × 10⁴ BM cells (n = 6–8/group). (C) Flow cytometric analysis of erythroid progenitors. Contour plots display gated 7AAD–Lin–CD16/32–CD41–CD34–Sca1– cells, with BFU-E (Kit+CD71–) and CFU-E (Kit+CD71+) populations delineated. CFU-EKit-lo indicate the CFU-E subpopulation with reduced Kit expression in Mettl3-deficient mice. (D) Flow cytometric analysis and quantification of Kit expression on CFU-E cells (n = 3/group). (E) Quantification of Kit mRNA expression in control and Mettl3-deficient CFU-E cells by qRT-PCR (n = 3/group). (F) Schematic of the EPO administration in mice. (G) Analysis of Kit expression in CFU-E cells by flow cytometry at 3 days after EPO injection (n = 3/group). (H) Representative images of sorted BFU-E colonies from mice BM. Scale bar: 100 μm. (I) Representative images of sorted CFU-E colonies from mice BM. Scale bar: 100 μm. (J) Quantification of mice BM erythroblasts numbers (n = 6/group). Data are presented as the mean ± SD. Comparisons between 2 groups were performed using an unpaired 2-tailed Student’s t test. A 2-way ANOVA with Tukey’s post hoc test was used to calculate statistical significance among multiple groups. **P < 0.01, ***P < 0.001.
Given that EPO has been reported to suppress Kit expression in erythroid cell lines (37) and that EPO levels were increased in Mettl3-deficient mice, we examined the effect of EPO on Kit expression on erythroid progenitors in vivo. We found that EPO injection led to an approximately 29% reduction of Kit expression on CFU-E cells (Figure 2, F and G), indicating the decreased expression of Kit on Mettl3-deficient CFU-E cells could be due to increased EPO levels; the reason for the approximately 89% decrease on CFU-EKit-lo cells remains unclear.
We further sorted BFU-E and CFU-E cells and examined their colony-forming abilities and found that the BFU-E colonies and CFU-E colonies formed by the sorted Mettl3-deficient BFU-E cells and CFU- E cells were much smaller than the corresponding control BFU-E and CFU-E cells (Figure 2, H and I). Furthermore, the sorted CFU-EKit-lo cells could not form colonies. We stained erythroblasts using Ter119, CD44, and forward scatter as parameters (3) and found that erythroblasts were significantly decreased in the BM of the Mettl3fl/fl EpoRCre/– mice (Figure 2J and Supplemental Figure 5). These findings demonstrate that deletion of Mettl3 using the EpoR-tdTomato-Cre significantly impaired erythropoiesis.
We recently showed that in addition to erythroid cells, EpoR is also expressed in EBI macrophages (33). To examine whether deletion of Mettl3 in EBI macrophages contributes to the impaired erythropoiesis of the Mettl3fl/fl EpoRCre/– mice, we selectively deleted Mettl3 in macrophages by crossing CD169-tdTomato-Cre mice we recently generated (data not shown) with the Mettl3fl/fl mice to generate Mettl3fl/fl CD169Cre/– mice (Supplemental Figure 6A). As shown in Supplemental Figure 6B, Mettl3 was deleted in the sorted F4/80+CD169-tdTomato EBI macrophages. Notably, Mettl3fl/fl CD169Cre/– mice did not exhibit significant changes in RBCs, HGB, HCT, mean cellular hemoglobin, and Retics (Supplemental Figure 6C). Furthermore, no changes in the percentages of EBI macrophages (Supplemental Figure 6D) and erythroid cells (Supplemental Figure 6E) were detected in the BM of Mettl3fl/fl CD169Cre/– mice compared with control mice. These findings indicate that deletion of Mettl3 in macrophages did not affect EBI macrophages and did not contribute to the anemia and impaired erythropoiesis of the Mettl3fl/fl EpoRCre/– mice.
In addition to erythroid cells and EBI macrophages, we also reported that EpoR is expressed in HSCs (33). We therefore examined whether EpoRCre/– could delete Mettl3 in HSCs and found that the mRNA levels of Mettl3 in lineage–Sca-1+Kit+ cells from the Mettl3fl/fl EpoRCre/– mice were decreased by only about 50% (Supplemental Figure 7A), indicating EpoRCre/– could not efficiently delete Mettl3 in HSCs. Consequently, no significant changes in hematopoietic stem and progenitor cells (HSPCs) were detected between the Mettl3fl/fl EpoRCre/– and control mice (Supplemental Figure 7, B and C). Taken together, the anemia of the Mettl3fl/fl EpoRCre/– mice was mainly attributed to the deletion of Mettl3 in erythroid cells.
Mettl3 deletion led to apoptosis of CFU-E cells and cell-cycle arrest of erythroblasts, due to defective DNA synthesis. The decreases in erythroid progenitors or erythroblasts can be attributed to increases in apoptosis or/and decreases in cell proliferation. We first assessed apoptosis using annexin V and 7AAD staining. Figure 3A shows that although no significant difference was noted between control and Mettl3-deficient BFU-E cells, Mettl3-deficient CFU-E cells, particularly the CFU-Ekit-lo cells, exhibited an increased percentage of apoptotic cells. No differences in apoptosis were noted between control and Mettl3-deficient erythroblasts (Figure 3B). Consistent with flow cytometry analyses, cytospin analyses of the sorted total Mettl3-deficient CFU-E cells exhibited changes that resembled characteristic morphological changes of apoptosis, such as membrane blebbing and nuclear fragments (Figure 3C). In contrast, Mettl3-deficient BFU-E cells (Supplemental Figure 8A) and erythroblasts (Supplemental Figure 8B) appeared morphologically normal. These findings indicate that deficiency of Mettl3 led to selective apoptosis of CFU-E cells.
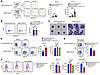 Figure 3
Mettl3 deletion induced apoptosis of CFU-E and cell-cycle arrest of erythroblasts via impaired DNA synthesis. (A) Flow cytometric analysis of apoptosis in BFU-E and CFU-E erythroid progenitors using annexin V and 7AAD staining (n = 4–6/group). (B) Quantification of apoptotic BM erythroblasts by flow cytometry (n = 7/group). (C) Representative cytospin images of sorted CFU-E cells. Red arrows indicate apoptotic CFU-E cells. Scale bar: 10 μm. (D) Flow cytometric analysis of EdU+ cells in BFU-E and CFU-E cells (n = 3/group). (E) Flow cytometric analysis of EdU+ cells in erythroblasts (n = 3/group). (F) Quantification of S-phase MFI of BFU-E cells, CFU-E cells, and erythroblasts (n = 3/group). Data are presented as the mean ± SD. Comparisons between 2 groups were performed using an unpaired 2-tailed Student’s - test. A 2-way ANOVA with Tukey’s post hoc test was used to calculate statistical significance among multiple groups. *P < 0.05, **P < 0.01, ***P < 0.001. FSC-H, forward scatter height.
We next assessed cell proliferation by in vivo 5-ethynyl-2′-deoxyuridine (EdU) incorporation assay (38). We found that while Mettl3-deficient BFU-E and CFU-E cells exhibited increased percentages of EdU+ cells (Figure 3D), the MFI of EdU, which reflects rate of DNA synthesis during S-phase (39, 40), remained the same (Figure 3F), indicating increased DNA synthesis in Mettl3-deficient BFU-E and CFU-E cells without change in DNA synthesis rate. Notably, the MFI of EdU in the CFU-Ekit-lo cells was significantly lower compared with control CFU-E cells (Figure 3F), indicating an imbalance between the accelerated cell cycle and the reduced DNA synthesis rate, which may trigger DNA replication stress and subsequent occurrence of cell apoptosis. In contrast to BFU-E and CFU-E cells, deficiency of Mettl3 resulted in decreased proliferation of erythroblasts, as demonstrated by the decreases in EdU+ erythroblasts (Figure 3E) as well as decreased EdU MFI in Mettl3-deficient erythroblasts (Figure 3F). Together, these findings indicate that Mettl3 deficiency–induced defective DNA synthesis led to apoptosis of CFU-E and cell-cycle arrest of erythroblasts.
RNA-seq analyses revealed alterations in pathways involved in DNA synthesis, DNA damage, and apoptosis in Mettl3-deficient CFU-E. To define the molecular mechanisms for the increased apoptosis of Mettl3-deficient CFU-EKit-lo cells, we performed bulk RNA-seq analyses. Principal component analyses (PCA) showed clear separation of control and Mettl3-deficient cells (Figure 4A). We identified 2,178 differentially expressed genes (DEGs), with 1,218 upregulated and 960 downregulated in Mettl3-deficient CFU-EKit-lo compared with control CFU-E cells (Figure 4, B and C). The list of DEGs is provided in Supplemental Table 1. Gene Ontology (GO) analysis of the DEGs revealed that intrinsic apoptotic signaling pathway in response to DNA damage by p53 class mediator was remarkably upregulated in Mettl3-deficient CFU-EKit-lo cells compared with the control CFU-E cells (Figure 4D), indicating DNA damage in Mettl3-deficient CFU-EKit-lo cells, which was further evidenced by increased levels of phosphorylated H2AX (γ-H2AX) (Figure 4E), a marker of DNA damage and genomic instability (41, 42). Additional pathway analyses revealed that, consistent with the finding of an imbalance between the accelerated cell cycle and the reduced DNA synthesis rate in Mettl3-deficient CFU-EKit-lo cells, genes involved in DNA replication and the cell cycle (namely, Cdc6, Ccnd3, Ccne1/2, Pole, Dbf4, Cdca5, and Pcna) were upregulated, whereas genes required for nucleotide biosynthesis, including Mthfd1, Impdh2, Adss, Shmt1, Suclg1/2, and Ctps2, were downregulated in Mettl3-deficient CFU-EKit-lo cells compared with control CFU-E cells (Figure 4F). Figure 4F also shows upregulation of DNA damage response pathways as evidenced by the upregulated expression of persistent DNA damage markers (Mdc1, Rnf168), replication stress responders (Atad5, Mad2l2, and Fen1), and homologous recombination factors (Brca1, Brca2, and Rad51c). Finally, the expression of proapoptotic genes such as Bax, Bad, Bcl2l11, Casp9, and Cdkn1a was also upregulated. These findings reveal a molecular cascade whereby Mettl3 deficiency disrupts nucleotide biosynthesis, induces replication stress and DNA damage, and ultimately triggers apoptosis in CFU-E cells.
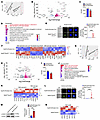 Figure 4
RNA-seq analysis of CFU-E cells and ProEs. (A) PCA of transcriptomes shows the separation between control CFU-E and Mettl3-deficient CFU-EKit-lo cells. (B) Volcano plots of differential expression genes in control CFU-E cells and Mettl3-deficient CFU-EKit-lo cells. (C) Bar plot of DEGs between BM control CFU-E and Mettl3-deficient CFU-EKit-lo cells. (D) GO enrichment analysis of genes upregulated in Mettl3-deficient CFU-EKit-lo cells. (E) Confocal images of control and Mettl3-deficient CFU-EKit-lo cells stained for DNA (Hoechst, blue) and γ-H2AX foci (green), and quantification of γ-H2AX immunofluorescent intensity in Mettl3-deficient mice CFU-EKit-lo cells, normalized to control mice CFU-E cells (n = 5–21/group). (F) Heatmap showing expression levels (TPM) of DNA replication/cell cycle, nucleotide biosynthesis, DNA damage response, and pro-apoptosis–related genes in control CFU-E cells and Mettl3-deficient CFU-EKit-lo cells from RNA-seq data. (G) PCA of transcriptomes revealing distinct clustering between BM control and Mettl3-deficient ProEs. (H) Volcano plots of DEGs in ProEs between control and Mettl3fl/fl EpoRcre/- mice. (I) Bar plot showing numbers of DEGs between BM control and Mettl3-deficient ProEs. (J) GO terms enriched for downregulated genes in Mettl3-deficient ProEs. (K) Heatmap of gene expression for genes involved in DNA replication and DNA damage repair. (L) γ-H2AX immunofluorescence for DNA damage in control and Mettl3-deficient erythroblasts (scale bar: 10 μm), and quantification of γ-H2AX immunofluorescent intensity in Mettl3-deficient mice, normalized to control mice erythroblast cells (n = 11–19/group). (M) Western blot analysis of γ-H2AX expression and corresponding quantification in erythroblast cells (n = 3/group). (N) Heatmap showing TPM of cell-cycle genes in control and Mettl3-deficient ProEs. Data are presented as the mean ± SD. Comparisons between 2 groups were performed using an unpaired 2-tailed Student’s t test. **P < 0.01, ***P < 0.001.
RNA-seq analyses revealed alterations in pathways involved in the DNA replication cell cycle in Mettl3-deficient ProEs. To define the molecular mechanisms for the cell-cycle arrest of Mettl3-deficient erythroblasts, we performed bulk RNA-seq analyses on the sorted ProEs. PCA analyses showed clear separation of control and Mettl3-deficient ProEs (Figure 4G). A total of 1,709 DEGs were identified, with 987 upregulated and 722 downregulated in Mettl3-deficient ProEs compared with control ProEs (Supplemental Table 2 and Figure 4, H and I). Consistent with decreased cell proliferation of the Mettl3-deficient ProEs, GO enrichment analysis revealed significant downregulation of pathways related to the mitotic cell-cycle process, DNA metabolism process, and DNA replication (Figure 4J), as demonstrated by the decreased expression of key DNA replication genes such as Mcm2, Mcm4-7, Cdc45, Pola1, and Rfc3/4, and DNA damage repair factors such as Brca1, Rad51, Rad18, and Wrn (Figure 4K). The decreased expression of these genes strongly suggests potential DNA damage in Mettl3-deficient ProEs, which was confirmed by the increased γ-H2AX expression (Figure 4, L and M). Moreover, genes involved in cell-cycle regulation, such as Ccna2, Ccnb2, Ccnd3, Cdkn1b, Cdc20, and Cdca8, were also decreased in Mettl3-deficient ProEs (Figure 4N). Strikingly, no significant changes were detected in apoptosis-related genes in Mettl3-deficient ProEs, suggesting a distinct response mechanism of ProEs compared with CFU-E cells.
Integrated m6A-seq and RNA-seq analysis identified Mthfd1 as a Mettl3 direct target, the downregulation of which led to defective nucleotide biosynthesis. Next, we sought to define the upstream gene(s) that are responsible for the altered pathways in the Mettl3-deficient CFU-E and ProE cells. For this, we first performed a highly sensitive and efficient super-low-input m6A sequencing (SLIM-seq), using our previously described method (43) on the sorted CFU-E cells. A total of 1,523 genes were identified as being m6A modified in CFU-E cells; these are listed in Supplemental Table 3. We then integrated the m6A-modified mRNAs with the genes that were significantly downregulated in Mettl3-deficient CFU-EKit-lo cells and identified 129 overlapping genes (Figure 5A).
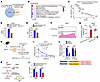 Figure 5
Integrated SLIM-seq/RNA-seq identified Mthfd1 as a Mettl3 target regulating erythroid nucleotide biosynthesis. (A) Integrated analysis of downregulated m6A-modified mRNAs in control and Mettl3-deficient CFU-EKit-lo cells. (B) GO enrichment analysis of the 129 overlapping genes from (A). (C) Significance ranking of DEGs in purine-containing compound biosynthetic processes. (D) Expression levels of Mthfd1 in BM CFU-E cells from RNA-seq by TPM (n = 3/group). (E) Expression levels of Mthfd1 in BM ProEs from RNA-seq by TPM (n = 3/group). (F) Integrative Genomics Viewer snapshots of SLIM-seq read coverage for the Mthfd1 transcriptome in control CFU-E cells, comparing Input and IP groups. (G) Measurement of m6A modification levels on Mthfd1 in control and Mettl3-deficient CFU-E cells by MeRIP-qPCR (n = 3/group). (H) Schematic representation of mRNA half-life measurements in actinomycin D–treated erythroid progenitor CFU-E cells. (I) mRNA half-life of Mthfd1 in sorted CFU-E cells, measured after actinomycin D treatment at 0, 1, 2, and 4 hours. (J) Dual-luciferase reporter assay identifying METTL3-regulated Mthfd1 transcripts. The experiment used pMIR-firefly and TK–Renilla luciferase vectors, with WT and Mut sequences inserted at the 3′UTR of Fluc (n = 4/group). (K) Schematic diagram of MTHFD1-mediated biosynthesis pathway of dTMP and IMP. (L) Targeted liquid chromatography–tandem mass spectroscopy quantification of dTMP and IMP levels in erythroid cells (n = 3/group). Data are presented as the mean ± SD. Comparisons between 2 groups were performed using an unpaired 2-tailed Student’s t test. A 2-way ANOVA with Tukey’s post hoc test was used to calculate statistical significance among multiple groups. **P < 0.01, ***P < 0.001. FC, fold change; PS, penicillin-streptomycin; SCF, stem cell factor.
GO analysis of these genes revealed significant enrichment in the purine-containing compound biosynthetic process pathway (Figure 5B). Notably, the expression of methylenetetrahydrofolate dehydrogenase, cyclohydrolase, and formyltetrahydrofolate synthetase 1 (Mthfd1) (34, 44), the key enzyme for nucleotide biosynthesis, was the most downregulated gene in Mettl3-deficient CFU-EKit-lo cells (Figure 5C). Figure 5D shows that the expression of Mthfd1 was decreased by 50%. Additionally, the expression of Mthfd1 was also decreased in Mettl3-deficient ProEs (Figure 5E). Integrative Genomics Viewer (https://igv.org) showed an obvious enrichment of m6A in Mthfd1 mRNA in normal CFU-E cells (Figure 5F). Additional MeRIP-qPCR experiments revealed a significant decrease in m6A modifications on Mthfd1 mRNA transcripts following Mettl3 knockout (Figure 5G).
Given that m6A modification regulates mRNA stability (24), we then examined stability of Mthfd1 mRNA and found that the half-life of Mthfd1 mRNA was decreased from 1.15 hours in control CFU-E cells to 0.24 hours in Mettl3-deficient CFU-E cells (Figure 5, H and I), indicating the m6A modification of Mthfd1 is crucial for its stability. To further confirm that Mettl3 stabilizes Mthfd1 mRNA in an m6A-dependent manner, we constructed a luciferase reporter with Mthfd1 3′UTR that is enriched with m6A modification or m6A-site mutant (Mut). As expected, the luciferase activity of WT, but not of Mut Mthfd1 3′UTR, was significantly reduced upon METTL3 inhibition, indicating that m6A is required for maintaining Mthfd1 level (Figure 5J). This result indicates that METTL3 directly regulates m6A deposition on Mthfd1, thereby controlling its gene expression. As shown in Figure 5K, MTHFD1 primarily facilitates the conversion of deoxyuridine monophosphate to dTMP by supplying methyl groups to thymidylate synthase, a critical step for DNA synthesis (34). Additionally, it provides carbon units (C2 and C8) for IMP synthesis, thereby contributing to de novo purine biosynthesis (45).
We next quantified changes in metabolites using liquid chromatography–tandem mass spectrometry. Among 540 unique metabolites analyzed, dTMP and IMP were significant reduced in Mettl3-deficient erythroid cells compared with the control cells (Figure 5L and Supplemental Table 4). Together, these results suggest that Mettl3-mediated m6A modification is essential for the stability of Mthfd1 mRNA, the deficiency of which led to defective nucleotide biosynthesis, which, in turn, induced DNA replication stress, leading to DNA damage.
METTL3 inhibition impaired human erythropoiesis via similar mechanisms as in mice. A previous study implicated the role of METTL3 in human erythropoiesis in vitro (32), but the underlying mechanisms remain incompletely understood. To examine whether similar mechanisms exist between murine and human, we inhibited METTL3 activity using STM2457, a highly selective inhibitor of METTL3 (46). As expected, STM2457 treatment led to significant reduction at day 7 of global m6A levels in erythroid cells cultured in vitro (Figure 6A). Erythroid colony assays revealed that STM2457 treatment impaired the colony-forming ability of erythroid progenitors, as demonstrated by the dramatic decreases in colony sizes of BFU-E and CFU-E cells (Figure 6B). STM2457 treatment also inhibited the growth of erythroblasts (Figure 6C). Flow cytometry analysis of apoptosis, using annexin V and 7AAD staining, showed STM2457 treatment led to increased apoptosis of erythroid progenitors as well as erythroblasts (Figure 6D). In alignment with in vivo findings, cell-cycle analysis (Figure 6E) revealed differential effects of STM2457 on CFU-E cells and erythroblasts. Although STM2457 treatment led to the increases of EdU+ CFU-E cells (Figure 6F) along with a decreased DNA synthesis rate (Figure 6G), it led to decreases in both the percentage of EdU+ erythroblasts and DNA synthesis rate (Figure 6, H and I).
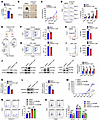 Figure 6
METTL3 inhibition impaired human erythropoiesis. (A) Global m6A levels in total RNA after DMSO or STM2457 treatment (n = 3/group). (B) Colony-forming ability of progenitor cells on day 6. Scale bar: 100 μm. (C) Proliferation curve of human CD34+ cells treated with DMSO or STM2457 (n = 3/group). (D) Representative flow cytometry profiles and quantification of erythroid cell apoptosis (n = 3/group). (E) Schematic illustration and purity assessment of sorted human CFU-E and GPA+ cells for EdU assay. (F) Flow cytometry quantified the proportion of EdU+ erythroid cells in sorted human CFU-E cells and (G) quantification of the EdU MFI in CFU-E cells during S phase (n = 3/group). (H) The proportion of EdU+ erythroid cells was determined by flow cytometry in sorted human GPA+ cells. (I) Measurement of EdU MFI in GPA+ cells during S phase (n = 3/group). (J) Representative Western blot analysis of γ-H2AX, pATM, pATR, and pCHK1 in erythroid cells treated with DMSO or STM2457 on day 7 (n = 3/group). (K) qRT-PCR measurement of MTHFD1 mRNA levels after METTL3 inhibition (n = 3/group). (L) Western blot analysis of MTHFD1 protein level in METTL3-deficient cells (n = 3/group). (M) Exogenous IMP supplementation partially rescued the proliferation deficit in STM2457-treated erythroid cells (n = 3/group). (N) Analysis of the effect of exogenous IMP on apoptosis in STM2457-treated erythroid cells (n = 3/group). (O) Exogenous IMP supplementation partially rescued the cell-cycle defect in STM2457-treated erythroid cells (n = 3/group). Data are presented as mean ± SD. Comparisons between 2 groups were performed using an unpaired 2-tailed Student’s t test. A 2-way ANOVA with Tukey’s post hoc test was used to calculate statistical significance among multiple groups. *P < 0.05, **P < 0.01, ***P < 0.001.
At the molecular level, inhibition of METLL3 in CFU-E cells led to upregulation of pro-apoptotic genes and genes involved in DNA damage response, as well as upregulation of genes involved in cell-cycle regulators and DNA replication (Supplemental Figure 9, A–D). A different expression pattern was observed in METTL3-inhibited erythroblasts, which also showed increased pro-apoptotic and DNA damage response signaling, concurrent with decreased expression of cell cycle and DNA replication (Supplemental Figure 9, E–H) genes. Additionally, shRNA-mediated knockdown of METTL3 also led to reduction in protein level (Supplemental Figure 10A) and global m6A levels (Supplemental Figure 10B), impairment of erythroid colony formation (Supplemental Figure 10C), inhibition of erythroblast growth (Supplemental Figure 10D), and increase in apoptosis of erythroid progenitors and erythroblasts (Supplemental Figure 10E). Notably, both STM2457 treatment and shRNA-mediated METTL3 knockdown resulted in increased expression of γ-H2AX and activated DNA damage sensors, such as pATM, pATR, and pCHK1 (Figure 6J and Supplemental Figure 10F), indicating increased DNA damage. Importantly, METTL3 inhibition also led to decreased expression of MTHFD1 in mRNA (Figure 6K) and protein (Figure 6L and Supplemental Figure 10G) levels. In addition to the downregulation of MTHFD1, STM2457 treatment led to decreased expression of heme synthesis and HGB-related genes (ALAS2, FECH, and HBA). These effects mirrored the in vivo findings and were accompanied by a decrease in the typically high levels of HBG in vitro. Unexpectedly, HBB expression was increased by STM2457 treatment (Supplemental Figure 11, A–E).
Having shown that deletion of Mettl3 in mice led to decreased levels of dTMP and IMP, we performed a rescue assay by supplementing with thymidine (the precursor molecule of dTMP) and IMP in a human erythroid culture system. The results demonstrated that whereas thymidine supplementation failed to restore erythroid cell proliferation (Supplemental Figure 12A), IMP supplementation partially rescued the erythroid defects (Figure 6M). Although IMP did not mitigate erythroid cell apoptosis (Figure 6N), it effectively restored the cell-cycle progression (Figure 6O). These findings indicate that the reduction in IMP contributes partially to the erythroid defects induced by METTL3 inhibition. Consistent with this, intraperitoneal injection of IMP in Mettl3-deficient mice led to partial recovery of RBC count, along with a trending elevation in HCT levels (Supplemental Figure 12B). These findings indicate that deficiency of METTL3 impairs human erythropoiesis via similar mechanisms as in mice.
Knockdown of MTHFD1 in human erythroid cells mimicked the defects caused by METTL3 inhibition. To gain further support that deficiency of METTL3 led to impaired human erythropoiesis via downregulation of MTHFD1, we examined the effects of MTHFD1 knockdown on human erythropoiesis (Figure 7A). Efficient knockdown of MTHFD1 was achieved at both mRNA (Figure 7B) and protein (Figure 7C) levels. Notably, MTHFD1 knockdown phenocopied the effects of METTL3 knockdown on human erythropoiesis, as demonstrated by decreases in BFU-E and CFU-E colony formation (Figure 7D), inhibition of erythroid progenitor and erythroblast proliferation (Figure 7E), and increased apoptosis of both erythroid progenitors and erythroblasts (Figure 7F). Moreover, MTHFD1 knockdown also led to increased DNA damage, as evidenced by an increase in γ-H2AX level (Figure 7G). Cell-cycle analysis revealed that MTHFD1 deficiency inhibited the erythroid cell cycle and slowed the DNA synthesis rate (Figure 7H). These findings further support that METTL3 regulates erythropoiesis, at least in part, via downregulation of MTHFD1.
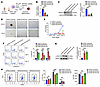 Figure 7
MTHFD1 deficiency in human erythroid cells phenocopied METTL3 inhibition defects. (A) Schematic of lentiviral MTHFD1-shRNA transduction and erythroid differentiation induction (n = 3/group). (B) qRT-PCR analysis of MTHFD1 knockdown efficiency at mRNA level in shRNA-luciferase, 2 groups of shRNA-MTHFD1 transduced cells (labeled shRNA-MTHFD1#1, and shRNA-MTHFD1#5 in the figure) (n = 3/group). (C) Western blot analysis of MTHFD1 knockdown efficiency and corresponding quantification at the protein level (n = 3/group). (D) Colony-forming ability of luciferase-control and MTHFD1-knockdown cells at day 6. Scale bar: 100 μm. (E) Growth curves of luciferase-control and MTHFD1-knockdown cells (n = 3/group). (F) Flow cytometric analysis of apoptosis by 7AAD/annexin V staining at days 7, 9, and 11 (n = 3/group). (G) Western blot analysis of γ-H2AX and corresponding quantification in luciferase-control and MTHFD1-knockdown cells at day 7 (n = 3/group). (H) The proportion of EdU+ cells was quantified by flow cytometry in luciferase-control and MTHFD1-knockdown cells on day 7 and quantification of MFI in EdU+ cells (n = 3/group). Data are presented as the mean ± SD. Two-way ANOVA with Tukey’s post hoc test was used to calculate statistical significance among multiple groups. **P < 0.01, ***P < 0.001.


Copyright © 2026 American Society for Clinical Investigation
ISSN: 0021-9738 (print), 1558-8238 (online)