
Advertisement
Research ArticleAgingCell biologyNeuroscience
Open Access |  10.1172/JCI196094
SHMT2 deficiency disrupts transcriptional regulation through homocysteine-mediated suppression of histone lactylation in Huntington’s disease models
Mingqin Lu,1,2 Kexin Li,1 Shanshan Wu,3 Zhilong Zheng,1 Xinyue Li,1 Shengda Wang,1 Hanwen Yu,3 Chunyue Liu,1 Yueqing Jiang,1 Xueqin Song,4,5 Yan Liu,2,3 and Xing Guo1,2,6
1Department of Neurobiology, School of Basic Medical Sciences,
2State Key Laboratory of Reproductive Medicine and Offspring Health, and
3Institute for Stem Cell and Neural Regeneration, School of Pharmacy, Nanjing Medical University, Nanjing, Jiangsu, China.
4Key Laboratory of Clinical Neurology, Ministry of Education, Hebei Medical University, Shijiazhuang, Hebei, China.
5Department of Neurology, Key Neurological Laboratory of Hebei Province, the Second Hospital of Hebei Medical University, Shijiazhuang, Hebei, China.
6Jiangsu Key Laboratory of Molecular Targets and Intervention for Metabolic Diseases, Nanjing Medical University, Nanjing, Jiangsu, China.
Address correspondence to: Xing Guo, Department of Neurobiology, School of Basic Medical Sciences, State Key Laboratory of Reproductive Medicine and Offspring Health, Nanjing Medical University, 101 Longmian Avenue, Nanjing, Jiangsu 211166, China. Phone: 86.25.86869345; Email: guox@njmu.edu.cn. Or to: Yan Liu, Institute for Stem Cell and Neural Regeneration, State Key Laboratory of Reproductive Medicine and Offspring Health, School of Pharmacy, Nanjing Medical University, 101 Longmian Avenue, Nanjing, Jiangsu 211166, China. Phone: 86.25.86868478; Email: yanliu@njmu.edu.cn. Or to: Xueqin Song, Department of Neurology, Key Laboratory of Clinical Neurology, Ministry of Education, the Second Hospital of Hebei Medical University, 215 Heping West Road, Shijiazhuang, Hebei 050000, China. Phone: 86.0311.66003955; Email: 27100829@hebmu.edu.cn.
Authorship note: MQL, KXL, SSW, and ZLZ contributed equally to this work.
Find articles by Lu, M. in: PubMed | Google Scholar
1Department of Neurobiology, School of Basic Medical Sciences,
2State Key Laboratory of Reproductive Medicine and Offspring Health, and
3Institute for Stem Cell and Neural Regeneration, School of Pharmacy, Nanjing Medical University, Nanjing, Jiangsu, China.
4Key Laboratory of Clinical Neurology, Ministry of Education, Hebei Medical University, Shijiazhuang, Hebei, China.
5Department of Neurology, Key Neurological Laboratory of Hebei Province, the Second Hospital of Hebei Medical University, Shijiazhuang, Hebei, China.
6Jiangsu Key Laboratory of Molecular Targets and Intervention for Metabolic Diseases, Nanjing Medical University, Nanjing, Jiangsu, China.
Address correspondence to: Xing Guo, Department of Neurobiology, School of Basic Medical Sciences, State Key Laboratory of Reproductive Medicine and Offspring Health, Nanjing Medical University, 101 Longmian Avenue, Nanjing, Jiangsu 211166, China. Phone: 86.25.86869345; Email: guox@njmu.edu.cn. Or to: Yan Liu, Institute for Stem Cell and Neural Regeneration, State Key Laboratory of Reproductive Medicine and Offspring Health, School of Pharmacy, Nanjing Medical University, 101 Longmian Avenue, Nanjing, Jiangsu 211166, China. Phone: 86.25.86868478; Email: yanliu@njmu.edu.cn. Or to: Xueqin Song, Department of Neurology, Key Laboratory of Clinical Neurology, Ministry of Education, the Second Hospital of Hebei Medical University, 215 Heping West Road, Shijiazhuang, Hebei 050000, China. Phone: 86.0311.66003955; Email: 27100829@hebmu.edu.cn.
Authorship note: MQL, KXL, SSW, and ZLZ contributed equally to this work.
Find articles by Li, K. in: PubMed | Google Scholar
1Department of Neurobiology, School of Basic Medical Sciences,
2State Key Laboratory of Reproductive Medicine and Offspring Health, and
3Institute for Stem Cell and Neural Regeneration, School of Pharmacy, Nanjing Medical University, Nanjing, Jiangsu, China.
4Key Laboratory of Clinical Neurology, Ministry of Education, Hebei Medical University, Shijiazhuang, Hebei, China.
5Department of Neurology, Key Neurological Laboratory of Hebei Province, the Second Hospital of Hebei Medical University, Shijiazhuang, Hebei, China.
6Jiangsu Key Laboratory of Molecular Targets and Intervention for Metabolic Diseases, Nanjing Medical University, Nanjing, Jiangsu, China.
Address correspondence to: Xing Guo, Department of Neurobiology, School of Basic Medical Sciences, State Key Laboratory of Reproductive Medicine and Offspring Health, Nanjing Medical University, 101 Longmian Avenue, Nanjing, Jiangsu 211166, China. Phone: 86.25.86869345; Email: guox@njmu.edu.cn. Or to: Yan Liu, Institute for Stem Cell and Neural Regeneration, State Key Laboratory of Reproductive Medicine and Offspring Health, School of Pharmacy, Nanjing Medical University, 101 Longmian Avenue, Nanjing, Jiangsu 211166, China. Phone: 86.25.86868478; Email: yanliu@njmu.edu.cn. Or to: Xueqin Song, Department of Neurology, Key Laboratory of Clinical Neurology, Ministry of Education, the Second Hospital of Hebei Medical University, 215 Heping West Road, Shijiazhuang, Hebei 050000, China. Phone: 86.0311.66003955; Email: 27100829@hebmu.edu.cn.
Authorship note: MQL, KXL, SSW, and ZLZ contributed equally to this work.
Find articles by Wu, S. in: PubMed | Google Scholar
1Department of Neurobiology, School of Basic Medical Sciences,
2State Key Laboratory of Reproductive Medicine and Offspring Health, and
3Institute for Stem Cell and Neural Regeneration, School of Pharmacy, Nanjing Medical University, Nanjing, Jiangsu, China.
4Key Laboratory of Clinical Neurology, Ministry of Education, Hebei Medical University, Shijiazhuang, Hebei, China.
5Department of Neurology, Key Neurological Laboratory of Hebei Province, the Second Hospital of Hebei Medical University, Shijiazhuang, Hebei, China.
6Jiangsu Key Laboratory of Molecular Targets and Intervention for Metabolic Diseases, Nanjing Medical University, Nanjing, Jiangsu, China.
Address correspondence to: Xing Guo, Department of Neurobiology, School of Basic Medical Sciences, State Key Laboratory of Reproductive Medicine and Offspring Health, Nanjing Medical University, 101 Longmian Avenue, Nanjing, Jiangsu 211166, China. Phone: 86.25.86869345; Email: guox@njmu.edu.cn. Or to: Yan Liu, Institute for Stem Cell and Neural Regeneration, State Key Laboratory of Reproductive Medicine and Offspring Health, School of Pharmacy, Nanjing Medical University, 101 Longmian Avenue, Nanjing, Jiangsu 211166, China. Phone: 86.25.86868478; Email: yanliu@njmu.edu.cn. Or to: Xueqin Song, Department of Neurology, Key Laboratory of Clinical Neurology, Ministry of Education, the Second Hospital of Hebei Medical University, 215 Heping West Road, Shijiazhuang, Hebei 050000, China. Phone: 86.0311.66003955; Email: 27100829@hebmu.edu.cn.
Authorship note: MQL, KXL, SSW, and ZLZ contributed equally to this work.
Find articles by Zheng, Z. in: PubMed | Google Scholar
1Department of Neurobiology, School of Basic Medical Sciences,
2State Key Laboratory of Reproductive Medicine and Offspring Health, and
3Institute for Stem Cell and Neural Regeneration, School of Pharmacy, Nanjing Medical University, Nanjing, Jiangsu, China.
4Key Laboratory of Clinical Neurology, Ministry of Education, Hebei Medical University, Shijiazhuang, Hebei, China.
5Department of Neurology, Key Neurological Laboratory of Hebei Province, the Second Hospital of Hebei Medical University, Shijiazhuang, Hebei, China.
6Jiangsu Key Laboratory of Molecular Targets and Intervention for Metabolic Diseases, Nanjing Medical University, Nanjing, Jiangsu, China.
Address correspondence to: Xing Guo, Department of Neurobiology, School of Basic Medical Sciences, State Key Laboratory of Reproductive Medicine and Offspring Health, Nanjing Medical University, 101 Longmian Avenue, Nanjing, Jiangsu 211166, China. Phone: 86.25.86869345; Email: guox@njmu.edu.cn. Or to: Yan Liu, Institute for Stem Cell and Neural Regeneration, State Key Laboratory of Reproductive Medicine and Offspring Health, School of Pharmacy, Nanjing Medical University, 101 Longmian Avenue, Nanjing, Jiangsu 211166, China. Phone: 86.25.86868478; Email: yanliu@njmu.edu.cn. Or to: Xueqin Song, Department of Neurology, Key Laboratory of Clinical Neurology, Ministry of Education, the Second Hospital of Hebei Medical University, 215 Heping West Road, Shijiazhuang, Hebei 050000, China. Phone: 86.0311.66003955; Email: 27100829@hebmu.edu.cn.
Authorship note: MQL, KXL, SSW, and ZLZ contributed equally to this work.
Find articles by Li, X. in: PubMed | Google Scholar
1Department of Neurobiology, School of Basic Medical Sciences,
2State Key Laboratory of Reproductive Medicine and Offspring Health, and
3Institute for Stem Cell and Neural Regeneration, School of Pharmacy, Nanjing Medical University, Nanjing, Jiangsu, China.
4Key Laboratory of Clinical Neurology, Ministry of Education, Hebei Medical University, Shijiazhuang, Hebei, China.
5Department of Neurology, Key Neurological Laboratory of Hebei Province, the Second Hospital of Hebei Medical University, Shijiazhuang, Hebei, China.
6Jiangsu Key Laboratory of Molecular Targets and Intervention for Metabolic Diseases, Nanjing Medical University, Nanjing, Jiangsu, China.
Address correspondence to: Xing Guo, Department of Neurobiology, School of Basic Medical Sciences, State Key Laboratory of Reproductive Medicine and Offspring Health, Nanjing Medical University, 101 Longmian Avenue, Nanjing, Jiangsu 211166, China. Phone: 86.25.86869345; Email: guox@njmu.edu.cn. Or to: Yan Liu, Institute for Stem Cell and Neural Regeneration, State Key Laboratory of Reproductive Medicine and Offspring Health, School of Pharmacy, Nanjing Medical University, 101 Longmian Avenue, Nanjing, Jiangsu 211166, China. Phone: 86.25.86868478; Email: yanliu@njmu.edu.cn. Or to: Xueqin Song, Department of Neurology, Key Laboratory of Clinical Neurology, Ministry of Education, the Second Hospital of Hebei Medical University, 215 Heping West Road, Shijiazhuang, Hebei 050000, China. Phone: 86.0311.66003955; Email: 27100829@hebmu.edu.cn.
Authorship note: MQL, KXL, SSW, and ZLZ contributed equally to this work.
Find articles by Wang, S. in: PubMed | Google Scholar
1Department of Neurobiology, School of Basic Medical Sciences,
2State Key Laboratory of Reproductive Medicine and Offspring Health, and
3Institute for Stem Cell and Neural Regeneration, School of Pharmacy, Nanjing Medical University, Nanjing, Jiangsu, China.
4Key Laboratory of Clinical Neurology, Ministry of Education, Hebei Medical University, Shijiazhuang, Hebei, China.
5Department of Neurology, Key Neurological Laboratory of Hebei Province, the Second Hospital of Hebei Medical University, Shijiazhuang, Hebei, China.
6Jiangsu Key Laboratory of Molecular Targets and Intervention for Metabolic Diseases, Nanjing Medical University, Nanjing, Jiangsu, China.
Address correspondence to: Xing Guo, Department of Neurobiology, School of Basic Medical Sciences, State Key Laboratory of Reproductive Medicine and Offspring Health, Nanjing Medical University, 101 Longmian Avenue, Nanjing, Jiangsu 211166, China. Phone: 86.25.86869345; Email: guox@njmu.edu.cn. Or to: Yan Liu, Institute for Stem Cell and Neural Regeneration, State Key Laboratory of Reproductive Medicine and Offspring Health, School of Pharmacy, Nanjing Medical University, 101 Longmian Avenue, Nanjing, Jiangsu 211166, China. Phone: 86.25.86868478; Email: yanliu@njmu.edu.cn. Or to: Xueqin Song, Department of Neurology, Key Laboratory of Clinical Neurology, Ministry of Education, the Second Hospital of Hebei Medical University, 215 Heping West Road, Shijiazhuang, Hebei 050000, China. Phone: 86.0311.66003955; Email: 27100829@hebmu.edu.cn.
Authorship note: MQL, KXL, SSW, and ZLZ contributed equally to this work.
Find articles by Yu, H. in: PubMed | Google Scholar
1Department of Neurobiology, School of Basic Medical Sciences,
2State Key Laboratory of Reproductive Medicine and Offspring Health, and
3Institute for Stem Cell and Neural Regeneration, School of Pharmacy, Nanjing Medical University, Nanjing, Jiangsu, China.
4Key Laboratory of Clinical Neurology, Ministry of Education, Hebei Medical University, Shijiazhuang, Hebei, China.
5Department of Neurology, Key Neurological Laboratory of Hebei Province, the Second Hospital of Hebei Medical University, Shijiazhuang, Hebei, China.
6Jiangsu Key Laboratory of Molecular Targets and Intervention for Metabolic Diseases, Nanjing Medical University, Nanjing, Jiangsu, China.
Address correspondence to: Xing Guo, Department of Neurobiology, School of Basic Medical Sciences, State Key Laboratory of Reproductive Medicine and Offspring Health, Nanjing Medical University, 101 Longmian Avenue, Nanjing, Jiangsu 211166, China. Phone: 86.25.86869345; Email: guox@njmu.edu.cn. Or to: Yan Liu, Institute for Stem Cell and Neural Regeneration, State Key Laboratory of Reproductive Medicine and Offspring Health, School of Pharmacy, Nanjing Medical University, 101 Longmian Avenue, Nanjing, Jiangsu 211166, China. Phone: 86.25.86868478; Email: yanliu@njmu.edu.cn. Or to: Xueqin Song, Department of Neurology, Key Laboratory of Clinical Neurology, Ministry of Education, the Second Hospital of Hebei Medical University, 215 Heping West Road, Shijiazhuang, Hebei 050000, China. Phone: 86.0311.66003955; Email: 27100829@hebmu.edu.cn.
Authorship note: MQL, KXL, SSW, and ZLZ contributed equally to this work.
Find articles by Liu, C. in: PubMed | Google Scholar
1Department of Neurobiology, School of Basic Medical Sciences,
2State Key Laboratory of Reproductive Medicine and Offspring Health, and
3Institute for Stem Cell and Neural Regeneration, School of Pharmacy, Nanjing Medical University, Nanjing, Jiangsu, China.
4Key Laboratory of Clinical Neurology, Ministry of Education, Hebei Medical University, Shijiazhuang, Hebei, China.
5Department of Neurology, Key Neurological Laboratory of Hebei Province, the Second Hospital of Hebei Medical University, Shijiazhuang, Hebei, China.
6Jiangsu Key Laboratory of Molecular Targets and Intervention for Metabolic Diseases, Nanjing Medical University, Nanjing, Jiangsu, China.
Address correspondence to: Xing Guo, Department of Neurobiology, School of Basic Medical Sciences, State Key Laboratory of Reproductive Medicine and Offspring Health, Nanjing Medical University, 101 Longmian Avenue, Nanjing, Jiangsu 211166, China. Phone: 86.25.86869345; Email: guox@njmu.edu.cn. Or to: Yan Liu, Institute for Stem Cell and Neural Regeneration, State Key Laboratory of Reproductive Medicine and Offspring Health, School of Pharmacy, Nanjing Medical University, 101 Longmian Avenue, Nanjing, Jiangsu 211166, China. Phone: 86.25.86868478; Email: yanliu@njmu.edu.cn. Or to: Xueqin Song, Department of Neurology, Key Laboratory of Clinical Neurology, Ministry of Education, the Second Hospital of Hebei Medical University, 215 Heping West Road, Shijiazhuang, Hebei 050000, China. Phone: 86.0311.66003955; Email: 27100829@hebmu.edu.cn.
Authorship note: MQL, KXL, SSW, and ZLZ contributed equally to this work.
Find articles by Jiang, Y. in: PubMed | Google Scholar
1Department of Neurobiology, School of Basic Medical Sciences,
2State Key Laboratory of Reproductive Medicine and Offspring Health, and
3Institute for Stem Cell and Neural Regeneration, School of Pharmacy, Nanjing Medical University, Nanjing, Jiangsu, China.
4Key Laboratory of Clinical Neurology, Ministry of Education, Hebei Medical University, Shijiazhuang, Hebei, China.
5Department of Neurology, Key Neurological Laboratory of Hebei Province, the Second Hospital of Hebei Medical University, Shijiazhuang, Hebei, China.
6Jiangsu Key Laboratory of Molecular Targets and Intervention for Metabolic Diseases, Nanjing Medical University, Nanjing, Jiangsu, China.
Address correspondence to: Xing Guo, Department of Neurobiology, School of Basic Medical Sciences, State Key Laboratory of Reproductive Medicine and Offspring Health, Nanjing Medical University, 101 Longmian Avenue, Nanjing, Jiangsu 211166, China. Phone: 86.25.86869345; Email: guox@njmu.edu.cn. Or to: Yan Liu, Institute for Stem Cell and Neural Regeneration, State Key Laboratory of Reproductive Medicine and Offspring Health, School of Pharmacy, Nanjing Medical University, 101 Longmian Avenue, Nanjing, Jiangsu 211166, China. Phone: 86.25.86868478; Email: yanliu@njmu.edu.cn. Or to: Xueqin Song, Department of Neurology, Key Laboratory of Clinical Neurology, Ministry of Education, the Second Hospital of Hebei Medical University, 215 Heping West Road, Shijiazhuang, Hebei 050000, China. Phone: 86.0311.66003955; Email: 27100829@hebmu.edu.cn.
Authorship note: MQL, KXL, SSW, and ZLZ contributed equally to this work.
Find articles by Song, X. in: PubMed | Google Scholar
1Department of Neurobiology, School of Basic Medical Sciences,
2State Key Laboratory of Reproductive Medicine and Offspring Health, and
3Institute for Stem Cell and Neural Regeneration, School of Pharmacy, Nanjing Medical University, Nanjing, Jiangsu, China.
4Key Laboratory of Clinical Neurology, Ministry of Education, Hebei Medical University, Shijiazhuang, Hebei, China.
5Department of Neurology, Key Neurological Laboratory of Hebei Province, the Second Hospital of Hebei Medical University, Shijiazhuang, Hebei, China.
6Jiangsu Key Laboratory of Molecular Targets and Intervention for Metabolic Diseases, Nanjing Medical University, Nanjing, Jiangsu, China.
Address correspondence to: Xing Guo, Department of Neurobiology, School of Basic Medical Sciences, State Key Laboratory of Reproductive Medicine and Offspring Health, Nanjing Medical University, 101 Longmian Avenue, Nanjing, Jiangsu 211166, China. Phone: 86.25.86869345; Email: guox@njmu.edu.cn. Or to: Yan Liu, Institute for Stem Cell and Neural Regeneration, State Key Laboratory of Reproductive Medicine and Offspring Health, School of Pharmacy, Nanjing Medical University, 101 Longmian Avenue, Nanjing, Jiangsu 211166, China. Phone: 86.25.86868478; Email: yanliu@njmu.edu.cn. Or to: Xueqin Song, Department of Neurology, Key Laboratory of Clinical Neurology, Ministry of Education, the Second Hospital of Hebei Medical University, 215 Heping West Road, Shijiazhuang, Hebei 050000, China. Phone: 86.0311.66003955; Email: 27100829@hebmu.edu.cn.
Authorship note: MQL, KXL, SSW, and ZLZ contributed equally to this work.
Find articles by
Liu, Y.
in:
PubMed
|
Google Scholar
|

1Department of Neurobiology, School of Basic Medical Sciences,
2State Key Laboratory of Reproductive Medicine and Offspring Health, and
3Institute for Stem Cell and Neural Regeneration, School of Pharmacy, Nanjing Medical University, Nanjing, Jiangsu, China.
4Key Laboratory of Clinical Neurology, Ministry of Education, Hebei Medical University, Shijiazhuang, Hebei, China.
5Department of Neurology, Key Neurological Laboratory of Hebei Province, the Second Hospital of Hebei Medical University, Shijiazhuang, Hebei, China.
6Jiangsu Key Laboratory of Molecular Targets and Intervention for Metabolic Diseases, Nanjing Medical University, Nanjing, Jiangsu, China.
Address correspondence to: Xing Guo, Department of Neurobiology, School of Basic Medical Sciences, State Key Laboratory of Reproductive Medicine and Offspring Health, Nanjing Medical University, 101 Longmian Avenue, Nanjing, Jiangsu 211166, China. Phone: 86.25.86869345; Email: guox@njmu.edu.cn. Or to: Yan Liu, Institute for Stem Cell and Neural Regeneration, State Key Laboratory of Reproductive Medicine and Offspring Health, School of Pharmacy, Nanjing Medical University, 101 Longmian Avenue, Nanjing, Jiangsu 211166, China. Phone: 86.25.86868478; Email: yanliu@njmu.edu.cn. Or to: Xueqin Song, Department of Neurology, Key Laboratory of Clinical Neurology, Ministry of Education, the Second Hospital of Hebei Medical University, 215 Heping West Road, Shijiazhuang, Hebei 050000, China. Phone: 86.0311.66003955; Email: 27100829@hebmu.edu.cn.
Authorship note: MQL, KXL, SSW, and ZLZ contributed equally to this work.
Find articles by
Guo, X.
in:
PubMed
|
Google Scholar
|
Published March 10, 2026 - More info
J Clin Invest. 2026;136(9):e196094. https://doi.org/10.1172/JCI196094.
© 2026 Lu et al. This work is licensed under the Creative Commons Attribution 4.0 International License. To view a copy of this license, visit http://creativecommons.org/licenses/by/4.0/.
Received: May 28, 2025; Accepted: March 3, 2026


-
Results
Multi-omics analysis reveals 1C metabolism dysregulation and reduced SHMT2 expression in HD models. To analyze metabolic alterations in HD, we performed targeted metabolomics analysis in HdhQ7 and HdhQ111 cells (Figure 1A). We quantified 256 metabolites in these cells (Supplemental Table 1; supplemental material available online with this article; https://doi.org/10.1172/JCI196094DS1). Compared with HdhQ7 cells, 104 metabolites exhibited notable alterations in HdhQ111 cells (Figure 1B). Notably, metabolites associated with 1C metabolism, including HCY, SAM, S-adenosylhomocysteine, N-acetylmethionine, and glycine, were elevated (Figure 1B and Supplemental Figure 1A). Pathway enrichment analysis revealed notable alterations in several metabolic pathways associated with 1C metabolism, including cysteine and methionine metabolism, purine metabolism, and 1C pool by folate, indicating dysregulation of the 1C metabolic network in HD (Figure 1C). To further validate the transcriptional disruption of 1C metabolism, we performed RNA-seq in human induced pluripotent stem cell–derived (iPSC-derived) striatal organoids generated from a control line (RC01001-A) and an HD patient line (HD42) (Supplemental Figure 1B), using protocols established in our previous study (26). Volcano plot analysis revealed dysregulation of multiple 1C metabolic enzymes, including SHMT2, ALDH1L2, MTHFD2, MTHFD2L, and DHFR, as well as methionine cycle–related genes MAT2B and folate-metabolism-related gene FPGS (Figure 1D and Supplemental Table 2). GSEA further showed that the 1C metabolic process was notably downregulated in human striatal organoids (hSOs) derived from patients with HD (HD-hSOs), accompanied by alterations in synaptic, calcium-homeostasis, and redox-related pathways (Figure 1, E and F). A parallel RNA-seq analysis of HdhQ7 and HdhQ111 cells yielded consistent results, similarly highlighting coordinated dysregulation of key 1C metabolic enzymes (Supplemental Figure 1, C–F, and Supplemental Table 3), demonstrating that 1C metabolic dysfunction is a conserved feature across independent HD models.
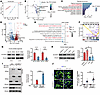 Figure 1
Multi-omics analysis reveals 1C metabolism dysregulation and reduced SHMT2 expression in HD models. (A) Principal component analysis (PCA) of metabolomic profiles in HdhQ7 and HdhQ111 cells. (B) Volcano plot showing substantially altered metabolites in HdhQ111 cells relative to HdhQ7 cells. One-carbon metabolism–related metabolites are highlighted. (C) Pathway enrichment analysis of markedly altered metabolites between HdhQ7 and HdhQ111 cells. (D) Volcano plot of DEGs in HD-hSOs (HD42) versus control hSOs (RC01001-A), showing widespread transcriptional alterations. (E) GSEA (GO Biological Process) showing pathway changes in HD-hSOs. (F) GSEA enrichment plot for the 1-carbon metabolic process gene set. (G) Immunoblot analysis of SHMT2 protein levels in hSOs derived from HD patient iPSCs (HD42) and iPSCs from a control line (ihtc-03) at D30 and D60 (n = 3). (H) Immunoblot analysis of SHMT2 protein levels in additional hSOs derived from HD patient iPSCs (HD66 and HD40) and control iPSCs (IMR90-4 and RC01001-A) at D30 (n = 3). (I) Soluble and insoluble HTTEx1-Q23/Q73 in control and SHMT2-knockdown HdhQ7 cells transfected with Myc-tagged HTTEx1-Q23 or HTTEx1-Q73 for 48 hours (n = 3). (J) Representative immunofluorescence images and quantification of polyQ aggregates in control and SHMT2-knockdown HdhQ7 cells transfected with GFP-tagged HTTEx1-Q23 or HTTEx1-Q73. Arrows indicate visible aggregates (scale bar: 20 μm; n = 3). Data are shown as the mean ± SEM. Unpaired t test was used for G, nested t test was used for H, and 1-way ANOVA with Tukey’s test was used for I and J. *P < 0.05, **P < 0.01, ****P < 0.0001.
SHMT2 is a central regulator of mt-1C metabolism and plays a crucial role in folate cycle regulation, nucleotide biosynthesis, and redox homeostasis. Its disruption impairs mitochondrial function, leading to metabolic imbalances and increased oxidative stress. We therefore assessed SHMT2 abundance in day 30 (D30) and D60 hSOs derived from a control line (ihtc-03) and HD42, and found a marked decrease in HD-hSOs (Figure 1G). Furthermore, this reduction was also observed in hSOs generated from additional control (IMR90-4, RC01001-A) and HD (HD66, HD40) iPSC line and was independently confirmed in hSO-derived neurons from 3 control and 3 HD lines, supporting the robustness of this finding (Figure 1H and Supplemental Figure 1G). Additionally, we confirmed the reduction of SHMT2 levels in multiple HD models, including HdhQ111 cells and YAC128 mice, compared with their respective controls (Supplemental Figure 1, H and I). Western blot analysis showed an increase in insoluble polyQ protein levels in SHMT2-deficient cells, while immunostaining revealed a corresponding rise in the number of cells with polyQ aggregates (Figure 1, I and J, and Supplemental Figure 1, J and K). Together, these findings demonstrate that 1C metabolism is dysregulated in HD, with SHMT2 downregulation associated with increased polyQ aggregate accumulation.
Loss of SHMT2 induces neuronal degeneration in iPSCs-derived hSOs. To elucidate the function of SHMT2 in the MSNs, we first isolated primary MSNs from the striatum of WT mice (Figure 2A). The cultured neurons were treated with SHIN1, a potent inhibitor targeting SHMT isoforms, which are essential for 1C metabolism and catalyze the conversion of serine to glycine (27). Inhibition of SHMT decreased neurite complexity, as indicated by a reduced number of intersections among microstructured networks and a shortened longest neurite length (Figure 2, B and C). In addition, neuronal soma size was increased, suggesting potential alterations in cellular structure or homeostatic regulation (Figure 2D). To assess neuronal function, we measured calcium signaling in neurons derived from hSOs and found that SHMT inhibition substantially reduced the peak Ca2+ response to KCl stimulation (Figure 2, E and F). Furthermore, we analyzed DARPP-32+ and CTIP2+ neuronal populations, key markers of MSNs, and found that their proportions were markedly reduced in hSOs treated with SHIN1 (Figure 2G), along with increased cleaved-caspase-3+ apoptosis in DARPP-32+ neurons (Supplemental Figure 2A). We next generated iPSC lines with reduced SHMT2 expression using CRISPR interference (CRISPRi) technology (Figure 2H). Using 2 independent sgRNAs, SHMT2 knockdown reduced the proportions of DARPP-32+ MSNs and CTIP2+ neurons within hSOs, with single-cell analysis confirming a concordant decrease specifically in the DARPP-32+ MSN population and also impaired neurite complexity, as assessed by Sholl analysis (Figure 2, I–K, and Supplemental Figure 2, B–F). Importantly, SHMT2 deletion led to robust neuronal apoptosis, with elevated cleaved caspase-3 and fragmented nuclei observed in NeuN+ neurons in hSOs and in dissociated DARPP-32+ neurons (Figure 2, L and M, and Supplemental Figure 2, G–I). Together, these results demonstrate that SHMT2 is essential for maintaining MSN structural integrity, functional activity, and survival in hSOs.
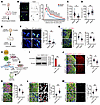 Figure 2
Loss of SHMT2 induces neuronal degeneration in iPSCs-derived hSOs. (A and B) Schematic of SHIN1 treatment in primary striatal neurons and Sholl analysis of neuronal complexity after 48 hours of SHIN1 (10 μM) or DMSO at DIV3 (scale bar: 10 μm; n = 60). (C and D) Quantification of longest neurite length and soma size in primary striatal neurons treated for 48 hours with SHIN1 (10 μM) or DMSO at DIV3 (n = 3). (E and F) Schematic of SHIN1 treatment in hSO-derived neurons and calcium imaging showing baseline and KCl–evoked (67 mM) responses, with quantification of peak Ca2+ signals after 48 hours of DMSO or SHIN1 treatment (scale bar: 20 μm; n = 3). (G) DARPP-32 (green) and CTIP2 (red) staining in D60 hSOs after 7 days of SHIN1 treatment (scale bar: 20 μm; n = 3). (H and I) Schematic of CRISPRi-mediated SHMT2 knockdown in iPSCs and immunoblot validation of SHMT2 reduction in hSOs derived from sgRNA-transduced iPSCs (n = 3). (J and K) Representative images of DARPP-32/GFP and CTIP2/GFP costaining in control and SHMT2-knockdown hSOs at D60, with quantification of DARPP-32+ and CTIP2+ cell proportions (scale bar: 20 μm; n = 3). (L) Nuclear fragmentation in NeuN+ neurons from control and SHMT2-knockdown hSOs at D60, with quantification of fragmented nuclei (scale bar: 10 μm; n = 3). (M) Cleaved caspase-3 staining in NeuN+ neurons from control and SHMT2-deficient hSOs at D60, with quantification of cleaved caspase-3+ neurons (scale bar: 20 μm; n = 3). Data are shown as the mean ± SEM. Two-way ANOVA with Šídák’s test was used for B; unpaired t test for C, D, F, G, and I–M. *P < 0.05, **P < 0.01, ***P < 0.001, ****P < 0.0001.
SHMT2 deficiency induces neurodegeneration and motor dysfunction in vivo. To further investigate the role of SHMT2 in vivo, we generated adeno-associated virus (AAV) vectors carrying shRNA targeting Shmt2. Two-month-old C57BL/6 mice underwent stereotactic injection of AAV-shSHMT2 or control AAV-shScr into the striatum, followed by behavioral testing and biochemical analysis (Figure 3A). In the striatum of AAV-shSHMT2–injected mice, SHMT2 knockdown resulted in a notable downregulation of DARPP-32, a key regulator of intracellular signaling, synaptic plasticity, and neuronal excitability in MSNs (Figure 3, B and C, and Supplemental Figure 3, A and B). To delineate the transcriptional changes induced by SHMT2 knockdown, we performed comparative RNA-seq on the striatum of SHMT2-knockdown mice and their control littermates. Gene Ontology analysis revealed prominent activation of pathways related to oxidative stress and mitochondrial injury, accompanied by suppression of neuronal functional programs related to synaptic organization, action potential firing, and calcium-mediated signaling (Figure 3, D and E, Supplemental Figure 3C, and Supplemental Table 4). Concurrently, the fluorescence density of GFAP+ astrocytes and IBA1+ microglia was clearly increased, indicative of reactive gliosis and suggestive of ongoing neurodegenerative processes (Figure 3, F and G, and Supplemental Figure 3, D and E). Furthermore, SHMT2 knockdown markedly increased the number of cleaved caspase-3+ cells within GFP+ AAV-infected regions, reflecting enhanced neuronal apoptosis (Figure 3H and Supplemental Figure 3F). To evaluate motor function, we conducted behavioral tests in SHMT2-knockdown mice. In the rotarod test, mice injected with AAV-shSHMT2 exhibited a substantial reduction in latency to fall, indicating impaired motor coordination and balance (Figure 3I and Supplemental Figure 3G). Similarly, beam-walking performance was compromised, as SHMT2-knockdown mice required more time to cross the beam compared with controls (Figure 3J and Supplemental Figure 3H). In the open-field test, SHMT2-knockdown mice showed reduced total distance traveled, fewer center entries, and decreased center distance, reflecting impairments in locomotion and exploratory behavior (Figure 3, K–M, and Supplemental Figure 3, I–K). Collectively, these findings reveal that SHMT2 knockdown in vivo impairs MSN integrity, induces reactive gliosis and neuronal apoptosis, and ultimately results in motor dysfunction.
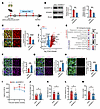 Figure 3
SHMT2 deficiency induces neurodegeneration and motor dysfunction in vivo. (A) Schematic timeline of stereotaxic injections of AAV-shScr or AAV-shSHMT2 into the striatum of 2-month-old mice, followed by behavioral and pathological analyses at indicated time points. (B) SHMT2 and DARPP-32 protein levels in the striatum of AAV-shScr– and AAV-shSHMT2–injected mice (n = 3). (C) DARPP-32 (red) and GFP (green) staining in brain sections from AAV-shScr– and AAV-shSHMT2–injected mice. DARPP-32 fluorescence density is quantified within a 220 μm radius around the injection site (n = 4; scale bar: 20 μm). (D) Volcano plot showing markedly altered genes in striatal RNA-seq of SHMT2-knockdown mice compared with controls. DEG cutoff: |log2FC| ≥ 0.25, Padj ≤ 0.05. (E) GO Biological Process enrichment of DEGs from striatal RNA-seq in SHMT2-knockdown versus control mice. Bubble size reflects gene number; color indicates –log10(Padj). (F) IBA1 (magenta) and GFP staining with fluorescence density quantified within a 220 μm radius around the injection site (n = 4; scale bar: 20 μm). (G) GFAP (magenta) and GFP (green) staining with fluorescence density quantified within a 220 μm radius around the injection site (n = 4; scale bar: 20 μm). (H) Cleaved caspase-3 (red) and GFP (green) in striatal sections; percentage of cleaved caspase-3+ cells among GFP+ cells quantified (n = 3; scale bar: 20 μm). (I–M) Behavioral analyses following AAV-shScr or AAV-shSHMT2 injection in 2-month-old mice (n = 12–13). (I) Rotarod performance measured monthly. (J) Beam-crossing time at 2 months after injection. (K–M) Open-field test at 3 months: total distance (K), center distance (L), and center entries (M). Data are shown as the mean ± SEM. Unpaired t test was used for B, C, and F–M. *P < 0.05, **P < 0.01, ***P < 0.001, ****P < 0.0001.
SHMT2 overexpression ameliorates neurodegeneration both in vivo and in vitro. To explore the effect of SHMT2 on HD-related pathology, we first introduced lentivirus-mediated SHMT2 overexpression into control and HD patient–derived iPSCs, followed by the selection of SHMT2-expressing cells and subsequent differentiation into hSOs (Figure 4A). In HD-hSOs, we observed reduced neurite outgrowth and structural abnormalities, indicative of compromised neuronal integrity (Figure 4B). Notably, SHMT2 overexpression enhanced neurite length and branching, suggesting a protective role in maintaining neuronal structure and stability (Figure 4B and Supplemental Figure 4A). Immunostaining analyses revealed that SHMT2 overexpression increased the proportion of DARPP-32+ and CTIP2+ neurons in HD-hSOs (Figure 4C and Supplemental Figure 4, B–E). In parallel, it markedly reduced the number of cells exhibiting nuclear fragmentation (Figure 4D and Supplemental Figure 4, F and G), suggesting that SHMT2 promotes neuronal identity and mitigates HD-associated cellular degeneration. To determine whether these cellular improvements translate into functional benefits in vivo, we next assessed both molecular and behavioral outcomes in YAC128 HD mice following AAV-SHMT2 delivery (Figure 4E). Transcriptomic profiling revealed that SHMT2 overexpression partially reversed YAC128-associated defects in pathways related to dendritic development, synapse organization, and mitochondrial stress responses (Figure 4, F and G, Supplemental Figure 4H, and Supplemental Table 5). Western blot analysis showed that DARPP-32 levels in the striatum were restored upon SHMT2 overexpression, indicating improved MSN integrity (Figure 4H). SHMT2 overexpression also attenuated astrocytic reactivity and reduced mutant huntingtin (mHTT) immunoreactivity and insoluble mHTT levels within GFP+ striatal regions of YAC128 mice, consistent with a broader amelioration of HD-related pathological features (Figure 4, I and J, and Supplemental Figure 4I). Functionally, YAC128 mice treated with AAV-SHMT2 exhibited markedly improved motor performance. In the rotarod test, mice displayed substantially prolonged latency to fall, reflecting enhanced coordination (Figure 4K). Beam-walking analysis showed shorter crossing times, indicative of improved balance (Figure 4L). Grip strength was also clearly improved compared with control mice (Supplemental Figure 4J). Finally, in the open-field test, treated animals traveled longer total distances, moved more frequently in the center zone, and made more center entries (Figure 4M and Supplemental Figure 4, K and L). Together, these findings identify SHMT2 as a key modulator of neuronal structure, function, and survival in HD, capable of counteracting MSN degeneration and ameliorating behavioral deficits.
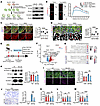 Figure 4
SHMT2 overexpression ameliorates neurodegeneration both in vivo and in vitro. (A) Schematic of lentiviral SHMT2 overexpression in control and HD iPSCs and subsequent hSO differentiation; SHMT2 protein confirmed by Western blot. (B) Neuronal complexity in control hSOs (con-hSOs) and HD-hSOs with or without SHMT2 overexpression, quantified by Sholl analysis (scale bar: 20 μm; n = 60). (C) DARPP-32 and GFP costaining in con-hSOs and HD-hSOs with or without SHMT2 overexpression at D60 (scale bar: 20 μm; n = 3). (D) Nuclear fragmentation in control and SHMT2-overexpressing con-hSOs and HD-hSOs at D60 (scale bar: 10 μm; n = 3). (E) Timeline of AAV-Con and AAV-SHMT2 stereotaxic injections into the striatum of 4-month-old WT and YAC128 mice. (F) Volcano plot illustrating differential gene expression in striatal tissue from YAC128 mice with or without SHMT2 overexpression. DEG cutoff: |log2FC| ≥ 0.25, Padj ≤ 0.05. (G) GO Biological Process enrichment of DEGs from YAC128 mice with or without SHMT2 overexpression. (H) DARPP-32 protein in the striatum of WT and YAC128 mice following AAV-Con or AAV-SHMT2 injection (n = 3). (I) GFAP and GFP staining in the striatum of WT and YAC128 mice after AAV-SHMT2 overexpression (n = 3; scale bar: 20 μm). (J) mHTT immunoreactivity in striatal sections from WT and YAC128 mice with or without AAV-SHMT2 overexpression (n = 3; scale bar: 20 μm). (K–M) Behavioral assessments 2 months after AAV-Con or AAV-SHMT2 injection (n = 14–15). Tests included (K) rotarod test, (L) balance beam test, and (M) open-field test. Data are shown as the mean ± SEM. Two-way ANOVA with Šídák’s test was used for B; 1-way ANOVA with Tukey’s test was used for C, D, and H–M. *P < 0.05, **P < 0.01, ***P < 0.001, ****P < 0.0001.
SHMT2 deficiency drives neurodegeneration via HCY accumulation. HCY is a key intermediate metabolite in the 1C metabolic pathway and has been implicated in neurotoxicity and neurodegeneration (22, 28, 29). Targeted metabolomic analysis revealed that HCY levels were substantially elevated in HD models compared with controls (Supplemental Figure 1A). Given that SHMT2 is a central regulator of mt-1C metabolism, we hypothesized that SHMT2 deficiency in HD could disrupt 1C metabolic homeostasis, leading to HCY accumulation. Supporting this hypothesis, we found that SHMT2 knockdown led to an increase in intracellular HCY levels (Figure 5A), whereas SHMT2 overexpression in HdhQ111 cells effectively reduced HCY concentrations (Figure 5B). To examine the effects of HCY on HD-related pathology, we first investigated whether HCY modulates mHTT aggregation. Using a Q73-overexpressing HdhQ7 cell model, we found that HCY treatment markedly increased the number of cells with polyQ aggregates (Figure 5C), suggesting that elevated HCY levels may exacerbate proteotoxic stress in HD. To further assess the effect of HCY on neuronal integrity, we treated primary MSNs with HCY and observed pronounced morphological alterations, including reduced neurite complexity and a substantial shortening of the longest neurite (Figure 5, D–F), indicative of neuronal atrophy and early-stage degeneration. Intracellular calcium imaging revealed that HCY-treated neurons derived from hSOs exhibited a blunted KCl-induced calcium influx, reflecting impaired neuronal excitability and synaptic signaling (Figure 5G). In addition, HCY exposure resulted in a reduction of DARPP-32+ and CTIP2+ neuronal populations, indicating MSN loss and disruption of striatal neuronal identity (Figure 5H). Furthermore, HCY treatment increased nuclear fragmentation and elevated cleaved caspase-3 levels in NeuN+ neurons within hSOs, confirming enhanced apoptotic activity and neuronal cell death (Figure 5, I and J). Collectively, these findings suggest that SHMT2 deficiency leads to HCY accumulation, which exacerbates polyQ aggregation, impairs neuronal structure and function, and promotes neurodegeneration through apoptotic pathways (Figure 5K).
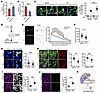 Figure 5
SHMT2 deficiency drives neurodegeneration via HCY accumulation. (A) HCY levels were measured in control and SHMT2-knockdown HdhQ7 cells (n = 3). (B) HdhQ111 cells transfected with Flag-SHMT2 for 48 hours exhibited substantially reduced HCY levels (n = 4). (C) Representative images and quantification of polyQ aggregates in control and HCY-treated HdhQ7 cells expressing GFP-HTTEx1-Q23 or -Q73. Arrows mark aggregates; data show the percentage of GFP+ cells with aggregates (scale bar: 20 μm; n = 3). (D) Schematic illustration of HCY treatment in primary striatal neurons. (E and F) Representative images and Sholl analysis of primary striatal neurons treated with 500 μM HCY for 48 hours, with quantification of longest neurite length (scale bar: 20 μm; 3 biological replicates from 60–91 neurons per group). (G) Reduced KCl-evoked Ca2+ responses in striatal organoid–derived neurons treated with 500 μM HCY for 48 hours compared with controls (scale bar: 10 μm; n = 3). (H) Immunofluorescence analysis of DARPP-32+ (green) and CTIP2+ (red) cells in striatal organoids treated with or without HCY (scale bar: 20 μm; n = 3). (I) Representative images showing nuclear fragmentation in HCY-treated hSOs; arrows mark fragmented nuclei (scale bar: 20 μm; n = 3). (J) Immunofluorescence and quantification of cleaved caspase-3+ cells in control and HCY-treated hSOs (scale bar: 20 μm; n = 3). (K) Schematic summary of SHMT2 deficiency–induced neurodegeneration. Data are shown as mean ± SEM. Unpaired t test was used for A, B, and F–J; 1-way ANOVA with Tukey’s test was used for C; 2-way ANOVA with Šídák’s test was used for E. *P < 0.05, **P < 0.01, ***P < 0.001, ****P < 0.0001.
HCY suppresses histone lactylation through AARS1. Histone lactylation is an emerging posttranslational modification that connects metabolic states to transcriptional regulation, playing critical roles in neuronal function and homeostasis (30, 31). Metabolic intermediates can modulate histone modifications by affecting the activity of associated enzymes (32–34). In this context, we speculated that elevated HCY levels resulting from impaired 1C metabolism might contribute to the dysregulation of histone lactylation. To test this, we first assessed lactylation levels in HdhQ7 and HdhQ111 striatal cells as well as in the striatum of WT and YAC128 mice. Compared with controls, both HdhQ111 cells and YAC128 mouse striata showed markedly reduced histone lactylation (Figure 6, A and B), indicating consistent epigenetic disruption across HD models. SHMT2 knockdown or pharmacological inhibition using SHIN1 produced similar reductions in histone lactylation (Figure 6, C–E), implicating SHMT2 deficiency as a contributing factor. Notably, site-specific lactylation analysis revealed a broad decline in HdhQ111 cells, closely mirrored by SHIN1-treated cells (Supplemental Figure 5, A and B). HCY treatment further suppressed histone lactylation (Figure 6F), reinforcing the link between HCY accumulation and epigenetic perturbation. Importantly, SHMT2 overexpression restored lactylation levels in HD models (Figure 6G and Supplemental Figure 5, C and D). Complementarily, folate supplementation, by enhancing folate cycle activity and reducing HCY accumulation, also rescued histone lactylation defects in both HD models and SHMT2-deficient conditions (Figure 6H and Supplemental Figure 5E), underscoring the critical role of HCY homeostasis in regulating this epigenetic modification. To further elucidate the mechanisms by which HCY influences histone lactylation levels, we performed limited proteolysis–mass spectrometry (LiP-MS) analysis (Supplemental Figure 5F), which identified 1,309 markedly altered peptides (Supplemental Table 6) corresponding to several potential HCY-interacting proteins, including AARS1, p300, HDAC1, and HDAC2 — all of which have been previously implicated in histone lactylation regulation (Figure 6I). To validate their functional relevance in striatal cells, we individually knocked down each of these candidates. Notably, silencing p300, HDAC1, or HDAC2 had minimal effect on histone lactylation, whereas AARS1 knockdown markedly suppressed global histone lactylation levels, suggesting a specific role for AARS1 in this context (Figure 6J and Supplemental Figure 5, G and H). Furthermore, AARS1 depletion abolished the HCY-induced reduction in histone lactylation (Figure 6J and Supplemental Figure 5I), indicating that AARS1 mediates the epigenetic effects of HCY accumulation. Moreover, AARS1 knockdown prevented the reduction in histone lactylation caused by SHMT2 knockdown or SHIN1 treatment (Figure 6K and Supplemental Figure 5, J and K). In contrast, overexpression of AARS1 in HdhQ111 cells led to a notable increase in histone lactylation levels (Figure 6L). Interestingly, despite these functional effects, AARS1 protein levels remained unchanged across multiple HD models (Supplemental Figure 5, L–N), suggesting that HCY may regulate histone lactylation through modulating AARS1 activity rather than altering its expression. To further explore the mechanism by which HCY modulates AARS1 activity, we performed molecular docking analysis of HCY and lactate with the crystal structure of AARS1. The results showed spatial overlap between HCY and lactate at the R77 residue, suggesting a potential competitive binding mechanism in which HCY may displace lactate at the AARS1 active site to exert its functional effects (Figure 6M). Microscale thermophoresis (MST) analysis revealed that HCY can directly bind to AARS1 and competitively interfere with lactate binding, providing direct evidence that HCY disrupts AARS1-mediated histone lactylation through competitive binding (Figure 6, N and O, and Supplemental Figure 5O). Together, these results demonstrate that elevated HCY competitively disrupts AARS1-mediated histone lactylation, contributing to the epigenetic dysregulation observed in HD models.
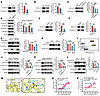 Figure 6
HCY suppresses histone lactylation through AARS1. (A) Comparative immunoblot of pan-histone lactylation in HdhQ111 versus HdhQ7 cells (n = 4). (B) Pan-histone lactylation in striatal tissues from 6-month-old WT and YAC128 mice (n = 6–8). (C) Pan-histone lactylation in SHMT2-knockdown HdhQ7 cells compared with control (n = 3). (D) Analysis of pan-histone lactylation and H3K18la in control and SHMT2-knockdown mouse striatum (n = 3). (E) Pan-histone lactylation in HdhQ7 cells treated with vehicle or SHIN1 (10 μM) for 48 hours (n = 3). (F) Pan-histone lactylation levels in HdhQ7 cells treated with or without HCY (500 μM) for 48 hours (n = 3). (G) Pan-histone lactylation in striatal tissues from 6-month-old WT and YAC128 mice injected with AAV-Con or AAV-SHMT2 (n = 3). (H) Folate supplementation (100 μM, 48 hours) partially restores pan-histone lactylation in HdhQ111 cells (n = 3). (I) Scatter plot of candidate HCY-binding proteins identified by LiP-MS analysis. (J) Histone lactylation in AARS1-knockdown or control HdhQ7 cells treated with or without HCY (500 μM, 48 hours) (n = 3). (K) Pan-histone lactylation in control and AARS1-knockdown HdhQ7 cells treated with or without SHIN1 (10 μM, 48 hours) (n = 3). (L) Histone lactylation in HdhQ7 and HdhQ111 cells transfected with Flag-AARS1 or empty vector (n = 3). (M) Molecular docking showing HCY binding to human AARS1 (PDB: 4XEM) at the predicted lactate binding site. (N) Microscale thermophoresis (MST) analysis of AARS1-HCY interaction using gradient HCY; representative MST curves are shown. (O) MST analysis of AARS1 with or without HCY in the presence of gradient sodium lactate; representative MST curves shown. Data are shown as the mean ± SEM. Unpaired t test was used for A, B, and D–F; 1-way ANOVA with Tukey’s test was used for C, G, H, and J–L. *P < 0.05, **P < 0.01, ***P < 0.001, ****P < 0.0001.
Haloperidol alleviates metabolic-epigenetic dysregulation via SHMT2-dependent mechanisms. To determine whether symptomatic medications relevant to HD modulate SHMT2-regulated histone lactylation in vitro, we screened a panel of pharmacological agents, including haloperidol, risperidone, amantadine, paroxetine, and donepezil, which are commonly used for symptomatic management in HD. Among these agents, only haloperidol markedly upregulated SHMT2 expression in HdhQ111 cells, whereas the other drugs exhibited no notable effects (Figure 7A). However, haloperidol treatment did not substantially alter Shmt2 mRNA levels in HdhQ7 and HdhQ111 cells, indicating that haloperidol may regulate SHMT2 at the protein level (Supplemental Figure 6A). Furthermore, haloperidol treatment reduced intracellular HCY levels in HdhQ111 cells compared with untreated controls and restored histone lactylation levels that were decreased in HdhQ111 cells (Figure 7, B and C). Importantly, inhibition of SHMT2 by genetic knockdown abolished the haloperidol-induced increase in histone lactylation (Figure 7D), suggesting that haloperidol alleviates metabolic-epigenetic dysregulation in HD models by modulating the SHMT2-HCY axis. Immunofluorescence staining revealed that haloperidol treatment clearly reduced the number of cells harboring polyQ aggregates, and this effect was abolished by SHMT2 knockdown (Figure 7E and Supplemental Figure 6B). Consistently, pharmacological inhibition of SHMT2 with SHIN1 also blocked the haloperidol-mediated restoration of neuronal morphology (Figure 7F and Supplemental Figure 6, C–E), indicating that these effects require SHMT2 activity. Given that haloperidol restores histone lactylation, which is closely linked to transcriptional regulation, we next examined whether its effects are mediated through histone-lactylation–dependent changes in gene transcription. To address this, we treated HdhQ111 cells with haloperidol and performed RNA-seq on Q7, Q111, and Q111 plus haloperidol groups (Supplemental Figure 6F and Supplemental Table 7). A dual volcano plot comparing Q111 versus Q7 and Q111+HAL versus Q111 revealed a set of genes showing reversed expression patterns in response to haloperidol, with a negative correlation (r = –0.21) between the 2 comparisons, supporting its partial restoration of transcriptional homeostasis (Figure 7G). Heatmap visualization of the overlapping genes further supported this observation, showing that many of the affected genes were downregulated in Q111 relative to Q7 and subsequently upregulated upon haloperidol treatment, or vice versa—indicative of gene-level rescue effects (Supplemental Figure 6G). Of the 4,012 differentially expressed genes (DEGs) identified in the Q111+HAL versus Q111 comparison, 1,312 overlapped with DEGs from the Q111 versus Q7 group and exhibited inverse expression trends. These genes were defined as haloperidol-rescued targets and accounted for approximately 33% of the HAL-regulated transcriptome (Supplemental Figure 6H). Gene ontology analysis of the up- and downregulated gene sets identified pathways related to synaptic organization, metabolic processes, calcium ion homeostasis, inflammatory and stress responses, and neuronal apoptosis (Figure 7H). Combined cleavage under targets and tagmentation assay–RNA-seq (CUT&Tag–RNA-seq) analysis showed that a substantial proportion of genes marked by H3K9la or H4K16la exhibited concordant expression changes upon haloperidol treatment, indicating that haloperidol-induced transcriptional responses partially align with its effects on histone lactylation (Figure 7, I and J, and Supplemental Table 8). Gene Ontology and pathway enrichment analyses of these concordant genes further revealed enrichment in functional categories related to neuronal organization, synaptic and vesicle-associated processes, and cellular metabolic regulation (Supplemental Figure 6, I and J). Together, these findings suggest that haloperidol partially restores SHMT2-dependent metabolic and epigenetic homeostasis in HD models.
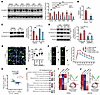 Figure 7
Haloperidol alleviates metabolic-epigenetic dysregulation via SHMT2-dependent mechanisms. (A) SHMT2 expression in HdhQ7 and HdhQ111 cells after 48-hour treatment with commonly used HD medications (n = 3). HAL, haloperidol; RISP, risperidone; PARO, paroxetine; DZP, donepezil; AMT, amantadine. (B) HCY levels in vehicle- and haloperidol-treated (20 μM, 48 h) HdhQ111 cells (n = 4). (C) Pan-histone lactylation levels in HdhQ7 and HdhQ111 cells treated with haloperidol (20 μM) for 48 hours (n = 3). (D) Pan-histone lactylation in HdhQ111 cells with or without SHMT2 knockdown following haloperidol treatment (20 μM, 48 hours) (n = 3). (E) Images of GFP-HTTEx1-Q73–expressing HdhQ111 cells with SHMT2 knockdown followed by haloperidol treatment; polyQ aggregates were quantified (scale bar: 20 μm; n = 3). (F) Sholl analysis of neurons derived from HD-hSOs treated with or without SHIN1, followed by haloperidol treatment (scale bar: 20 μm; n = 60). (G) Dual volcano plot comparing gene expression between Q111 + vehicle and Q7 + vehicle as well as Q111 + HAL and Q111 + vehicle. Blue line indicates regression curve with negative correlation (r = –0.21). DEG cutoff: |log2FC| ≥ 0.25, Padj ≤ 0.05. (H) GO Biological Process enrichment of negatively correlated genes identified in Supplemental Figure 6H. (I and J) Integration of CUT&Tag and RNA-seq for H3K9la- and H4K16la-marked genes. Concordant genes were defined as genes identified by RNA-seq as downregulated in Q111 versus Q7 and restored by HAL treatment, with transcriptional changes consistent with histone lactylation–associated chromatin occupancy. Heatmaps and line plots (centroid in blue) depict concordant CUT&Tag and RNA-seq expression changes. Donut plots summarize the proportion of concordant versus discordant genes. Data are shown as the mean ± SEM. One-way ANOVA with Tukey’s test was used for A, and C–E; unpaired t test was used for B; 2-way ANOVA with Šídák’s test was used for F. *P < 0.05, **P < 0.01, ****P < 0.0001.


Copyright © 2026 American Society for Clinical Investigation
ISSN: 0021-9738 (print), 1558-8238 (online)