
Advertisement
Research ArticleCell biologyGeneticsOncology
Open Access |  10.1172/JCI200260
Targeting Wnt/β-catenin and circadian regulator restores PRC2/EZH2-controlled chromatin bivalency and suppresses cell state diversity
Yatian Yang,1 Xiong Zhang,1 Varadha Balaji Venkadakrishnan,2,3 Hongye Zou,1 Xingling Zheng,1 Shiyao Guo,1 Christopher Z. Chen,4 Alexander D. Borowsky,5 Eva Corey,6 Ronald M. Evans,7 Allen C. Gao,8 Marc A. Dall’Era,8 Amina Zoubeidi,9,10 Primo N. Lara,11,12 Hsing-Jien Kung,1 Xinbin Chen,13 Himisha Beltran,2,3 and Hong-Wu Chen1,12,14
1Department of Biochemistry and Molecular Medicine, School of Medicine, UCD, Sacramento, California, USA.
2Department of Medical Oncology, Dana-Farber Cancer Institute, Boston, Massachusetts, USA.
3Harvard Medical School, Boston, Massachusetts, USA.
4Pharmaceutical Sciences and Pharmacogenomics (PSPG) Graduate Program, UCSF, San Francisco, California, USA.
5Department of Pathology and Laboratory Medicine, School of Medicine, UCD, Sacramento, California, USA.
6Department of Urology, University of Washington, Seattle, Washington, USA.
7Gene Expression Laboratory, Salk Institute for Biological Studies, La Jolla, California, USA.
8Department of Urologic Surgery, School of Medicine, UCD, Sacramento, California, USA.
9Department of Urologic Sciences, University of British Columbia, Vancouver, British Columbia, Canada.
10Vancouver Prostate Centre, Vancouver, British Columbia, Canada.
11Division of Hematology Oncology, Department of internal medicine, and
12Comprehensive Cancer Center, UCD, Sacramento, California, USA.
13Department of Surgical and Radiological Sciences, UCD, Davis, California, USA.
14US Veterans Affairs Northern California Health Care System-Mather, Mather, California, USA.
Address correspondence to: Hongwu Chen, Department of Biochemistry and Molecular Medicine, School of Medicine, UCD, UCDMC, Research III building, Rm 1400B, 4645 2nd Avenue, Sacramento, California 95817, USA. Phone: 916.734.7743; Email: hwzchen@health.ucdavis.edu.
Authorship note: YY and X Zhang contributed equally to this work.
Find articles by Yang, Y. in: PubMed | Google Scholar
1Department of Biochemistry and Molecular Medicine, School of Medicine, UCD, Sacramento, California, USA.
2Department of Medical Oncology, Dana-Farber Cancer Institute, Boston, Massachusetts, USA.
3Harvard Medical School, Boston, Massachusetts, USA.
4Pharmaceutical Sciences and Pharmacogenomics (PSPG) Graduate Program, UCSF, San Francisco, California, USA.
5Department of Pathology and Laboratory Medicine, School of Medicine, UCD, Sacramento, California, USA.
6Department of Urology, University of Washington, Seattle, Washington, USA.
7Gene Expression Laboratory, Salk Institute for Biological Studies, La Jolla, California, USA.
8Department of Urologic Surgery, School of Medicine, UCD, Sacramento, California, USA.
9Department of Urologic Sciences, University of British Columbia, Vancouver, British Columbia, Canada.
10Vancouver Prostate Centre, Vancouver, British Columbia, Canada.
11Division of Hematology Oncology, Department of internal medicine, and
12Comprehensive Cancer Center, UCD, Sacramento, California, USA.
13Department of Surgical and Radiological Sciences, UCD, Davis, California, USA.
14US Veterans Affairs Northern California Health Care System-Mather, Mather, California, USA.
Address correspondence to: Hongwu Chen, Department of Biochemistry and Molecular Medicine, School of Medicine, UCD, UCDMC, Research III building, Rm 1400B, 4645 2nd Avenue, Sacramento, California 95817, USA. Phone: 916.734.7743; Email: hwzchen@health.ucdavis.edu.
Authorship note: YY and X Zhang contributed equally to this work.
Find articles by Zhang, X. in: PubMed | Google Scholar
1Department of Biochemistry and Molecular Medicine, School of Medicine, UCD, Sacramento, California, USA.
2Department of Medical Oncology, Dana-Farber Cancer Institute, Boston, Massachusetts, USA.
3Harvard Medical School, Boston, Massachusetts, USA.
4Pharmaceutical Sciences and Pharmacogenomics (PSPG) Graduate Program, UCSF, San Francisco, California, USA.
5Department of Pathology and Laboratory Medicine, School of Medicine, UCD, Sacramento, California, USA.
6Department of Urology, University of Washington, Seattle, Washington, USA.
7Gene Expression Laboratory, Salk Institute for Biological Studies, La Jolla, California, USA.
8Department of Urologic Surgery, School of Medicine, UCD, Sacramento, California, USA.
9Department of Urologic Sciences, University of British Columbia, Vancouver, British Columbia, Canada.
10Vancouver Prostate Centre, Vancouver, British Columbia, Canada.
11Division of Hematology Oncology, Department of internal medicine, and
12Comprehensive Cancer Center, UCD, Sacramento, California, USA.
13Department of Surgical and Radiological Sciences, UCD, Davis, California, USA.
14US Veterans Affairs Northern California Health Care System-Mather, Mather, California, USA.
Address correspondence to: Hongwu Chen, Department of Biochemistry and Molecular Medicine, School of Medicine, UCD, UCDMC, Research III building, Rm 1400B, 4645 2nd Avenue, Sacramento, California 95817, USA. Phone: 916.734.7743; Email: hwzchen@health.ucdavis.edu.
Authorship note: YY and X Zhang contributed equally to this work.
Find articles by
Venkadakrishnan, V.
in:
PubMed
|
Google Scholar
|

1Department of Biochemistry and Molecular Medicine, School of Medicine, UCD, Sacramento, California, USA.
2Department of Medical Oncology, Dana-Farber Cancer Institute, Boston, Massachusetts, USA.
3Harvard Medical School, Boston, Massachusetts, USA.
4Pharmaceutical Sciences and Pharmacogenomics (PSPG) Graduate Program, UCSF, San Francisco, California, USA.
5Department of Pathology and Laboratory Medicine, School of Medicine, UCD, Sacramento, California, USA.
6Department of Urology, University of Washington, Seattle, Washington, USA.
7Gene Expression Laboratory, Salk Institute for Biological Studies, La Jolla, California, USA.
8Department of Urologic Surgery, School of Medicine, UCD, Sacramento, California, USA.
9Department of Urologic Sciences, University of British Columbia, Vancouver, British Columbia, Canada.
10Vancouver Prostate Centre, Vancouver, British Columbia, Canada.
11Division of Hematology Oncology, Department of internal medicine, and
12Comprehensive Cancer Center, UCD, Sacramento, California, USA.
13Department of Surgical and Radiological Sciences, UCD, Davis, California, USA.
14US Veterans Affairs Northern California Health Care System-Mather, Mather, California, USA.
Address correspondence to: Hongwu Chen, Department of Biochemistry and Molecular Medicine, School of Medicine, UCD, UCDMC, Research III building, Rm 1400B, 4645 2nd Avenue, Sacramento, California 95817, USA. Phone: 916.734.7743; Email: hwzchen@health.ucdavis.edu.
Authorship note: YY and X Zhang contributed equally to this work.
Find articles by Zou, H. in: PubMed | Google Scholar
1Department of Biochemistry and Molecular Medicine, School of Medicine, UCD, Sacramento, California, USA.
2Department of Medical Oncology, Dana-Farber Cancer Institute, Boston, Massachusetts, USA.
3Harvard Medical School, Boston, Massachusetts, USA.
4Pharmaceutical Sciences and Pharmacogenomics (PSPG) Graduate Program, UCSF, San Francisco, California, USA.
5Department of Pathology and Laboratory Medicine, School of Medicine, UCD, Sacramento, California, USA.
6Department of Urology, University of Washington, Seattle, Washington, USA.
7Gene Expression Laboratory, Salk Institute for Biological Studies, La Jolla, California, USA.
8Department of Urologic Surgery, School of Medicine, UCD, Sacramento, California, USA.
9Department of Urologic Sciences, University of British Columbia, Vancouver, British Columbia, Canada.
10Vancouver Prostate Centre, Vancouver, British Columbia, Canada.
11Division of Hematology Oncology, Department of internal medicine, and
12Comprehensive Cancer Center, UCD, Sacramento, California, USA.
13Department of Surgical and Radiological Sciences, UCD, Davis, California, USA.
14US Veterans Affairs Northern California Health Care System-Mather, Mather, California, USA.
Address correspondence to: Hongwu Chen, Department of Biochemistry and Molecular Medicine, School of Medicine, UCD, UCDMC, Research III building, Rm 1400B, 4645 2nd Avenue, Sacramento, California 95817, USA. Phone: 916.734.7743; Email: hwzchen@health.ucdavis.edu.
Authorship note: YY and X Zhang contributed equally to this work.
Find articles by Zheng, X. in: PubMed | Google Scholar
1Department of Biochemistry and Molecular Medicine, School of Medicine, UCD, Sacramento, California, USA.
2Department of Medical Oncology, Dana-Farber Cancer Institute, Boston, Massachusetts, USA.
3Harvard Medical School, Boston, Massachusetts, USA.
4Pharmaceutical Sciences and Pharmacogenomics (PSPG) Graduate Program, UCSF, San Francisco, California, USA.
5Department of Pathology and Laboratory Medicine, School of Medicine, UCD, Sacramento, California, USA.
6Department of Urology, University of Washington, Seattle, Washington, USA.
7Gene Expression Laboratory, Salk Institute for Biological Studies, La Jolla, California, USA.
8Department of Urologic Surgery, School of Medicine, UCD, Sacramento, California, USA.
9Department of Urologic Sciences, University of British Columbia, Vancouver, British Columbia, Canada.
10Vancouver Prostate Centre, Vancouver, British Columbia, Canada.
11Division of Hematology Oncology, Department of internal medicine, and
12Comprehensive Cancer Center, UCD, Sacramento, California, USA.
13Department of Surgical and Radiological Sciences, UCD, Davis, California, USA.
14US Veterans Affairs Northern California Health Care System-Mather, Mather, California, USA.
Address correspondence to: Hongwu Chen, Department of Biochemistry and Molecular Medicine, School of Medicine, UCD, UCDMC, Research III building, Rm 1400B, 4645 2nd Avenue, Sacramento, California 95817, USA. Phone: 916.734.7743; Email: hwzchen@health.ucdavis.edu.
Authorship note: YY and X Zhang contributed equally to this work.
Find articles by Guo, S. in: PubMed | Google Scholar
1Department of Biochemistry and Molecular Medicine, School of Medicine, UCD, Sacramento, California, USA.
2Department of Medical Oncology, Dana-Farber Cancer Institute, Boston, Massachusetts, USA.
3Harvard Medical School, Boston, Massachusetts, USA.
4Pharmaceutical Sciences and Pharmacogenomics (PSPG) Graduate Program, UCSF, San Francisco, California, USA.
5Department of Pathology and Laboratory Medicine, School of Medicine, UCD, Sacramento, California, USA.
6Department of Urology, University of Washington, Seattle, Washington, USA.
7Gene Expression Laboratory, Salk Institute for Biological Studies, La Jolla, California, USA.
8Department of Urologic Surgery, School of Medicine, UCD, Sacramento, California, USA.
9Department of Urologic Sciences, University of British Columbia, Vancouver, British Columbia, Canada.
10Vancouver Prostate Centre, Vancouver, British Columbia, Canada.
11Division of Hematology Oncology, Department of internal medicine, and
12Comprehensive Cancer Center, UCD, Sacramento, California, USA.
13Department of Surgical and Radiological Sciences, UCD, Davis, California, USA.
14US Veterans Affairs Northern California Health Care System-Mather, Mather, California, USA.
Address correspondence to: Hongwu Chen, Department of Biochemistry and Molecular Medicine, School of Medicine, UCD, UCDMC, Research III building, Rm 1400B, 4645 2nd Avenue, Sacramento, California 95817, USA. Phone: 916.734.7743; Email: hwzchen@health.ucdavis.edu.
Authorship note: YY and X Zhang contributed equally to this work.
Find articles by Chen, C. in: PubMed | Google Scholar
1Department of Biochemistry and Molecular Medicine, School of Medicine, UCD, Sacramento, California, USA.
2Department of Medical Oncology, Dana-Farber Cancer Institute, Boston, Massachusetts, USA.
3Harvard Medical School, Boston, Massachusetts, USA.
4Pharmaceutical Sciences and Pharmacogenomics (PSPG) Graduate Program, UCSF, San Francisco, California, USA.
5Department of Pathology and Laboratory Medicine, School of Medicine, UCD, Sacramento, California, USA.
6Department of Urology, University of Washington, Seattle, Washington, USA.
7Gene Expression Laboratory, Salk Institute for Biological Studies, La Jolla, California, USA.
8Department of Urologic Surgery, School of Medicine, UCD, Sacramento, California, USA.
9Department of Urologic Sciences, University of British Columbia, Vancouver, British Columbia, Canada.
10Vancouver Prostate Centre, Vancouver, British Columbia, Canada.
11Division of Hematology Oncology, Department of internal medicine, and
12Comprehensive Cancer Center, UCD, Sacramento, California, USA.
13Department of Surgical and Radiological Sciences, UCD, Davis, California, USA.
14US Veterans Affairs Northern California Health Care System-Mather, Mather, California, USA.
Address correspondence to: Hongwu Chen, Department of Biochemistry and Molecular Medicine, School of Medicine, UCD, UCDMC, Research III building, Rm 1400B, 4645 2nd Avenue, Sacramento, California 95817, USA. Phone: 916.734.7743; Email: hwzchen@health.ucdavis.edu.
Authorship note: YY and X Zhang contributed equally to this work.
Find articles by Borowsky, A. in: PubMed | Google Scholar
1Department of Biochemistry and Molecular Medicine, School of Medicine, UCD, Sacramento, California, USA.
2Department of Medical Oncology, Dana-Farber Cancer Institute, Boston, Massachusetts, USA.
3Harvard Medical School, Boston, Massachusetts, USA.
4Pharmaceutical Sciences and Pharmacogenomics (PSPG) Graduate Program, UCSF, San Francisco, California, USA.
5Department of Pathology and Laboratory Medicine, School of Medicine, UCD, Sacramento, California, USA.
6Department of Urology, University of Washington, Seattle, Washington, USA.
7Gene Expression Laboratory, Salk Institute for Biological Studies, La Jolla, California, USA.
8Department of Urologic Surgery, School of Medicine, UCD, Sacramento, California, USA.
9Department of Urologic Sciences, University of British Columbia, Vancouver, British Columbia, Canada.
10Vancouver Prostate Centre, Vancouver, British Columbia, Canada.
11Division of Hematology Oncology, Department of internal medicine, and
12Comprehensive Cancer Center, UCD, Sacramento, California, USA.
13Department of Surgical and Radiological Sciences, UCD, Davis, California, USA.
14US Veterans Affairs Northern California Health Care System-Mather, Mather, California, USA.
Address correspondence to: Hongwu Chen, Department of Biochemistry and Molecular Medicine, School of Medicine, UCD, UCDMC, Research III building, Rm 1400B, 4645 2nd Avenue, Sacramento, California 95817, USA. Phone: 916.734.7743; Email: hwzchen@health.ucdavis.edu.
Authorship note: YY and X Zhang contributed equally to this work.
Find articles by
Corey, E.
in:
PubMed
|
Google Scholar
|
1Department of Biochemistry and Molecular Medicine, School of Medicine, UCD, Sacramento, California, USA.
2Department of Medical Oncology, Dana-Farber Cancer Institute, Boston, Massachusetts, USA.
3Harvard Medical School, Boston, Massachusetts, USA.
4Pharmaceutical Sciences and Pharmacogenomics (PSPG) Graduate Program, UCSF, San Francisco, California, USA.
5Department of Pathology and Laboratory Medicine, School of Medicine, UCD, Sacramento, California, USA.
6Department of Urology, University of Washington, Seattle, Washington, USA.
7Gene Expression Laboratory, Salk Institute for Biological Studies, La Jolla, California, USA.
8Department of Urologic Surgery, School of Medicine, UCD, Sacramento, California, USA.
9Department of Urologic Sciences, University of British Columbia, Vancouver, British Columbia, Canada.
10Vancouver Prostate Centre, Vancouver, British Columbia, Canada.
11Division of Hematology Oncology, Department of internal medicine, and
12Comprehensive Cancer Center, UCD, Sacramento, California, USA.
13Department of Surgical and Radiological Sciences, UCD, Davis, California, USA.
14US Veterans Affairs Northern California Health Care System-Mather, Mather, California, USA.
Address correspondence to: Hongwu Chen, Department of Biochemistry and Molecular Medicine, School of Medicine, UCD, UCDMC, Research III building, Rm 1400B, 4645 2nd Avenue, Sacramento, California 95817, USA. Phone: 916.734.7743; Email: hwzchen@health.ucdavis.edu.
Authorship note: YY and X Zhang contributed equally to this work.
Find articles by
Evans, R.
in:
PubMed
|
Google Scholar
|
1Department of Biochemistry and Molecular Medicine, School of Medicine, UCD, Sacramento, California, USA.
2Department of Medical Oncology, Dana-Farber Cancer Institute, Boston, Massachusetts, USA.
3Harvard Medical School, Boston, Massachusetts, USA.
4Pharmaceutical Sciences and Pharmacogenomics (PSPG) Graduate Program, UCSF, San Francisco, California, USA.
5Department of Pathology and Laboratory Medicine, School of Medicine, UCD, Sacramento, California, USA.
6Department of Urology, University of Washington, Seattle, Washington, USA.
7Gene Expression Laboratory, Salk Institute for Biological Studies, La Jolla, California, USA.
8Department of Urologic Surgery, School of Medicine, UCD, Sacramento, California, USA.
9Department of Urologic Sciences, University of British Columbia, Vancouver, British Columbia, Canada.
10Vancouver Prostate Centre, Vancouver, British Columbia, Canada.
11Division of Hematology Oncology, Department of internal medicine, and
12Comprehensive Cancer Center, UCD, Sacramento, California, USA.
13Department of Surgical and Radiological Sciences, UCD, Davis, California, USA.
14US Veterans Affairs Northern California Health Care System-Mather, Mather, California, USA.
Address correspondence to: Hongwu Chen, Department of Biochemistry and Molecular Medicine, School of Medicine, UCD, UCDMC, Research III building, Rm 1400B, 4645 2nd Avenue, Sacramento, California 95817, USA. Phone: 916.734.7743; Email: hwzchen@health.ucdavis.edu.
Authorship note: YY and X Zhang contributed equally to this work.
Find articles by Gao, A. in: PubMed | Google Scholar
1Department of Biochemistry and Molecular Medicine, School of Medicine, UCD, Sacramento, California, USA.
2Department of Medical Oncology, Dana-Farber Cancer Institute, Boston, Massachusetts, USA.
3Harvard Medical School, Boston, Massachusetts, USA.
4Pharmaceutical Sciences and Pharmacogenomics (PSPG) Graduate Program, UCSF, San Francisco, California, USA.
5Department of Pathology and Laboratory Medicine, School of Medicine, UCD, Sacramento, California, USA.
6Department of Urology, University of Washington, Seattle, Washington, USA.
7Gene Expression Laboratory, Salk Institute for Biological Studies, La Jolla, California, USA.
8Department of Urologic Surgery, School of Medicine, UCD, Sacramento, California, USA.
9Department of Urologic Sciences, University of British Columbia, Vancouver, British Columbia, Canada.
10Vancouver Prostate Centre, Vancouver, British Columbia, Canada.
11Division of Hematology Oncology, Department of internal medicine, and
12Comprehensive Cancer Center, UCD, Sacramento, California, USA.
13Department of Surgical and Radiological Sciences, UCD, Davis, California, USA.
14US Veterans Affairs Northern California Health Care System-Mather, Mather, California, USA.
Address correspondence to: Hongwu Chen, Department of Biochemistry and Molecular Medicine, School of Medicine, UCD, UCDMC, Research III building, Rm 1400B, 4645 2nd Avenue, Sacramento, California 95817, USA. Phone: 916.734.7743; Email: hwzchen@health.ucdavis.edu.
Authorship note: YY and X Zhang contributed equally to this work.
Find articles by Dall’Era, M. in: PubMed | Google Scholar
1Department of Biochemistry and Molecular Medicine, School of Medicine, UCD, Sacramento, California, USA.
2Department of Medical Oncology, Dana-Farber Cancer Institute, Boston, Massachusetts, USA.
3Harvard Medical School, Boston, Massachusetts, USA.
4Pharmaceutical Sciences and Pharmacogenomics (PSPG) Graduate Program, UCSF, San Francisco, California, USA.
5Department of Pathology and Laboratory Medicine, School of Medicine, UCD, Sacramento, California, USA.
6Department of Urology, University of Washington, Seattle, Washington, USA.
7Gene Expression Laboratory, Salk Institute for Biological Studies, La Jolla, California, USA.
8Department of Urologic Surgery, School of Medicine, UCD, Sacramento, California, USA.
9Department of Urologic Sciences, University of British Columbia, Vancouver, British Columbia, Canada.
10Vancouver Prostate Centre, Vancouver, British Columbia, Canada.
11Division of Hematology Oncology, Department of internal medicine, and
12Comprehensive Cancer Center, UCD, Sacramento, California, USA.
13Department of Surgical and Radiological Sciences, UCD, Davis, California, USA.
14US Veterans Affairs Northern California Health Care System-Mather, Mather, California, USA.
Address correspondence to: Hongwu Chen, Department of Biochemistry and Molecular Medicine, School of Medicine, UCD, UCDMC, Research III building, Rm 1400B, 4645 2nd Avenue, Sacramento, California 95817, USA. Phone: 916.734.7743; Email: hwzchen@health.ucdavis.edu.
Authorship note: YY and X Zhang contributed equally to this work.
Find articles by Zoubeidi, A. in: PubMed | Google Scholar
1Department of Biochemistry and Molecular Medicine, School of Medicine, UCD, Sacramento, California, USA.
2Department of Medical Oncology, Dana-Farber Cancer Institute, Boston, Massachusetts, USA.
3Harvard Medical School, Boston, Massachusetts, USA.
4Pharmaceutical Sciences and Pharmacogenomics (PSPG) Graduate Program, UCSF, San Francisco, California, USA.
5Department of Pathology and Laboratory Medicine, School of Medicine, UCD, Sacramento, California, USA.
6Department of Urology, University of Washington, Seattle, Washington, USA.
7Gene Expression Laboratory, Salk Institute for Biological Studies, La Jolla, California, USA.
8Department of Urologic Surgery, School of Medicine, UCD, Sacramento, California, USA.
9Department of Urologic Sciences, University of British Columbia, Vancouver, British Columbia, Canada.
10Vancouver Prostate Centre, Vancouver, British Columbia, Canada.
11Division of Hematology Oncology, Department of internal medicine, and
12Comprehensive Cancer Center, UCD, Sacramento, California, USA.
13Department of Surgical and Radiological Sciences, UCD, Davis, California, USA.
14US Veterans Affairs Northern California Health Care System-Mather, Mather, California, USA.
Address correspondence to: Hongwu Chen, Department of Biochemistry and Molecular Medicine, School of Medicine, UCD, UCDMC, Research III building, Rm 1400B, 4645 2nd Avenue, Sacramento, California 95817, USA. Phone: 916.734.7743; Email: hwzchen@health.ucdavis.edu.
Authorship note: YY and X Zhang contributed equally to this work.
Find articles by Lara, P. in: PubMed | Google Scholar
1Department of Biochemistry and Molecular Medicine, School of Medicine, UCD, Sacramento, California, USA.
2Department of Medical Oncology, Dana-Farber Cancer Institute, Boston, Massachusetts, USA.
3Harvard Medical School, Boston, Massachusetts, USA.
4Pharmaceutical Sciences and Pharmacogenomics (PSPG) Graduate Program, UCSF, San Francisco, California, USA.
5Department of Pathology and Laboratory Medicine, School of Medicine, UCD, Sacramento, California, USA.
6Department of Urology, University of Washington, Seattle, Washington, USA.
7Gene Expression Laboratory, Salk Institute for Biological Studies, La Jolla, California, USA.
8Department of Urologic Surgery, School of Medicine, UCD, Sacramento, California, USA.
9Department of Urologic Sciences, University of British Columbia, Vancouver, British Columbia, Canada.
10Vancouver Prostate Centre, Vancouver, British Columbia, Canada.
11Division of Hematology Oncology, Department of internal medicine, and
12Comprehensive Cancer Center, UCD, Sacramento, California, USA.
13Department of Surgical and Radiological Sciences, UCD, Davis, California, USA.
14US Veterans Affairs Northern California Health Care System-Mather, Mather, California, USA.
Address correspondence to: Hongwu Chen, Department of Biochemistry and Molecular Medicine, School of Medicine, UCD, UCDMC, Research III building, Rm 1400B, 4645 2nd Avenue, Sacramento, California 95817, USA. Phone: 916.734.7743; Email: hwzchen@health.ucdavis.edu.
Authorship note: YY and X Zhang contributed equally to this work.
Find articles by Kung, H. in: PubMed | Google Scholar
1Department of Biochemistry and Molecular Medicine, School of Medicine, UCD, Sacramento, California, USA.
2Department of Medical Oncology, Dana-Farber Cancer Institute, Boston, Massachusetts, USA.
3Harvard Medical School, Boston, Massachusetts, USA.
4Pharmaceutical Sciences and Pharmacogenomics (PSPG) Graduate Program, UCSF, San Francisco, California, USA.
5Department of Pathology and Laboratory Medicine, School of Medicine, UCD, Sacramento, California, USA.
6Department of Urology, University of Washington, Seattle, Washington, USA.
7Gene Expression Laboratory, Salk Institute for Biological Studies, La Jolla, California, USA.
8Department of Urologic Surgery, School of Medicine, UCD, Sacramento, California, USA.
9Department of Urologic Sciences, University of British Columbia, Vancouver, British Columbia, Canada.
10Vancouver Prostate Centre, Vancouver, British Columbia, Canada.
11Division of Hematology Oncology, Department of internal medicine, and
12Comprehensive Cancer Center, UCD, Sacramento, California, USA.
13Department of Surgical and Radiological Sciences, UCD, Davis, California, USA.
14US Veterans Affairs Northern California Health Care System-Mather, Mather, California, USA.
Address correspondence to: Hongwu Chen, Department of Biochemistry and Molecular Medicine, School of Medicine, UCD, UCDMC, Research III building, Rm 1400B, 4645 2nd Avenue, Sacramento, California 95817, USA. Phone: 916.734.7743; Email: hwzchen@health.ucdavis.edu.
Authorship note: YY and X Zhang contributed equally to this work.
Find articles by Chen, X. in: PubMed | Google Scholar
1Department of Biochemistry and Molecular Medicine, School of Medicine, UCD, Sacramento, California, USA.
2Department of Medical Oncology, Dana-Farber Cancer Institute, Boston, Massachusetts, USA.
3Harvard Medical School, Boston, Massachusetts, USA.
4Pharmaceutical Sciences and Pharmacogenomics (PSPG) Graduate Program, UCSF, San Francisco, California, USA.
5Department of Pathology and Laboratory Medicine, School of Medicine, UCD, Sacramento, California, USA.
6Department of Urology, University of Washington, Seattle, Washington, USA.
7Gene Expression Laboratory, Salk Institute for Biological Studies, La Jolla, California, USA.
8Department of Urologic Surgery, School of Medicine, UCD, Sacramento, California, USA.
9Department of Urologic Sciences, University of British Columbia, Vancouver, British Columbia, Canada.
10Vancouver Prostate Centre, Vancouver, British Columbia, Canada.
11Division of Hematology Oncology, Department of internal medicine, and
12Comprehensive Cancer Center, UCD, Sacramento, California, USA.
13Department of Surgical and Radiological Sciences, UCD, Davis, California, USA.
14US Veterans Affairs Northern California Health Care System-Mather, Mather, California, USA.
Address correspondence to: Hongwu Chen, Department of Biochemistry and Molecular Medicine, School of Medicine, UCD, UCDMC, Research III building, Rm 1400B, 4645 2nd Avenue, Sacramento, California 95817, USA. Phone: 916.734.7743; Email: hwzchen@health.ucdavis.edu.
Authorship note: YY and X Zhang contributed equally to this work.
Find articles by
Beltran, H.
in:
PubMed
|
Google Scholar
|
1Department of Biochemistry and Molecular Medicine, School of Medicine, UCD, Sacramento, California, USA.
2Department of Medical Oncology, Dana-Farber Cancer Institute, Boston, Massachusetts, USA.
3Harvard Medical School, Boston, Massachusetts, USA.
4Pharmaceutical Sciences and Pharmacogenomics (PSPG) Graduate Program, UCSF, San Francisco, California, USA.
5Department of Pathology and Laboratory Medicine, School of Medicine, UCD, Sacramento, California, USA.
6Department of Urology, University of Washington, Seattle, Washington, USA.
7Gene Expression Laboratory, Salk Institute for Biological Studies, La Jolla, California, USA.
8Department of Urologic Surgery, School of Medicine, UCD, Sacramento, California, USA.
9Department of Urologic Sciences, University of British Columbia, Vancouver, British Columbia, Canada.
10Vancouver Prostate Centre, Vancouver, British Columbia, Canada.
11Division of Hematology Oncology, Department of internal medicine, and
12Comprehensive Cancer Center, UCD, Sacramento, California, USA.
13Department of Surgical and Radiological Sciences, UCD, Davis, California, USA.
14US Veterans Affairs Northern California Health Care System-Mather, Mather, California, USA.
Address correspondence to: Hongwu Chen, Department of Biochemistry and Molecular Medicine, School of Medicine, UCD, UCDMC, Research III building, Rm 1400B, 4645 2nd Avenue, Sacramento, California 95817, USA. Phone: 916.734.7743; Email: hwzchen@health.ucdavis.edu.
Authorship note: YY and X Zhang contributed equally to this work.
Find articles by Chen, H. in: PubMed | Google Scholar
Published March 17, 2026 - More info
J Clin Invest. 2026;136(9):e200260. https://doi.org/10.1172/JCI200260.
© 2026 Yang et al. This work is licensed under the Creative Commons Attribution 4.0 International License. To view a copy of this license, visit http://creativecommons.org/licenses/by/4.0/.
Received: September 15, 2025; Accepted: March 5, 2026


-
Results
Therapeutic targeting of PRC2/EZH2 and AR increases drug resistance and promotes tumor metastasis. To better understand the efficacy of combined treatments with PRC2 inhibitors (PRC2i) and ARSIs, we first measured the effects on cell viability and tumor growth by the EZH2 inhibitors tazemetostat/EPZ6438 (Taz) and mevrometostat/PF-06821497 (Mev) (9), the EED inhibitor EED226 (EEDi) and the AR antagonist enzalutamide (Enz) in different PCa models. We chose those agents for their high target selectivity and clinical relevance. With the exception of EED226, Taz and Mev are being used for treating patients with cancer or in clinical trials (9). Consistent with previous findings of the noncanonical role of EZH2 as an AR coactivator (6–8), the PRC2i displayed more pronounced growth inhibition in ARSI-sensitive LNCaP and Myc-CaP cells than the resistant cells (C4-2B and 42DEnzR) (Supplemental Figure 1A; supplemental material available online with this article; https://doi.org/10.1172/JCI200260DS1). Notably, Taz and its combination with Enz did not completely block tumor growth, as significant tumor growth persisted in both the syngeneic and patient-derived xenograft (PDX) models (Figure 1, A–C). Importantly, the combined treatment markedly stimulated tumor metastasis to the liver (Figures 1A and Supplemental Figure 1B).
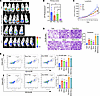 Figure 1
Therapeutic targeting of PRC2/EZH2 and the AR increases drug resistance and promotes tumor metastasis. (A) Bioluminescence imaging of luciferase-expressing Myc-CaP tumors implanted orthotopically into mice treated with the indicated drugs for 14 days. Arrows indicate liver metastasis in mice with the combined treatment. Images shown are representative of 6 mice per group. (B) Bar graphs of bioluminescence quantification of primary tumors. *P < 0.05, **P < 0.01, and *** P < 0.001, by 2-tailed Student’s t test. (C) Growth curves of LuCaP35CR PDX tumors in mice treated with vehicle or the indicated compounds for the indicated durations, 7 times per week (n = 5 mice per group). **P < 0.01 and ***P < 0.001, by 2-tailed Student’s t test. (D) Representative images of C4-2B cells invaded through Matrigel and stained with crystal violet and treated as indicated for 48 hours. Images are representative of 3 independent experiments. Scale bar: 50μM. (E) Flow cytometric analysis of CD44 and CD133 markers in C4-2B and 42DEnzR cells treated with the indicated compounds for 48 hours. **P < 0.01 and ***P < 0.001, by 2-tailed Student’s t test. Veh, vehicle.
The unexpected effects of cotargeting PRC2 and the AR on tumor metastasis prompted us to further examine the consequences on tumor cell aggressiveness. Treatment of cells with inhibitors of EZH2 or EED alone significantly increased cancer stem cell (CSC) populations detected by tumor sphere formation and flow cytometric analysis of CSC markers. The treatment also strongly enhanced cell activities of migration and invasion. The combined treatments with Enz elicited more pronounced effects (Figures 1, D and E, and Supplemental Figure 1, C and D). These results were consistent with the prometastatic effects seen with the combined treatments. Moreover, treatments with the PRC2i alone or in combination with Enz significantly increased cell survival (Supplemental Figure 1E). Strikingly, they also markedly increased the IC50 values of targeted therapy drugs such as poly (ADP-ribose) polymerase inhibitor (PARPi) (niraparib and rucaparib, 50-fold increase from 0.07 for niraparib and 100-fold increase from 0.14 for rucaparib in LNCaP cells), Akt kinase inhibitor (capivasertib, 6-fold increase from 1.6 in LNCaP cells), Aurora kinase A inhibitor (alisertib, 5-fold increase from 6.63 in LNCaP cells), and receptor tyrosine kinase inhibitor (cabozantinib, 7-fold increase from 24.09 in LNCaP cells), as well as chemotherapeutic drugs (cabazitaxel and docetaxel, 2,800-fold increase from 0.0002 for cabazitaxel and 100-fold increase from 0.29 for docetaxel) (Supplemental Figure 1F). Taken together, the above results suggest that inhibition of PRC2, particularly in combination with ARSIs, strongly increased tumor stemness, invasion, drug resistance, and metastasis.
Therapeutic targeting of PRC2/EZH2 and the AR promotes cell state diversity. To understand the mechanism underlying the effects by dual targeting of PRC2/EZH2 and the AR, we first performed bulk RNA-seq analysis of tumors and cells treated with PRC2i alone or in combination with Enz. Consistent with the growth inhibition effects, PRC2i treatments markedly downregulated the expression of cell-proliferation/cell-cycle genes and programs including cyclins and cyclin-dependent kinases (CDKs) (e.g., CCND3, CCNE2, CDK2, and CDK4) (Figure 2A and Supplemental Figure 2, A and B). Known PRC2 target genes such as CDKN1A and CDKN2B were induced. However, other cell-cycle genes (e.g., CDK6, CCND2, CCNA1, CDC2/CDK1) were also upregulated (Supplemental Figure 2C). In line with previous studies (7, 8), the inhibitors also downregulated the expression of a set of genes that were previously reported to be common targets of EZH2 and the AR (Supplemental Figure 2D).
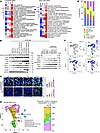 Figure 2
Therapeutic targeting of PRC2/EZH2 and the AR promotes cell state diversity. (A) Heatmaps of the gene set variation analysis (GSVA) score of the indicated programs detected by RNA-seq in LuCaP35CR and MyC-CaP CR tumors in mice treated as indicated for 10 days. (B) Western blots of the indicated proteins in C4-2B cells treated with the indicated compounds or siRNAs for 72 hours. (C) Representative confocal microscopy images of LP protein expression in LuCaP35CR tumors from mice treated as indicated. Images shown are representative of 5 mice per group. Scale bars: 50 μm. Bar graphs display ImageJ-analyzed IF intensity from 7 randomly selected fields per tumor. **P < 0.01, ***P < 0.001, and ****P < 0.0001, by 2-tailed Student’s t test. (D) Uniform manifold approximation and projection (UMAP) visualization of different types of cells from scRNA-seq in LuCaP35CR tumors from mice treated as indicated for 10 days (left). Proportion of cells in individual subpopulations by treatment (right). (E) Bar graphs display the proportion of genes in the 6 different MPs in scRNA-seq data from LuCaP35CR tumors from mice treated as indicated. (F) UMAP visualization of the different types of epithelial cells colored by a gradient of ASCL1 expression. The minimum score is indicated in light gray, and the maximum score is indicated in blue. Com, combination.
Remarkably, the treatments also induced programs of development of diverse tissues or organs (e.g., nervous system, respiratory, mesenchyme/connective), cell-fate commitment, stem cell differentiation, epithelial-mesenchymal transition (EMT), response to stress, hypoxia or IFN, MYC targets, and Wnt signaling. Combination treatment with Enz resulted in further marked stimulation of the expression of those programs (Figure 2A and Supplemental Figure 2E). Notably, gene expression of major LP driver TFs (e.g., ASCL1, POU3F2, SOX2, and ZEB1) and Wnt signaling (e.g., WNT9A/10A, LRP5, DVL1/2) were synergistically induced (Figure 2B and Supplemental Figure 2F). Moreover, knockdown of EZH2 and EED alone or in combination with ARSIs strongly induced protein expression of the CSP drivers and markers (19) (Figure 2B and Supplemental Figure 2G). Immunofluorescence (IF) analysis of tumors also demonstrated that major CSP drivers and markers were synergistically increased (Figure 2C and Supplemental Figure 2H).
Since-cell state diversity is a major mechanism of cancer progression and resistance (13), we wondered whether the treatment-induced gene expression reprogramming was related to changes in cell state diversity or CSP. To examine the potential effects on cell states, we performed scRNA-seq analysis of PDX tumors treated with the inhibitors. Using an unsupervised strategy and cell lineage markers curated previously (20–24), we generated 32 cell clusters and classified them into 6 subpopulations: luminal epithelial cells, mesenchymal cells, mesenchymal or neural stem hybrid cells, which highly expressed both mesenchymal or neural markers and stem markers, myofibroblasts, and endothelial cells (Figure 2D). Significantly, either Taz or Enz alone increased the subpopulations of mesenchymal-stem hybrid cells and mesenchymal cells and decreased luminal cell populations. Remarkably, the Taz and Enz combination strongly increased neural stem hybrid cells (from 25% to 43.1%) and mesenchymal-stem hybrid cells (from 4.8% to 15%) and further decreased luminal cell percentages (from 46.8% to 22.6%) (Figure 2D).
Recent analyses of scRNA-seq data from clinical tumors revealed that cell state diversity is displayed by heterogenous expression of a number of gene programs, in addition to cell lineage–related ones. Thus, using non-negative matrix factorization (NMF) analysis (12) of scRNA-seq data from 50 different clinical PCa tumors (21, 25–28), we identified 1,209 cell state genes in 35 meta-programs (MPs) in the PCa tumors that belong to 6 functional Gene Ontology (GO) annotations (e.g., cell-cycle, mesenchymal, and lineage related) (Supplemental Figure 2I). Moreover, our NMF analysis revealed that Taz and/or Enz increased the number of lineage-related MPs genes and reduced the number of genes in cell-cycle MPs (Figure 2E).
Further analysis revealed that the combination of Taz and Enz induced the expression of diverse lineage-related genes in a subset of the tumor cells. For instance, a subset of neural-stem hybrid cells also expressed drivers or markers of respiratory development (e.g., HOPX and SFTPA2) (29), bone ossification (e.g., BMP3/4 and ALPL), or connective tissue development (e.g., HOXA11, and GREM1) (30, 31), in addition to the known tumor LP genes (e.g., ASCL1, SOX2, CHGA) (32, 33) (Figure 2F and Supplemental Figure 2, J and K). A subset of mesenchymal-stem hybrid cells also expressed genes of ossification or connective tissue development (Supplemental Figure 2K). Strikingly, a subset of luminal cells also expressed genes involved in diverse tissue development (e.g., HOPX, RFLNA, ALPL, BARX2) as well as in stemness and NE features (Supplemental Figure 2K). Together, these results strongly suggest that targeting EZH2 and the AR alone or in combination promoted cell state diversity through induction of a mixed set of CSP genes and by increasing the number of cells with hybrid states.
Induction of cell state diversity is associated with the alteration of chromatin bivalency. We previously demonstrated that targeting EZH2 induced the expression of major LP genes such as ASCL1 and SOX2, which displayed chromatin bivalency in an AR-negative PDX model (18). To determine whether tumor CSPs are controlled by chromatin bivalency, we first defined PCa tumor gene bivalency by performing sequential ChIP-seq, which identifies bivalent genes with high confidence (3, 34). Counting promoters that were positively detected by both sequential and separate ChIP-seq of H3K4me3 and H3K27me3, our analyses identified approximately 3,000–5,000 bona fide bivalent, protein-coding genes in fresh clinical adenocarcinoma tumors, immune-intact mouse tumors, and ARSI-resistant PDX tumors and cell models (Figure 3, A and B, Supplemental Figure 3A, and Supplemental Table 2). Notably, the bivalent genes we identified here encompassed most of the bivalent genes identified in recent studies using separate ChIP-seq or CUT&RUN (18, 35, 36). Further analysis demonstrated that bivalent genes in clinical tumors and preclinical models were highly overlapping. The overlapped genes were strongly enriched in CSPs (Figure 3, C and D, and Supplemental Figure 3, B–D). Moreover, the bivalent genes were also enriched in major regulatory programs, which include Wnt signaling, kinase signaling, response to chemical stress or insulin, and histone modification. Chromatin state analysis revealed that bivalent genes were probably regulated primarily by bivalency at their promoters (Supplemental Figure 3E).
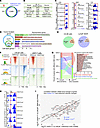 Figure 3
Induction of cell state diversity is associated with alteration of chromatin bivalency. (A) Venn diagram of overlapping genes (n = 2,945) among 3,276 genes, with peaks detected by H3K27me3 to H3K4me3 sequential ChIP-seq (green) and among 3,372 genes, with peaks detected by H3K4me3 and H3K27me3 separate ChIP-seq (blue) in LuCaP77EnzR PDX tumors. (B) Number of bivalent genes identified in the indicated models and in fresh human tumors. (C) Integrative Genomic Viewer (IGV) snapshots of sequential or separate ChIP-seq of H3K27me3 and H3K4me3 at representative CSP genes in C4-2B cells, LuCaP77EnzR PDX tumors, and fresh human tumors. (D) Venn diagram of overlapping genes (n = 856) among bivalent genes in all models and cell state genes and bar plot of major programs from GO analysis. (E) Pie charts of the percentage of bivalent and nonbivalent genes upregulated by Taz and Enz combination treatment in the indicated models. (F) K-means analysis of bivalent promoters and heatmaps of H3K4me3 and H3K27me3 ChIP-seq signal intensity within ±3 kb windows around the TSS at cluster I (H3K4me3-high, with intensity of H3K4me3 higher than H3K27me3 FC ≥1.5), cluster II (H3K27me3-high, with intensity of H3K27me3 higher than H3K4me3 FC ≥1.5), and cluster III (H3K4me3/K27me3-equal, with intensity of H3K27me3 equal to that of H3K4me3 |FC|<1.5 in the indicated models. (G) Alluvial plot of dynamic changes of chromatin bivalency states (CBSs) in the 3 clusters from drug-sensitive cells (LNCaP) to drug-resistant cells (42DEnzR). (H) IGV snapshots of H3K27me3 and H3K4me3 ChIP-seq at a representative gene in the indicated cells and PDX models. (I) Scatter plot of log2 FC in H3K4me3 mark intensity between 42DEnzR and LNCaP cells at all bivalent promoters and log2 FC in bivalent gene transcript levels between 42DEnzR and LNCaP cells. Pearson’s correlation scores and associated P value are indicated.
Significantly, we found that over 70% of the PCa cell state diversity genes were bivalent. They included programs of oncogenesis (110 genes) and response to stress/hypoxia (92 genes) and IFN (86 genes), as well as lineage specification (292 genes) and EMT (173 genes) (Figure 3D). Remarkably, our integration of genes commonly upregulated by PRC2i/EHZ2i in combination with ARSIs revealed that all bivalent CSP genes were induced by this combination treatment, which accounted for over 80% of all genes that were upregulated (Figure 3E). These data clearly indicated that cell state diversity induction was closely linked to chromatin bivalency alteration. The expression of bivalent genes in the cancer cells was highly responsive to the disruption of bivalency.
In embryonic development, changes in chromatin bivalency (e.g., increase in H3K4me3 and/or decrease in H3K27me3) result in the expression of specific developmental programs (3). We thus sought to determine whether similar alterations occur in drug resistance and cell state diversity. To this end, we used a pair of ARSI drug (Enz)-sensitive (LNCaP) and Enz-resistant (42DEnzR) (37) cell models and a pair of Enz-sensitive (LuCaP35CR) and Enz-resistant (LuCaP35EnzR) (this study) (38) tumor models. K-means clustering analysis of the bivalency marks revealed that, compared with the drug-sensitive cells and tumors, the drug-resistant ones had an increased number of genes that were H3K4me3-high and a reduced number of genes that were H3K27me3-high (Figure 3F and Supplemental Figure 3F). Indeed, genes in the CSP programs switched their bivalency from H3K27me3-high in cluster II or H3K27me3-H3K4me3 equal in cluster III in drug-sensitive cells to H3K4me3-high in cluster I in drug-resistant cells (Figures 3G and Supplemental Figure 3G and Supplemental Table 3). Consistent with the role of bivalency resolution in gene induction, over 85% of genes with the bivalency switches displayed increased expression in the drug-resistant models. Among them were CSP genes such as VEGFA, MYCL, and EPAS1 as well as cell-fate TFs (e.g., ASCL1, NKX2-1 and FOXA2) (Figure 3H and Supplemental Figure 3, H and I). Further analysis demonstrated that bivalency changes (i.e., H3K4me3 increase or H3K27me3 decrease) at individual genes were highly correlated with changes in their mRNA expression (Figure 3I and Supplemental Figure 3J). Taken together, our results demonstrated that CSP genes were largely bivalent and that cell state diversity induction was associated with chromatin bivalency alteration.
Cotargeting of PRC2 and the AR effectively disrupts the functional balance of PRC2 and KMT2B in bivalency maintenance. Consistent with the function of PRC2/EZH2 in controlling bivalency, treatment with an EZH2i (Taz) strongly decreased H3K27me3 in both PDX and immune-competent tumor models as well as in the cells. Interestingly, Taz also increased H3K4me3 in the cells and tumors (Figures 4, A and B, and Supplemental Figure 4, A and B). We also found that Enz strongly decreased H3K27me3 and increased H3K4me3 at bivalent genes of CSPs. Notably, their combined treatment resulted in even more pronounced alterations of the 2 marks.
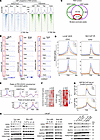 Figure 4
Cotargeting of PRC2 and AR effectively disrupts the functional balance of PRC2 and KMT2B in bivalency maintenance. (A) Heatmaps and signal profiles of H3K27me3 and H3K4me3 ChIP-seq signal intensity within ±3 kb windows at the TSS of CSPs (n = 798 peaks) in LuCaP35CR tumors in mice treated as indicated for 10 days. The ChIP-seq peaks were selected with FDR below 0.05. (B) IGV snapshots of H3K27me3 and H3K4me3 ChIP-seq peaks at representative CSP genes in LuCaP35CR tumors in mice treated as indicated for 10 days. (C) Venn diagram of ChIP-seq peak overlaps between EZH2 and EED at bivalent promoters in LuCaP35CR tumors. (D) Signal profiles of EZH2 and EED ChIP-seq within ±3 kb windows around the TSS at bivalent genes in LuCaP35CR and Myc-CaP tumors in mice treated as indicated for 10 days. The ChIP-seq peak was selected with a FDR of less than 0.05. (E) Signal profiles of EZH2, H3K27me3, and H3K4me3 ChIP-seq signal intensity within ±3 kb windows at the TSS at canonical but nonbivalent PRC2 target genes and at bivalent genes in 42DEnzR cells treated with 10 μM Taz or vehicle for 24 hours. (F) Heatmaps of gene expression changes when compared with vehicle in 42DEnzR cells treated as indicated for 48 hours. (G) Signal profiles of KMT2B ChIP-seq signal intensity within ±3 kb windows at the TSS at all bivalent gene promoters in LuCaP 35CR tumors and MyC-CaP mouse tumors treated as indicated for 10 days. (H) Western blots of proteins in LNCaP cells treated as indicated for 72 hours.
Bivalent marks in development are “written” primarily by KMT2B/MLL2 and PRC2/EZH2 complexes (3). Our ChIP-seq analysis revealed that the majority of EZH2- or EED-occupied promoters were bivalent in cancer cells (64% for EZH2; 65% for EED) and tumors (70% for EZH2; 69% for EED) (Supplemental Figure 4C). Notably, promoters co-occupied by EZH2 and EED contained essentially all bivalent promoters (Figure 4C). Significantly, functional inhibition of EZH2 dramatically decreased the occupancy of EZH2 and EED at bivalent promoters in the tumors and cells. As expected, it also decreased the EZH2 occupancy and H3K27me3 at nonbivalent PRC2 targets (Figure 4, D and E). Moreover, inhibition of EED function by EED226, which disrupts the PRC2 complex, also diminished H3K27me3 and its own occupancy at the bivalent promoters (Supplemental Figure 4, A and D). Interestingly, H3K27me3 marks at bivalent promoters were more sensitive to EZH2 inhibition than those at nonbivalent PRC2/EZH2 target genes (Figure 4, E and F).
To determine whether Enz affects the function of bivalency writers, we performed ChIP-seq analysis of EZH2, EED, and KMT2B in tumors treated with Enz. Our data demonstrated that Enz alone strongly diminished the occupancy of both EZH2 and EED. Taz and Enz combination diminished their occupancy further than either one alone (Figure 4D). Interestingly, Taz and Enz treatment caused a strong increase in KMT2B occupancy at the bivalent promoters (Figure 4G). In keeping with the noncanonical function of EZH2, inhibition of EZH2 diminished its occupancy at EZH2-AR target genes without significant effects on either the H3K27me3 or H3K4me3 mark (Supplemental Figure 4E). Notably, we found that none of the bivalent promoters was occupied by the AR (Supplemental Figure 4, F and G). Intriguingly, we found that Enz at 10 μM or higher and EZH2i at 5 μM or higher were sufficient to decrease EED and EZH2 protein levels and that the Taz and Enz combination was more effective in LNCaP and C4-2B cells (Figure 4H and Supplemental Figure 4H). It is well established that chromatin occupancy of EZH2 or EED at canonical PRC2 targets is in the form of the PRC2 protein complex of EZH2, EED, and SUZ12, and that EED nucleates the PRC2 complex occupancy at chromatin by binding to the H3K27me3 mark and further activating PRC2/EZH2 catalytic activity, forming a positive feedback loop in the PRC2 function of gene silencing (1, 2, 39). The remarkable decrease in EED and EZH2 protein levels will likely disrupt the PRC2 complex occupancy at chromatin and its catalytic activity in methylation of H3K27me3. Together, our results demonstrated that inhibition of PRC2 or the AR could significantly disrupt the function of PRC2 and that their cotargeting effectively tipped the functional balance of PRC2 and KMT2B in bivalency maintenance.
Wnt/β-catenin signaling drives changes in chromatin bivalency. Given that in development, bivalency is mainly controlled by different signaling pathways (40), we thus examined whether any of the regulatory programs served as the potential driver for the bivalency changes. Interestingly, GO program clustering analysis of all the genes with the bivalency changes revealed that Wnt/β-catenin signaling was a potential master regulator, as it connected all the CSPs except Notch (Supplemental Figure 5A). Importantly, expression of over 70% of the Wnt signaling genes was strongly induced in the drug-resistant models, including a large number of Wnt genes (e.g., WNT2/5A/10B), their receptors and coreceptors (e.g., FZD1/2/3, LRP5), positive regulators (e.g., DVL1, RSPO2/4), downstream targets (e.g., CCND3, MYC, AXIN2), and the total and active forms of β-catenin (Supplemental Figure 5, B and C), indicating hyperactive Wnt/β-catenin signaling. To provide the direct link to chromatin bivalency, we performed β-catenin ChIP-seq followed by ChromHMM analysis and found that β-catenin chromatin occupancy was strongly associated with bivalent promoters (Figure 5A, state 3). Strikingly, close to 95% of bivalent promoters were occupied by β-catenin (Figure 5B), clearly indicating its involvement in the control of bivalency. Treatment with a Wnt signaling inhibitor (LGK974) or an ectopically expressed, constitutively active form of β-catenin (ca–β-C/CTNNB1-ΔN90) (41) strongly decreased or increased, respectively, the β-catenin occupancy exclusively at bivalent promoters including the CSPs (Figure 5, C and D, and Supplemental Figure 5, D–F).
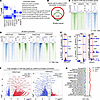 Figure 5
Wnt/β-catenin signaling drives chromatin bivalency changes. (A) Chromatin state analysis by ChromHMM of C4-2B cells with 9 epigenetic and TF ChIP-seq marks. Blue shadings depict the average intensity of a particular mark across each chromatin state. (B) Venn diagram of genes with β-catenin ChIP-seq peaks at promoters and bivalent genes in C4-2B cells. (C and D) Signal profiles and heatmaps of β-catenin (C) and H3K4me3 and H3K27me3 (D) ChIP-seq signal intensities within ±3 kb windows around the TSS at bivalent promoters in C4-2B cells with ca–β-C expression or vector control, or in C4-2B cells treated with 10 μM LGK974 or vehicle for 24 hours. (E) IGV snapshots of β-catenin ChIP-seq at the indicated bivalent genes in C4-2B cells treated as in D. (F) Volcano plots of FCs in log2 of H3K27me3 (left) and H3K4me3 (right) at all bivalent promoters in C4-2B cells treated with 10 μM LGK974 for 24 hours and their associated P values (–log10). (G) GSEA of gene expression changes detected by RNA-seq in C4-2B cells treated with 10 μM LGK974 or siβ-catenin for 48 hours, or with ca–β-C expression.
We next investigated whether hyperactive Wnt/β-catenin signaling promotes bivalency changes in cancer progression. We first performed bivalency ChIP-seq with cells treated with ca-β-C or the Wnt inhibitor. Our results demonstrated that ca-β-C diminished H3K27me3 and increased H3K4me3. In contrast, inhibition of Wnt/β-catenin signaling caused the opposite effects. Wnt3a treatment also resulted in effects similar to those seen with ca-β-C (Figure 5E and Supplemental Figure 5, G–I). Among the 3,026 genes (of 3,412 genes) with H3K27me3 highly increased by LGK974 and 2,793 genes with H3K4me3 decreased by LGK974 were CSP genes such as EPAS1, MYCL, BNIP3, ASCL1, NEUROD2, NEUROG1, SOX2, and POU3F2. Notably, the effects were also observed for Wnt signaling genes such as WNT7A/2B/9A/9B, RSPO1/2/4, FZD3/10, and CTNNB1 (Figure 5F), thus strongly suggesting a positive feed-forward loop that promotes a change in bivalency with Wnt/β-catenin signaling.
As expected, knockdown of β-catenin or Wnt inhibitor treatment markedly downregulated the expression of bivalent CSP genes, particularly in programs of MYC targets, response to stress, organ/tissue development, and EMT. In contrast, ca-β-C strongly induced their expression (Figure 5G). Indeed, the mRNA and protein expression of key LP drivers and markers such as ASCL1, BRN2, ONECUT1, CHGA, as well as of major neuron signaling and axon guidance genes was strongly affected by the treatments (Supplemental Figure 5, J and K). The expression of Wnt signaling program genes was also largely affected. Consistent with the above data, the expression of Wnt/β-catenin signaling genes was significantly correlated with the expression of other bivalent CSP genes in clinical tumors (Supplemental Figure 5L). In line with the effects on axonogenesis genes, ca-β-C significantly increased neurite-like protrusions (Supplemental Figure 5M).
REV-ERBα mediates Wnt/β-catenin function in driving chromatin bivalency changes. To identify TF mediators of the β-catenin function, we first analyzed the potential TF binding motifs that are associated with β-catenin occupancy at bivalent promoters and found that motifs of TFs such as REV-ERBs, BRN2, ZAC1, and ASCL1, but not TCF/LEF, were highly significantly enriched (Figure 6A). We recently found that in PCa adenocarcinoma cells and tumors, REV-ERBα (encoded by NR1D1), a major circadian rhythm regulator, switches its function from repressor to an activator in stimulation of the expression of a large number of tumorigenic genes (42). Our further study revealed that REV-ERBα plays a key role in PCa LP and ARSI drug resistance (43). Thus, we examined whether REV-ERBα is a potential mediator. Indeed, we found that REV-ERBα associated with β-catenin in the nucleus, and their association was significantly disrupted by inhibitors of Wnt and REV-ERBα (Figure 6B and Supplemental Figure 6A). Our ChromHMM analysis also found that REV-ERBα chromatin occupancy is strongly associated with bivalent promoters (Supplemental Figure 6B, state 3). Close to 95% of bivalent promoters were occupied by REV-ERBα (Supplemental Figure 6C), strongly suggesting its involvement in bivalency control. Ectopic expression of REV-ERBα strongly increased the occupancy of β-catenin at bivalent genes, and REV-ERBα inhibition diminished β-catenin occupancy (Figure 6C and Supplemental Figure 6D). Knockdown of REV-ERBα in ca-β-C–expressing cells dramatically decreased H3K4me3 and increased H3K27me3 at bivalent promoters (Figure 6D). Consistent with REV-ERBα being a mediator of β-catenin function, REV-ERBα knockdown also resulted in the downregulation of genes controlled by β-catenin, including different CSPs such as the cell response to stress and IFN, the cell cycle, and Wnt signaling (Supplemental Figure 6E). Together, our results demonstrated, unexpectedly, that REV-ERBα was a mediator of Wnt/β-catenin function in driving bivalency changes.
 Figure 6
REV-ERBα mediates Wnt/β-catenin function in driving chromatin bivalency changes. (A) Motif analysis of β-catenin ChIP-seq peaks at bivalent promoters in 42DEnzR cells. Motifs presented are based on the top 6 P values and distinct core sequences. (B) Left: Representative cell images from PLA analysis of β-catenin and REV-ERBα association in 42DEnzR cells treated with 10 μM LGK974 or 7.5 μM SR8278 vehicle for 24 hours. Images are representative of 3 independent experiments. Right: PLA dots were quantified (mean ± SD; n = 3). Scale bar: 50 μm. ****P < 0.0001, by 2-tailed Student’s t test. (C) Signal profiles and heatmaps of β-catenin and REV-ERBα ChIP-seq peaks intensity within ±3 kb windows at bivalent promoters in 42DEnzR cells treated with 7.5 μM SR8278 for 24 hours or with REV-ERBα overexpression. V, vehicle; Vec, vectors. (D) Signal profiles and heatmaps of H3K27me3 and H3K4me3 ChIP-seq peaks intensities within ±3 kb windows at bivalent promoters in ca-β-C–expressing C4-2B cells treated with siREV-ERBα or siControl (sictrl) for 24 hours.
Hyperactive Wnt/β-catenin signaling and REV-ERBα promote KMT2B function and antagonize PRC2 in driving chromatin bivalency change. To examine whether β-catenin and REV-ERBα promotes bivalency changes through the bivalent writer complexes, we first performed a proximity ligation assay (PLA). Indeed, we detected abundant interactions between KMT2B and β-catenin and REV-ERBα in nuclei, which were largely disrupted by the inhibitors of Wnt and REV-ERBα (Figure 7A). We then performed KMT2B ChIP-seq and found that, like β-catenin and REV-ERBα, a major proportion of KMT2B chromatin occupancy was at bivalent genes (Figure 7B). Ectopic expression of ca-β-C and REV-ERBα significantly increased KMT2B distribution at proximal promoter regions genome wide (Supplemental Figure 7A) and enhanced KMT2B occupancies at bivalent promoters (Figure 7C). ChIP-re-ChIP demonstrated co-occupation of β-catenin and REV-ERBα with KMT2B at the bivalent promoters and that their co-occupancy was significantly decreased by the inhibitors of Wnt and REV-ERBα. Furthermore, knockdown of β-catenin and REV-ERBα strongly decreased the occupancy of KMT2B and H3K4me3 at the bivalent promoters (Supplemental Figure 7, B and C).
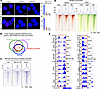 Figure 7
Hyperactive Wnt/β-catenin and REV-ERBα promote KMT2B function and antagonize PRC2 in driving chromatin bivalency changes. (A) Left: Representative images of PLA analysis of REV-ERBα, β-catenin, and KMT2B in 42DEnzR cells treated with 10 μM LGK974, 7.5 μM SR8278, or vehicle for 24 hours. Images are representative of 3 independent experiments. Right: PLA dots were quantified (mean ± SD; n = 3). Scale bar: 50 μm. ****P < 0.0001, by 2-tailed Student’s t test. (B) Venn diagram of peaks of REV-ERBα, β-catenin, and KMT2B ChIP-seq at bivalent promoters in C4-2B cells. (C) Signal profiles and heatmap of KMT2B ChIP-seq within ±3 kb windows around the TSS at bivalent promoters in C4-2B cells with ca–β-C expression, REV-ERBα OE, or vector control. (D) Signal profiles of EZH2 and EED ChIP-seq within ±3 kb windows around the TSS at bivalent promoters in 42DEnzR cells treated with vehicle,10 μM LGK974, or 7.5 μM SR8278 for 24 hours. (E) IGV snapshots of the indicated ChIP-seq at the indicated bivalent genes in C4-2B cells treated as in C and D.
We then sought to determine whether Wnt/β-catenin and REV-ERBα also affect the function of EZH2/PRC2. Indeed, inhibitors of Wnt signaling and REV-ERBα markedly increased the occupancy of EZH2 and EED at bivalent promoters (Figure 7, D and E) without apparent effects on nonbivalent promoters (Supplemental Figure 7D). Knockdown of β-catenin and REV-ERBα also increased the occupancy of EZH2 and H3K27me3 mark at bivalent promoters (Supplemental Figure 7E). Together, these findings suggest that β-catenin and REV-ERBα promote bivalency changes by recruiting KMT2B and antagonizing PRC2/EZH2 occupancy.
Induction of tumor cell–state diversity by PRC2/EZH2 inhibition can be mitigated by Wnt/β-catenin signaling blockade through alteration of chromatin bivalency. Given that hyperactive Wnt/β-catenin signaling antagonizes the function of PRC2, we examined whether therapeutic targeting of Wnt/β-catenin is sufficient to mitigate the unwanted consequences of PRC2/EZH2 inhibition. Indeed, addition of the Wnt inhibitor LGK to Taz treatment effectively eliminated the induction of all CSPs by Taz in both PDX and immune-competent tumors (Figure 8, A and B, and Supplemental Figure 8, A–C). It also significantly decreased the protein expression of ASCL1, POU3F2, and SOX2 and the marker CD44 in the tumors. Interestingly, LGK974 addition also decreased the expression of genes controlling cell proliferation and survival more effectively than either one alone (Supplemental Figure 8D). Consistently, the combination of LGK and Taz was more effective at inhibiting tumor growth than either one alone in both PDX and immune-competent tumors (Figure 8C and Supplemental Figure 8, E and F).
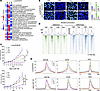 Figure 8
Induction of tumor cell–state diversity by PRC2/EZH2 inhibition can be mitigated by Wnt/β-catenin signaling blockade through alteration of chromatin bivalency. (A) Heatmaps of the GSVA score of the indicated programs detected by RNA-seq in LuCaP35CR tumors in mice treated as indicated for 10 days. (B) Representative confocal microscopy images of LP protein expression in LuCaP35CR tumors in mice treated as indicated (n = 5 mice per group). Note: The experiment here shares samples of vehicle and Taz treatments with those in Figure 2C and Supplemental Figure 2H. Scale bars: 50 μm. Bar graphs display ImageJ-analyzed IF intensity from 7 randomly selected fields per tumor. ****P < 0.0001, by 2-tailed Student’s t test. (C) Growth curves of LuCaP35CR PDX and MyC-CaP CR tumors in mice treated with vehicle or the indicated compounds for the indicated durations, 7 times per week (n = 5 mice per group). **P < 0.01 and ***P < 0.001, by 2-tailed Student’s t test. (D) Signal profiles and heatmaps of the indicated histone marks at bivalent promoters in LuCaP35CR tumors in mice treated as indicated for 10 days. (E) Signal profiles of EZH2, EED, and KMT2B/MLL2 ChIP-seq within ±3 kb windows around the TSS at bivalent CSPs in LuCaP35CR and MyC-CaP CR tumors in mice treated as indicated for 10 days.
Consistent with the changes in gene expression, LGK addition was effective in restoring the H3K27me3 mark at bivalent promoters that were diminished by Taz and in abolishing H3K4me3 increases by Taz, thus tipping the bivalency dynamics toward silencing (Figure 8D and Supplemental Figure 8G). In line with the changes in bivalency, LGK addition effectively countered Taz-induced reduction in EZH2 and EED occupancies, pushing their levels even above those seen with the vehicle control, while exerting a potent suppression on KMT2B occupancy (Figure 8E and Supplemental Figure 8H). In conclusion, our results demonstrated that induction of distinct tumor cell states, including LP, by PRC2/EZH2 inhibition can be effectively mitigated by blocking Wnt/β-catenin signaling through alteration of chromatin bivalency.


Copyright © 2026 American Society for Clinical Investigation
ISSN: 0021-9738 (print), 1558-8238 (online)