
Advertisement
Research ArticleCell biologyOncology
Open Access |  10.1172/JCI199838
Therapeutic targeting of the eIF4E cap-binding domain reveals control of lineage fate in prostate cancer
Rashmi Mishra,1 Sihyeon Song,1,2 Dhruv Choradia,1,2 Dmytro Rudoy,1 Cynthia L. Wladyka,1 Patrick Hoang,1 Jin Yeong Kim,1 Ilsa M. Coleman,1 Sonali Arora,1 Stephanie Dobersch,1 Alexander E. Orellana,1,3 Chenwei Lin,4 Philip R. Gafken,4 Eva Corey,5 Peter S. Nelson,1,6,7 Sita Kugel,1 Haolong Li,1 Arnab Sengupta,8 and Andrew C. Hsieh1,6,7
1Division of Human Biology, Fred Hutchinson Cancer Center, Seattle, Washington, USA.
2Department of Biology and
3Molecular and Cellular Biology Graduate Program, University of Washington, Seattle, Washington, USA.
4Proteomics & Metabolomics Shared Resource, Fred Hutchinson Cancer Center, Seattle, Washington, USA.
5Department of Urology, University of Washington, Seattle, Washington, USA.
6Division of Clinical Research, Fred Hutchinson Cancer Center, Seattle, Washington, USA.
7Departments of Medicine and Genome Sciences, University of Washington, Seattle, Washington, USA.
8Department of Biological and Environmental Sciences, Georgia College & State University, Milledgeville, Georgia, USA.
Address correspondence to: Andrew C. Hsieh, Division of Human Biology, Fred Hutchinson Cancer Center, 1100 Fairview Ave N., Seattle, Washington 98109, USA. Phone: 206.667.5871; Email: ahsieh@fredhutch.org.
Find articles by Mishra, R. in: PubMed | Google Scholar
1Division of Human Biology, Fred Hutchinson Cancer Center, Seattle, Washington, USA.
2Department of Biology and
3Molecular and Cellular Biology Graduate Program, University of Washington, Seattle, Washington, USA.
4Proteomics & Metabolomics Shared Resource, Fred Hutchinson Cancer Center, Seattle, Washington, USA.
5Department of Urology, University of Washington, Seattle, Washington, USA.
6Division of Clinical Research, Fred Hutchinson Cancer Center, Seattle, Washington, USA.
7Departments of Medicine and Genome Sciences, University of Washington, Seattle, Washington, USA.
8Department of Biological and Environmental Sciences, Georgia College & State University, Milledgeville, Georgia, USA.
Address correspondence to: Andrew C. Hsieh, Division of Human Biology, Fred Hutchinson Cancer Center, 1100 Fairview Ave N., Seattle, Washington 98109, USA. Phone: 206.667.5871; Email: ahsieh@fredhutch.org.
Find articles by Song, S. in: PubMed | Google Scholar
1Division of Human Biology, Fred Hutchinson Cancer Center, Seattle, Washington, USA.
2Department of Biology and
3Molecular and Cellular Biology Graduate Program, University of Washington, Seattle, Washington, USA.
4Proteomics & Metabolomics Shared Resource, Fred Hutchinson Cancer Center, Seattle, Washington, USA.
5Department of Urology, University of Washington, Seattle, Washington, USA.
6Division of Clinical Research, Fred Hutchinson Cancer Center, Seattle, Washington, USA.
7Departments of Medicine and Genome Sciences, University of Washington, Seattle, Washington, USA.
8Department of Biological and Environmental Sciences, Georgia College & State University, Milledgeville, Georgia, USA.
Address correspondence to: Andrew C. Hsieh, Division of Human Biology, Fred Hutchinson Cancer Center, 1100 Fairview Ave N., Seattle, Washington 98109, USA. Phone: 206.667.5871; Email: ahsieh@fredhutch.org.
Find articles by Choradia, D. in: PubMed | Google Scholar
1Division of Human Biology, Fred Hutchinson Cancer Center, Seattle, Washington, USA.
2Department of Biology and
3Molecular and Cellular Biology Graduate Program, University of Washington, Seattle, Washington, USA.
4Proteomics & Metabolomics Shared Resource, Fred Hutchinson Cancer Center, Seattle, Washington, USA.
5Department of Urology, University of Washington, Seattle, Washington, USA.
6Division of Clinical Research, Fred Hutchinson Cancer Center, Seattle, Washington, USA.
7Departments of Medicine and Genome Sciences, University of Washington, Seattle, Washington, USA.
8Department of Biological and Environmental Sciences, Georgia College & State University, Milledgeville, Georgia, USA.
Address correspondence to: Andrew C. Hsieh, Division of Human Biology, Fred Hutchinson Cancer Center, 1100 Fairview Ave N., Seattle, Washington 98109, USA. Phone: 206.667.5871; Email: ahsieh@fredhutch.org.
Find articles by Rudoy, D. in: PubMed | Google Scholar
1Division of Human Biology, Fred Hutchinson Cancer Center, Seattle, Washington, USA.
2Department of Biology and
3Molecular and Cellular Biology Graduate Program, University of Washington, Seattle, Washington, USA.
4Proteomics & Metabolomics Shared Resource, Fred Hutchinson Cancer Center, Seattle, Washington, USA.
5Department of Urology, University of Washington, Seattle, Washington, USA.
6Division of Clinical Research, Fred Hutchinson Cancer Center, Seattle, Washington, USA.
7Departments of Medicine and Genome Sciences, University of Washington, Seattle, Washington, USA.
8Department of Biological and Environmental Sciences, Georgia College & State University, Milledgeville, Georgia, USA.
Address correspondence to: Andrew C. Hsieh, Division of Human Biology, Fred Hutchinson Cancer Center, 1100 Fairview Ave N., Seattle, Washington 98109, USA. Phone: 206.667.5871; Email: ahsieh@fredhutch.org.
Find articles by Wladyka, C. in: PubMed | Google Scholar
1Division of Human Biology, Fred Hutchinson Cancer Center, Seattle, Washington, USA.
2Department of Biology and
3Molecular and Cellular Biology Graduate Program, University of Washington, Seattle, Washington, USA.
4Proteomics & Metabolomics Shared Resource, Fred Hutchinson Cancer Center, Seattle, Washington, USA.
5Department of Urology, University of Washington, Seattle, Washington, USA.
6Division of Clinical Research, Fred Hutchinson Cancer Center, Seattle, Washington, USA.
7Departments of Medicine and Genome Sciences, University of Washington, Seattle, Washington, USA.
8Department of Biological and Environmental Sciences, Georgia College & State University, Milledgeville, Georgia, USA.
Address correspondence to: Andrew C. Hsieh, Division of Human Biology, Fred Hutchinson Cancer Center, 1100 Fairview Ave N., Seattle, Washington 98109, USA. Phone: 206.667.5871; Email: ahsieh@fredhutch.org.
Find articles by Hoang, P. in: PubMed | Google Scholar
1Division of Human Biology, Fred Hutchinson Cancer Center, Seattle, Washington, USA.
2Department of Biology and
3Molecular and Cellular Biology Graduate Program, University of Washington, Seattle, Washington, USA.
4Proteomics & Metabolomics Shared Resource, Fred Hutchinson Cancer Center, Seattle, Washington, USA.
5Department of Urology, University of Washington, Seattle, Washington, USA.
6Division of Clinical Research, Fred Hutchinson Cancer Center, Seattle, Washington, USA.
7Departments of Medicine and Genome Sciences, University of Washington, Seattle, Washington, USA.
8Department of Biological and Environmental Sciences, Georgia College & State University, Milledgeville, Georgia, USA.
Address correspondence to: Andrew C. Hsieh, Division of Human Biology, Fred Hutchinson Cancer Center, 1100 Fairview Ave N., Seattle, Washington 98109, USA. Phone: 206.667.5871; Email: ahsieh@fredhutch.org.
Find articles by Kim, J. in: PubMed | Google Scholar
1Division of Human Biology, Fred Hutchinson Cancer Center, Seattle, Washington, USA.
2Department of Biology and
3Molecular and Cellular Biology Graduate Program, University of Washington, Seattle, Washington, USA.
4Proteomics & Metabolomics Shared Resource, Fred Hutchinson Cancer Center, Seattle, Washington, USA.
5Department of Urology, University of Washington, Seattle, Washington, USA.
6Division of Clinical Research, Fred Hutchinson Cancer Center, Seattle, Washington, USA.
7Departments of Medicine and Genome Sciences, University of Washington, Seattle, Washington, USA.
8Department of Biological and Environmental Sciences, Georgia College & State University, Milledgeville, Georgia, USA.
Address correspondence to: Andrew C. Hsieh, Division of Human Biology, Fred Hutchinson Cancer Center, 1100 Fairview Ave N., Seattle, Washington 98109, USA. Phone: 206.667.5871; Email: ahsieh@fredhutch.org.
Find articles by Coleman, I. in: PubMed | Google Scholar
1Division of Human Biology, Fred Hutchinson Cancer Center, Seattle, Washington, USA.
2Department of Biology and
3Molecular and Cellular Biology Graduate Program, University of Washington, Seattle, Washington, USA.
4Proteomics & Metabolomics Shared Resource, Fred Hutchinson Cancer Center, Seattle, Washington, USA.
5Department of Urology, University of Washington, Seattle, Washington, USA.
6Division of Clinical Research, Fred Hutchinson Cancer Center, Seattle, Washington, USA.
7Departments of Medicine and Genome Sciences, University of Washington, Seattle, Washington, USA.
8Department of Biological and Environmental Sciences, Georgia College & State University, Milledgeville, Georgia, USA.
Address correspondence to: Andrew C. Hsieh, Division of Human Biology, Fred Hutchinson Cancer Center, 1100 Fairview Ave N., Seattle, Washington 98109, USA. Phone: 206.667.5871; Email: ahsieh@fredhutch.org.
Find articles by Arora, S. in: PubMed | Google Scholar
1Division of Human Biology, Fred Hutchinson Cancer Center, Seattle, Washington, USA.
2Department of Biology and
3Molecular and Cellular Biology Graduate Program, University of Washington, Seattle, Washington, USA.
4Proteomics & Metabolomics Shared Resource, Fred Hutchinson Cancer Center, Seattle, Washington, USA.
5Department of Urology, University of Washington, Seattle, Washington, USA.
6Division of Clinical Research, Fred Hutchinson Cancer Center, Seattle, Washington, USA.
7Departments of Medicine and Genome Sciences, University of Washington, Seattle, Washington, USA.
8Department of Biological and Environmental Sciences, Georgia College & State University, Milledgeville, Georgia, USA.
Address correspondence to: Andrew C. Hsieh, Division of Human Biology, Fred Hutchinson Cancer Center, 1100 Fairview Ave N., Seattle, Washington 98109, USA. Phone: 206.667.5871; Email: ahsieh@fredhutch.org.
Find articles by Dobersch, S. in: PubMed | Google Scholar
1Division of Human Biology, Fred Hutchinson Cancer Center, Seattle, Washington, USA.
2Department of Biology and
3Molecular and Cellular Biology Graduate Program, University of Washington, Seattle, Washington, USA.
4Proteomics & Metabolomics Shared Resource, Fred Hutchinson Cancer Center, Seattle, Washington, USA.
5Department of Urology, University of Washington, Seattle, Washington, USA.
6Division of Clinical Research, Fred Hutchinson Cancer Center, Seattle, Washington, USA.
7Departments of Medicine and Genome Sciences, University of Washington, Seattle, Washington, USA.
8Department of Biological and Environmental Sciences, Georgia College & State University, Milledgeville, Georgia, USA.
Address correspondence to: Andrew C. Hsieh, Division of Human Biology, Fred Hutchinson Cancer Center, 1100 Fairview Ave N., Seattle, Washington 98109, USA. Phone: 206.667.5871; Email: ahsieh@fredhutch.org.
Find articles by Orellana, A. in: PubMed | Google Scholar
1Division of Human Biology, Fred Hutchinson Cancer Center, Seattle, Washington, USA.
2Department of Biology and
3Molecular and Cellular Biology Graduate Program, University of Washington, Seattle, Washington, USA.
4Proteomics & Metabolomics Shared Resource, Fred Hutchinson Cancer Center, Seattle, Washington, USA.
5Department of Urology, University of Washington, Seattle, Washington, USA.
6Division of Clinical Research, Fred Hutchinson Cancer Center, Seattle, Washington, USA.
7Departments of Medicine and Genome Sciences, University of Washington, Seattle, Washington, USA.
8Department of Biological and Environmental Sciences, Georgia College & State University, Milledgeville, Georgia, USA.
Address correspondence to: Andrew C. Hsieh, Division of Human Biology, Fred Hutchinson Cancer Center, 1100 Fairview Ave N., Seattle, Washington 98109, USA. Phone: 206.667.5871; Email: ahsieh@fredhutch.org.
Find articles by Lin, C. in: PubMed | Google Scholar
1Division of Human Biology, Fred Hutchinson Cancer Center, Seattle, Washington, USA.
2Department of Biology and
3Molecular and Cellular Biology Graduate Program, University of Washington, Seattle, Washington, USA.
4Proteomics & Metabolomics Shared Resource, Fred Hutchinson Cancer Center, Seattle, Washington, USA.
5Department of Urology, University of Washington, Seattle, Washington, USA.
6Division of Clinical Research, Fred Hutchinson Cancer Center, Seattle, Washington, USA.
7Departments of Medicine and Genome Sciences, University of Washington, Seattle, Washington, USA.
8Department of Biological and Environmental Sciences, Georgia College & State University, Milledgeville, Georgia, USA.
Address correspondence to: Andrew C. Hsieh, Division of Human Biology, Fred Hutchinson Cancer Center, 1100 Fairview Ave N., Seattle, Washington 98109, USA. Phone: 206.667.5871; Email: ahsieh@fredhutch.org.
Find articles by Gafken, P. in: PubMed | Google Scholar
1Division of Human Biology, Fred Hutchinson Cancer Center, Seattle, Washington, USA.
2Department of Biology and
3Molecular and Cellular Biology Graduate Program, University of Washington, Seattle, Washington, USA.
4Proteomics & Metabolomics Shared Resource, Fred Hutchinson Cancer Center, Seattle, Washington, USA.
5Department of Urology, University of Washington, Seattle, Washington, USA.
6Division of Clinical Research, Fred Hutchinson Cancer Center, Seattle, Washington, USA.
7Departments of Medicine and Genome Sciences, University of Washington, Seattle, Washington, USA.
8Department of Biological and Environmental Sciences, Georgia College & State University, Milledgeville, Georgia, USA.
Address correspondence to: Andrew C. Hsieh, Division of Human Biology, Fred Hutchinson Cancer Center, 1100 Fairview Ave N., Seattle, Washington 98109, USA. Phone: 206.667.5871; Email: ahsieh@fredhutch.org.
Find articles by
Corey, E.
in:
PubMed
|
Google Scholar
|

1Division of Human Biology, Fred Hutchinson Cancer Center, Seattle, Washington, USA.
2Department of Biology and
3Molecular and Cellular Biology Graduate Program, University of Washington, Seattle, Washington, USA.
4Proteomics & Metabolomics Shared Resource, Fred Hutchinson Cancer Center, Seattle, Washington, USA.
5Department of Urology, University of Washington, Seattle, Washington, USA.
6Division of Clinical Research, Fred Hutchinson Cancer Center, Seattle, Washington, USA.
7Departments of Medicine and Genome Sciences, University of Washington, Seattle, Washington, USA.
8Department of Biological and Environmental Sciences, Georgia College & State University, Milledgeville, Georgia, USA.
Address correspondence to: Andrew C. Hsieh, Division of Human Biology, Fred Hutchinson Cancer Center, 1100 Fairview Ave N., Seattle, Washington 98109, USA. Phone: 206.667.5871; Email: ahsieh@fredhutch.org.
Find articles by Nelson, P. in: PubMed | Google Scholar
1Division of Human Biology, Fred Hutchinson Cancer Center, Seattle, Washington, USA.
2Department of Biology and
3Molecular and Cellular Biology Graduate Program, University of Washington, Seattle, Washington, USA.
4Proteomics & Metabolomics Shared Resource, Fred Hutchinson Cancer Center, Seattle, Washington, USA.
5Department of Urology, University of Washington, Seattle, Washington, USA.
6Division of Clinical Research, Fred Hutchinson Cancer Center, Seattle, Washington, USA.
7Departments of Medicine and Genome Sciences, University of Washington, Seattle, Washington, USA.
8Department of Biological and Environmental Sciences, Georgia College & State University, Milledgeville, Georgia, USA.
Address correspondence to: Andrew C. Hsieh, Division of Human Biology, Fred Hutchinson Cancer Center, 1100 Fairview Ave N., Seattle, Washington 98109, USA. Phone: 206.667.5871; Email: ahsieh@fredhutch.org.
Find articles by Kugel, S. in: PubMed | Google Scholar
1Division of Human Biology, Fred Hutchinson Cancer Center, Seattle, Washington, USA.
2Department of Biology and
3Molecular and Cellular Biology Graduate Program, University of Washington, Seattle, Washington, USA.
4Proteomics & Metabolomics Shared Resource, Fred Hutchinson Cancer Center, Seattle, Washington, USA.
5Department of Urology, University of Washington, Seattle, Washington, USA.
6Division of Clinical Research, Fred Hutchinson Cancer Center, Seattle, Washington, USA.
7Departments of Medicine and Genome Sciences, University of Washington, Seattle, Washington, USA.
8Department of Biological and Environmental Sciences, Georgia College & State University, Milledgeville, Georgia, USA.
Address correspondence to: Andrew C. Hsieh, Division of Human Biology, Fred Hutchinson Cancer Center, 1100 Fairview Ave N., Seattle, Washington 98109, USA. Phone: 206.667.5871; Email: ahsieh@fredhutch.org.
Find articles by Li, H. in: PubMed | Google Scholar
1Division of Human Biology, Fred Hutchinson Cancer Center, Seattle, Washington, USA.
2Department of Biology and
3Molecular and Cellular Biology Graduate Program, University of Washington, Seattle, Washington, USA.
4Proteomics & Metabolomics Shared Resource, Fred Hutchinson Cancer Center, Seattle, Washington, USA.
5Department of Urology, University of Washington, Seattle, Washington, USA.
6Division of Clinical Research, Fred Hutchinson Cancer Center, Seattle, Washington, USA.
7Departments of Medicine and Genome Sciences, University of Washington, Seattle, Washington, USA.
8Department of Biological and Environmental Sciences, Georgia College & State University, Milledgeville, Georgia, USA.
Address correspondence to: Andrew C. Hsieh, Division of Human Biology, Fred Hutchinson Cancer Center, 1100 Fairview Ave N., Seattle, Washington 98109, USA. Phone: 206.667.5871; Email: ahsieh@fredhutch.org.
Find articles by Sengupta, A. in: PubMed | Google Scholar
1Division of Human Biology, Fred Hutchinson Cancer Center, Seattle, Washington, USA.
2Department of Biology and
3Molecular and Cellular Biology Graduate Program, University of Washington, Seattle, Washington, USA.
4Proteomics & Metabolomics Shared Resource, Fred Hutchinson Cancer Center, Seattle, Washington, USA.
5Department of Urology, University of Washington, Seattle, Washington, USA.
6Division of Clinical Research, Fred Hutchinson Cancer Center, Seattle, Washington, USA.
7Departments of Medicine and Genome Sciences, University of Washington, Seattle, Washington, USA.
8Department of Biological and Environmental Sciences, Georgia College & State University, Milledgeville, Georgia, USA.
Address correspondence to: Andrew C. Hsieh, Division of Human Biology, Fred Hutchinson Cancer Center, 1100 Fairview Ave N., Seattle, Washington 98109, USA. Phone: 206.667.5871; Email: ahsieh@fredhutch.org.
Find articles by
Hsieh, A.
in:
PubMed
|
Google Scholar
|
Published April 15, 2026 - More info
J Clin Invest. 2026;136(12):e199838. https://doi.org/10.1172/JCI199838.
© 2026 Mishra et al. This work is licensed under the Creative Commons Attribution 4.0 International License. To view a copy of this license, visit http://creativecommons.org/licenses/by/4.0/.
Received: September 3, 2025; Accepted: April 10, 2026

Related article:
Abstract
Cancer proteogenomics has revealed that RNA abundance often poorly predicts protein output, highlighting translation as a central determinant of malignant identity. In this issue of JCI, Mishra et al. showed that pharmacologic inhibition of eIF4E cap binding selectively rewired the prostate cancer translatome, suppressing basal keratin translation while promoting luminal features and renewed sensitivity to hormone therapy. More broadly, the study illustrates how tumors exploit selective translation to maintain lineage plasticity, survival, and therapeutic resistance. Targeting translational dependencies may therefore offer a powerful strategy to dismantle cancer-specific proteomic programs and convert resistant cell states into druggable vulnerabilities.
Authors
Davide Ruggero

-
Results
The eIF4E cap-binding domain is a new therapeutic vulnerability in advanced prostate cancer. Previous studies of translation inhibitors and activators in cancer have primarily focused on the central premise that suppressing or enhancing protein synthesis directly yields antitumor effects. However, no systematic comparison of these agents has been made across the same models in a human malignancy. This raises the important question of the comparative efficacy of each modality. We conducted a pharmacological screen of translation modulators, both inhibitors and activators, probing their sensitivity across a panel of advanced-stage prostate cancers. We tested a series of preclinical and clinical compounds that either enhance or inhibit protein synthesis, including 2BAct (eIF2B activator), DN9058 (eIF2B activator, Denali Therapeutics), eFT508 (eIF4E serine 209 phosphorylation inhibitor, eFFECTOR Therapeutics), eFT226 (eIF4A inhibitor, eFFECTOR Therapeutics), homoharringtonine (HHT) (translation initiation elongation inhibitor, Teva), and PF-07293623 (eIF4E cap-binding domain inhibitor, Pfizer) (Figure 1A) (28–32). We screened each compound across a panel of CRPC patient–derived xenograft (PDX) models that have been adapted to 2D culture: LuCaP 35CS (AR-intact castration sensitive in vivo), LuCaP 35CR (AR-intact castration resistant in vivo), and LuCaP 176 (AR-low CRPC) (Figure 1B) (33). These models were chosen because they represent major phenotypes observed in patients with prostate cancer. Importantly, transcriptional profiling revealed strong similarities between the 2D and PDX models (Figure 1B).
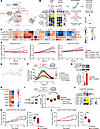 Figure 1
Inhibition of the eIF4E cap-binding domain suppresses advanced prostate cancer growth. (A) Schematic showing mechanism of action of clinical and preclinical mRNA translation modulators: 2BAct, DN9058, eFT508, eFT226, HHT, and PF-07293623. (B) Preclinical pharmacological screen on LuCaP cell lines. (C) Heatmap showing fold change in growth of LuCaP cells treated with DMSO (vehicle) or translation activators or inhibitors. n = 3 or more. (D) Cell growth curves of LuCaP 35CS, LuCaP 35CR, and LuCaP 176 cells treated with DMSO or PF-07293623, normalized to vehicle. (E) Chemical structure of PF-07293623. (F) Caspase-3 activity over time in LuCaP 176 cells treated with DMSO or PF-07293623 (100 nM) treatment. n = 4. In controls, Staurosporin was used to induce apoptosis and C3 inhibitor was used to inhibit apoptosis. (G) Representative immunoblots (top) and quantification (bottom) of cleaved caspase 3 in LuCaP 176 cells treated with DMSO or PF07293623 (100 nM, 72 hours), n = 6. (H) Heatmap showing fold change in growth of PC3, DU145, LNCaP, 22Rv1, VCaP, and PREC cells treated with DMSO or PF-07293623 (100 nM), n = 3. (I) Cell growth of GFP+ cells expressing vector or eIF4E-GFP constructs treated with DMSO or PF-07293623 (100 nM, 72 hours). (J) Luminal and basal features of LuCaP PDX models. (K and L) LuCaP PDX tumor growth curve (left) and end tumor volumes (right) for (K), LuCaP 35CS PDX treated with vehicle (n = 6), PF07293623 (n = 7), and (L) LuCaP 176 PDX treated with vehicle (n = 6) or PF07293623 (n = 8). Plots represent mean ± SEM. Significance was determined by 1-way ANOVA with Dunnett’s multiple comparisons test in D, F; by Unpaired 2-tailed Student’s t test in G, I, K, and L. *P < 0.05; **P < 0.01; ***P < 0.001; ****P < 0.0001.
The compounds were screened for effects on cell growth by serial imaging over 4 days at a concentration range of 0.0001–10 μM. Unexpectedly, we found that the eIF2B activators 2BAct and DN9058 did not inhibit the growth of any LuCaP model (Figure 1C and Supplemental Figure 1, A and B; supplemental material available online with this article; https://doi.org/10.1172/JCI199838DS1). Among the translation inhibitors, eFT508 exerted a slight reduction in growth in AR-proficient LuCaP 35CS and 35CR lines, though only at higher doses (Figure 1C and Supplemental Figure 1C). However, eFT226 and HHT more effectively suppressed the growth of these same models at lower doses (Figure 1C and Supplemental Figure 1, D and E). Notably, none of these agents had any significant impact on the growth of AR-low LuCaP 176 cells (Figure 1C). In contrast, PF-07293623 consistently inhibited growth across all 3 LuCaP models (Figure 1, C and D). PF-07293623 is a 7-(5-chloro-2-{3-(5-cyano-6-{(1-(2,2-difluoropropyl)piperidin-4-yl) (methyl)amino}-2-methyl-4-oxopyrido[3,4-d]pyrimidin-3(4H)-yl)prop-1-yn-1-yl}phenyl)thieno[3,2-b]pyridine-3-carboxylic acid that was identified through a medicinal chemistry campaign to directly inhibit the eIF4E cap-binding domain (Figure 1E) (32). We next sought to determine the cellular mechanism through which PF-07293623 disrupts cell growth. We observed a small but significant increase in the G1 phase, accompanied by a reduction in the S and G2/M phases of the cell cycle (Supplemental Figure 1F). Additionally, utilizing real-time cleaved caspase 3 monitoring in live cells, we observed a substantial increase in apoptosis upon drug treatment, which was also confirmed by Western blot analysis (Figure 1, F and G). Given the profound effects of the agent on AR-low prostate cancer growth, we next tested the drug in AR-null PC3 and DU145 cells and compared the response to AR-driven LNCaP, 22Rv1, and VCaP cells. Strikingly, the AR-null cells were highly sensitive to cap-binding domain inhibition, whereas the AR-driven cells were largely resistant, suggesting that dependence on AR signaling may limit vulnerability (Figure 1H and Supplemental Figure 2, A–E). Since eIF4E cap-binding domain inhibition could theoretically be broadly toxic, we tested this compound in immortalized PrEC cells and found that they were insensitive to the drug (Figure 1H and Supplemental Figure 2F). These data show that inhibition of the eIF4E cap-binding domain by PF-07293623 can target AR-independent cells. To further evaluate if eIF4E directly mediates this sensitivity, we overexpressed eIF4E in LuCaP 176 cells and assessed the impact of PF-07293623 on cell growth. Overexpression of eIF4E rescued the drug-induced growth inhibition observed in vector controls (Figure 1I). In addition, eIF4E overexpression led to an increase in cell size, consistent with a conserved role of eIF4E in promoting cell growth (Supplemental Figure 2G) (34).
These findings led us to investigate if targeting the eIF4E cap-binding domain could effectively suppress tumor growth in vivo without undue toxicity. We chose to test the CRPC LuCaP 35CS PDX model, which expresses AR and is luminal in nature, and the LuCaP 176 PDX model, which has basal features and expresses low levels of AR similar to their in vitro counter parts (Figure 1, B and J, and Supplemental Figure 2H). Importantly, basal prostate cancers are more aggressive and resistant to therapies compared with luminal prostate cancers (35). Mice were randomized to receive vehicle or PF-07293623 (50 mg/kg, orally, twice daily) (Supplemental Figure 2I). The luminal LuCaP 35CS model exhibited a modest response to PF-07293623 treatment (Figure 1K). In contrast, the basal LuCaP 176 model was remarkably responsive to eIF4E cap-binding domain inhibition. In fact, tumors remained the same size throughout the trial, revealing a complete block in growth (Figure 1L). Importantly, mice treated with PF-07293623 showed no signs of significant toxicity (Supplemental Figure 2, J–N). Together, these findings demonstrate the therapeutic efficacy and safety of targeting the eIF4E cap-binding domain in advanced prostate cancer. Moreover, the agent appears to be particularly effective in recalcitrant prostate cancer with basal features.
PF-07293623 inhibits protein synthesis and cap binding to eIF4E. eIF4E binds to the 7-methylguanosine (m7G) cap of mRNA to initiate mRNA translation (36). PF-07293623 was developed as an eIF4E cap-binding domain inhibitor and should therefore inhibit protein synthesis. To monitor the effects PF-07293623 on mRNA translation, we employed biorthogonal noncanonical amino acid tagging (BONCAT) with homopropargylglycine (HPG), a methionine analog with an alkyne moiety that incorporates into nascent peptide chains in place of endogenous methionine (37). HPG-labeled peptides can be selectively tagged with a fluorophore via a copper-catalyzed azide-alkyne cycloaddition reaction, enabling quantification of newly synthesized proteins within cells by flow cytometry (Figure 2A). We measured HPG incorporation after PF-07293623 treatment over a 24-hour period and observed a decrease in protein synthesis after 2 hours of drug exposure, which peaked by 6 hours (Figure 2B). Overall, PF-07293623 decreased mRNA translation by 40% (Figure 2B).
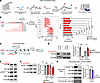 Figure 2
PF-07293623 impairs protein synthesis rates by suppressing eIF4E-m7G cap-binding affinity. (A) Schematic of the homopropargylglycine (HPG) incorporation assay. HPG, a methionine analog, is incorporated into newly synthesized proteins and conjugated to AF555 via copper-catalyzed click chemistry; fluorescence measured by flow cytometry reflects protein synthesis. (B) Representative HPG incorporation histograms (middle) and fluorescence quantification (right) in LuCaP 176 cells treated with DMSO (vehicle) or PF-07293623 (100 nM). (C) Schematic of m7G cap-binding assay. (D) Representative immunoblot (left) and quantification (right) of eIF4E in m7G bound and flow-through fractions in LuCaP 176 cells treated with DMSO or PF-07293623 (100 nM, 6 hours), n = 3. (E and F) Representative immunoblots of LuCaP 176 cells treated with DMSO or PF-07293623 (100 nM, 72 hours), n = 3 or more for (E) eIF4G, eIF4A, phospho-4EBP1T37/46, and 4EBP1, and (F) phospho-eIF4ES209 and eIF4E. (G) Representative immunoblot and quantification of phospho-eIF4E (S209) and eIF4E in whole cell lysates (top) and m7G bound fractions (bottom) from ventral prostates of WT and eIF4E S209A mice, n = 3 per group. Plots represent mean ± SEM. Significance was determined by 1-way ANOVA with Dunnett’s multiple comparisons test in B; by Unpaired 2-tailed Student’s t test in D, F, and G. *P < 0.05; ***P < 0.001; ****P < 0.0001.
The rationale behind eIF4E cap-binding domain inhibitors is to compete against capped mRNA for binding to eIF4E, thereby inhibiting cap-dependent mRNA translation (38). We sought to directly verify whether PF-07293623 acts as a cap mimetic. To test this, we pretreated LuCaP 176 cells with or without PF-07293623 and performed a cap-binding assay to assess the affinity of eIF4E for a m7G cap analog which mimics capped mRNA (Figure 2C). PF-07293623 treatment strikingly blocked binding of eIF4E to the m7G cap analog and increased the levels of unbound eIF4E in the flow-through fraction (Figure 2D). Importantly, PF-07293623 did not affect total levels of eIF4E or coassociated proteins such as eIF4G, eIF4A, and 4EBP1 (Figure 2, E and F, and Supplemental Figure 3A).
Interestingly, PF-07293623 treatment led to a decrease in eIF4E phosphorylation at serine 209 (Figure 2F). In vitro studies with purified eIF4E have presented contradictory findings of the role of serine 209 phosphorylation on cap-binding capacity (39, 40). As such, we sought to determine how eIF4E serine 209 phosphorylation impacts cap binding in prostate epithelial cells. To this end, we performed cap-binding assays of prostate epithelial cells isolated from eIF4E knock-in mice where serine 209 has been mutated to an alanine and is therefore unphosphorylatable (Figure 2G and Supplemental Figure 3B) (41). Remarkably, we found no difference in the binding affinity of WT and mutant eIF4E (S209A) to the m7G cap analog (Figure 2G). This finding suggests that PF-07293623 cap-binding inhibition likely functions independent of phosphorylation of eIF4E at serine 209. Together, this data shows that PF-07293623 is a mRNA translation inhibitor, which functions by disrupting eIF4E binding to the m7G cap.
The eIF4E cap-binding domain controls lineage state. To elucidate the mechanism by which inhibiting the cap-binding domain of eIF4E suppresses prostate cancer growth in the setting of low AR, we sought to quantify the therapeutic proteome upon drug treatment. However, conventional mass spectrometry can only measure steady-state levels of proteins and may be influenced by turnover. To selectively quantify newly synthesized proteins upon cap-binding domain inhibition, we employed a state-of-the-art approach that combines HPG labeling with mass spectrometry. Unlike conventional proteomics, HPG-TMT mass spectrometry specifically captures newly synthesized proteins through HPG pulse labeling and pulldown (Figure 3A). This approach provides a more accurate and time-resolved snapshot of proteome-wide translational activity.
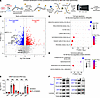 Figure 3
Loss of basal cell identity upon inhibition of the eIF4E cap-binding domain. (A) Schematic of HPG-TMT mass spectrometry. (B) Volcano plot of differentially regulated proteins in LuCaP 176 cells upon eIF4E cap-binding domain inhibition with PF-07293623 (100 nM, 6 hours). (C) GSEA of cell type signature (C8, MSigDB) of top 500 downregulated proteins shown in B. (D) GSEA of canonical pathways (CP, Enrichr) for top 50 downregulated proteins shown in B. (E) mRNA levels of KRT2, KRT5, KRT6B, KRT9, and KRT14. (F) Representative immunoblots for KRT2, KRT5, KRT6B, KRT9, KRT14, KRT71, and KRT18 in LuCaP 176 cells treated with PF-07293623 (100 nM, 72 hours), normalized to vehicle, n = 3. Plots represent mean ± SEM. Significance was determined by Unpaired 2-tailed Student’s t test in E.
AR-low LuCaP 176 cells were treated with PF-07293623 or vehicle for 6 hours, which correlates to the peak of protein synthesis inhibition (Figure 2B), and subjected to HPG-TMT mass spectrometry (Figure 3A). PF-07293623 treatment resulted in 692 downregulated and 465 upregulated proteins (Figure 3B and Supplemental Table 1). Interestingly, Gene Set Enrichment Analysis (GSEA) of the top 500 downregulated proteins revealed enrichment of basal-cell type gene signatures (Figure 3C). In parallel, GSEA of the most strongly downregulated proteins (top 50 candidates) identified significant enrichment of keratinization-related canonical pathways (CP) and gene ontology (GO) terms (Figure 3D and Supplemental Figure 4A). Collectively, we found that these signatures were associated with basal keratins (KRT), including KRT 2, 5, 6B, and 14, as well as KRT 9 and 71 (Figure 3B). RNA-seq and Western blot analysis revealed that the expression of these basal keratins was not reduced at the mRNA level but was decreased at the protein level following treatment with PF-07293623 (Figure 3, E and F, Supplemental Figure 4B, and Supplemental Table 2). Importantly, we observed no changes in luminal KRT 8 and 18, suggesting that eIF4E cap-binding domain inhibition specifically affects the translation of basal keratins (Figure 3, B and F). These results suggest that the eIF4E cap-binding domain can control lineage features of prostate cancer through the selective translation of basal keratins.
Basal keratins are regulated by a 5′ UTR cis-regulatory element and are necessary for survival. To determine the mechanism by which the eIF4E cap-binding domain coordinates the translation of basal keratins, we focused on the 5′ untranslated region (5′ UTR). The 5′ UTR is situated upstream of the coding sequence of nearly all mRNAs and its capped 5′ end is the docking site for eIF4E (42). We hypothesized that specific sequence motifs or structure-based elements within the 5′ UTR of basal keratin mRNAs influence their translational efficiency and sensitivity to PF-07293623. Building on this concept, we investigated the 5′ UTR of KRT5, a canonical basal marker, to identify cell-type–specific structural features that might confer translational control. We performed selective 2′-hydroxyl acylation analyzed by primer extension and mutational profiling (SHAPE-MaP) using KRT5 gene-specific reverse transcription on both gently deproteinated cell-free RNA and in-cell RNA from LuCaP 176 cells. We identified 2 stem-loop structures within the KRT5 5′ UTR that showed high base-pairing probability in both cell-free and in-cell conditions (Figure 4, A and B, and Supplemental Figure 5A). The first, spanning nucleotides 23–46, exhibited low SHAPE reactivity (< 0.4) and low Shannon entropy (< 0.08), suggestive of a stable and potentially functional structural element (43). The second region, spanning nucleotides 48–130 expands into the coding sequence, which starts at position 99. This structure had higher SHAPE and Shannon entropy (> 0.4 and > 0.08, respectively) making it more dynamic and less stable (Figure 4, A and B). To determine whether these structures contribute to translation regulation, we generated luciferase reporter constructs in which nucleotides 41–69 were deleted to disrupt both stem loops simultaneously (Figure 4B). WT and the stem-loop deletion mutant constructs were transduced in LuCaP 176 cells and treated with PF-07293623. We observed that deletion of the stem loop increased translation through the KRT5 5′ UTR (Figure 4C). However, both the WT and mutant 5′ UTR remained sensitive to eIF4E cap-binding domain inhibition (Figure 4C). These results suggest that the stem loops we identified are not responsible for the translation control of KRT5 upon treatment with PF-07293623.
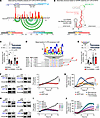 Figure 4
Basal keratins are translationally controlled and required for cell survival. (A and B) Cell-free SHAPE reactivity of the 5’ UTR of KRT5 from LuCaP 176 cells showing (A) base pairing probability and (B) Secondary structure. (C) KRT5 5′ UTR luciferase assay with stem-loop mutant (Δ41–69), normalized to luciferase mRNA, n = 11 or more. (D) Consensus motif identified within basal keratin 5’ UTRs by MEME Stream. (E) KRT5 5′ UTR luciferase assay with motif mutant (Δ6–15), normalized to luciferase mRNA, n = 8 or more. (F and G) Pooled keratin (siKRT pool) or nontarget control (siNT) knockdown, n = 3, showing (F), keratin protein expression (left) and growth curves (right), as well as (G) caspase-3 activity over time. (H–J) Individual keratin knockdown (siKRTs), n = 3, showing (H) keratin protein expression (I), growth curves, and (J) caspase-3 activity over time. Plots represent mean ± SEM. Significance was determined by 1-way ANOVA with Šidák’s multiple comparisons test in C, E; by one way ANOVA with Dunnett’s multiple comparisons test in G, I, and J; by Unpaired 2-tailed Student’s t test in F. *P < 0.05; **P < 0.01; ****P < 0.0001.
Given these findings, we next examined the 5′ UTR sequences of KRT2, 5, 6B, 9, 14, and 71 to identify regulatory motifs that could potentially mediate translational responsiveness to PF-07293623. Using MEME STREAM analysis, we identified a conserved 10 base cis-regulatory element, AGCCWCCAGC, selectively present in the 5′ UTRs of these keratins but absent in the 5′ UTRs of luminal keratins KRT8 and KRT18, suggesting basal lineage specificity (Figure 4D). This motif was also enriched in the 5′ UTRs of 42 of the top 50 transcripts downregulated upon cap-binding domain inhibition, with a total of 215 motif occurrences (Supplemental Figure 5B and Supplemental Table 3), suggesting a potential role in mediating translational sensitivity. To assess the functional significance of this cis-element, we generated a luciferase reporter construct harboring a 10-base deletion (positions 6–15) within the KRT5 5′ UTR, which we transduced into LuCaP 176 cells. This deletion resulted in a significant increase in luciferase activity, indicating that the motif acts as a translational repressor (Figure 4E). Furthermore, while the WT KRT5 5′ UTR was sensitive to PF-07293623, the mutant lacking the cis-element was unresponsive to PF-07293623 treatment, suggesting that the cis-regulatory motif is required for PF-07293623–mediated translational repression (Figure 4E). Together, these findings demonstrate that inhibition of the eIF4E cap-binding domain in AR-low CRPC selectively suppresses the translation of basal keratins, contributing to lineage plasticity through a conserved 10-base cis-regulatory element located within their 5′ UTRs.
While it is known that keratins can define lineage states, it is unknown if basal keratins themselves are required for survival of prostate cancer. This is an important question because basal keratins are functional targets of PF-07293623. To this end, we conducted a pooled knockdown of KRT 2, 5, 6B, and 9 and observed a significant decrease in cellular growth capacity, which was accompanied by a substantial increase in apoptosis (Figure 4, F and G). Next, we conducted individual knockdown of each of these basal keratins and found they were all essential for cell growth and survival (Figure 4, H–J). Thus, in AR-low prostate cancer, keratins are not only markers of the basal phenotype but required for cell survival.
Inhibition of the eIF4E cap binding induces lineage plasticity through BAP1 and OTUD3. Since inhibition of the eIF4E cap-binding domain reduces the basal phenotype in AR-low prostate cancer (Figure 3, B and F), we next asked whether this shift is accompanied by a corresponding gain in luminal identity. Given that AR expression is a defining marker of luminal prostate cells, we examined AR protein levels following treatment of LuCaP 176 cells with PF-07293623. Remarkably, inhibition of the eIF4E cap-binding domain led to a 5-fold increase in AR expression (Figure 5A). This increase was dose dependent and primarily observed in the nucleus, where AR functions as a transcription factor (Figure 5B and Supplemental Figure 6A). This finding indicates that inhibition of the eIF4E cap-binding domain drives aggressive basal prostate cancer cells toward a more luminal state. To determine whether the observed increase in AR protein was due to elevated AR transcript levels, we examined AR mRNA expression. Notably, the increase in AR protein did not correspond to any change in AR transcript levels, suggesting a posttranscriptional mechanism of regulation (Supplemental Figure 6B and Supplemental Table 2). Next, we analyzed protein synthesis rates of AR via HPG-TMT mass spectrometry. Consistent with AR mRNA expression, there was no difference in the levels of newly synthesized AR (Supplemental Figure 6C). At a functional level, PF-07293623 treatment enhanced AR chromatin occupancy at its canonical targets. AR CUT&RUN demonstrated increased AR binding at the transcription start sites of NKX3.1, HOXB13, and FKBP4, and ChIP-qPCR revealed increased AR occupancy at FKBP5, KLK3, and TMPRSS2 genomic loci (Figure 5C and Supplemental Figure 6D). Increased AR chromatin binding was accompanied by higher expression of KLK2, KLK3, NKX3.1, PMEPA1, and TMPRSS2 transcripts (Figure 5D). These findings suggest that PF-07293623 increases AR protein levels and initiates active AR signaling through a mechanism independent of transcriptional or translational control.
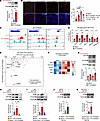 Figure 5
Deubiquitinases OTUD3 and BAP1 prevent AR degradation upon eIF4E cap-binding domain inhibition. (A) Immunoblot of AR in LuCaP 176 cells treated with DMSO (vehicle) or PF07293623 (100 nM, 72 hours), n = 3. (B) AR Immunofluorescence images (left) and quantification (right) in LuCaP 176 cells treated with DMSO or PF07293623 (100 nM, 1 μM) or R1881 (10 nM), n = 6 or more. Scale bar: 200 μm. (C) Representative CUT&RUN peaks showing AR binding, n = 3. (D) qRT-PCR analysis of AR target genes in LuCaP 176 cells. (E) Scatter plot of candidates from HPGTMT mass spectrometry and AR CRISPRi screen. Significant overlapping positive AR regulators shown in red. (F) Heatmap showing HPG-TMT expression intensity of candidate AR regulators. (G) BAP1 and OTUD3 immunoblots upon PF07293623 treatment (100 nM). (H–K) Representative immunoblot (top) and quantification (bottom) of AR in LuCaP 176 cells treated with PF07293623 (100 nM) and transfected with nontargeting siRNA (siNT) or (H) siBAP1, (I) siOTUD3, (J) siBAP1 and MG132 (10 μM, 6 hours), (K) siOTUD3 and MG132. Plots represent mean ± SEM. Significance was determined by unpaired 2-tailed Student’s t test in A, D, G, J, and K, n = 3; by 1-way ANOVA with Dunnett’s multiple comparisons test in B; by 1-way ANOVA with Holm-Šidák’s multiple comparisons test in H and I, n = 3. *P < 0.05; **P < 0.01; ***P < 0.001; ****P < 0.0001.
Given these findings, we performed canonical pathway enrichment analysis on the newly synthesized proteome sensitive to PF-07293623 (Figure 3B). Interestingly, posttranslational protein modification emerged as one of the most significantly enriched pathways in the upregulated but not the downregulated proteins (Supplemental Figure 6, E and F). To further narrow down functional posttranslational regulators of AR, we compared our upregulated proteins to a genome-scale CRISPRi screen for positive regulators of AR expression (Supplemental Figure 6G) (44). Analyzing the intersection of these datasets, we identified 36 proteins that, when inhibited by CRISPRi decreased AR levels suggesting they are necessary for AR expression (log2 fold change > 0.2 or < –0.2; P < 0.05) (Figure 5E and Supplemental Figure 6H). Notably, one of the top overlapping hits was FKBP4, a well-characterized regulator of AR stability and function supporting the robustness of this analysis (Figure 5E) (45). These findings suggest that a subset of upregulated proteins may be responsible for the increase in AR abundance upon eIF4E cap-binding domain inhibition.
At a mechanistic level, we focused on candidates that are known posttranslational modifiers and associated with prostate cancer or AR biology including, BRCA1-associated protein (BAP1), golgin subfamily A member 5 (GOLGA5), ovarian tumor domain–containing protein 3 (OTUD3), ubiquitin-like modifier activating enzyme 2 (UBA2), and von Hippel-Lindau-binding protein 1 (VBP1) (Figure 5F). BAP1 has been shown to suppress prostate cancer growth through deubiquitinating PTEN (46). GOLGA5 is an endosomal and vesicular transport protein that binds to the N-terminus of AR (47). OTUD3 deubiquitinates PTEN and YY1, both of which directly interact with AR (48, 49); UBA2 is an E1 SUMO-1 activating enzyme that conjugates with UBC9 to SUMOylate AR (50, 51). VBP1 is a component of the VHL-Elongin B/C E3 ligase complex that also deubiquitinates AR (52). To validate if these proteins are upregulated in the context of PF-07293623 treatment, we conducted Western blot analysis. Among this group, the steady-state protein levels of 2 candidates, BAP1 and OTUD3, increased upon cap-binding domain inhibition without any changes at the mRNA level (Figure 5G and Supplemental Figure 6, I and J). Both proteins are deubiquitinases, but it is unknown if they are necessary for AR protein stability. To this end, we knocked down BAP1 or OTUD3 with and without eIF4E cap-binding domain inhibition. We found that knockdown of BAP1 or OTUD3 prevented the up regulation of AR in response to PF-07293623 treatment (Figure 5, H and I), which could be rescued by the proteasome inhibitor MG-132 (Figure 5, J and K). These findings demonstrate that BAP1 and OTUD3 contribute to AR protein stabilization in response to eIF4E cap-binding domain inhibition.
eIF4E expression is associated with a basal phenotype and worse outcomes in patients with advanced prostate cancer. Given our mechanistic evidence that eIF4E drives lineage plasticity in CRPC, we next sought to determine if eIF4E mRNA levels associate with lineage features in patients. To this end, we analyzed data from the SU2C East Coast Dream Team (ECDT) composed of metastatic biopsies from patients with CRPC focusing on individuals who previously received an ARPI (n = 80) (53). Patients with tumors were stratified by low (below 25th percentile, n = 14) or high (all remaining patients, n = 66) expression of eIF4E in the SU2C cohort (Supplemental Figure 7A). We found that tumors with high eIF4E expression exhibited lower luminal scores and a trend towards higher basal scores, indicating that elevated eIF4E is associated with a basal-like, less luminal phenotype (Figure 6, A and B) (54). Importantly, patients with high eIF4E levels developed resistance to ARPIs including abiraterone, enzalutamide, or apalutamide, more rapidly than those with low eIF4E expression, supporting a potential role for eIF4E in driving therapy resistance in CRPC (Figure 6C). In addition, high eIF4E expression was associated with reduced overall survival (OS) (Figure 6, D and E). Univariate analysis of clinical features revealed a significant association between eIF4E expression and shorter time on ARPI, as well as reduced OS from initiation of first line ARPI (Supplemental Figure 7, B–D). Prior chemotherapy was also associated with reduced OS from first biopsy. In multivariate analysis of clinical features with P < 0.1 in the univariate analysis, both eIF4E expression and prior chemotherapy remained significantly associated with shorter time on ARPI and reduced OS from first line ARPI and from first biopsy (Supplemental Figure 7, B–D). These findings collectively suggest that high eIF4E expression is associated with a more basal-like molecular phenotype and represents a significant variable corresponding to a more aggressive and therapy-resistant disease state. Additionally, these findings highlight the therapeutic potential of targeting the eIF4E cap-binding domain in advanced prostate cancer with a basal phenotype to promote lineage plasticity toward a more luminal state, potentially reversing resistance and enhancing responsiveness to AR-targeted therapies.
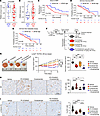 Figure 6
Cap binding domain of eIF4E drives lineage plasticity and restores sensitivity to ARPIs. (A–E) SU2C mCRPC patients stratified by eIF4E expression, n = 80: (A) Luminal A PAM50 scores, (B) Basal PAM50 scores, (C) Progression-free survival on ARPI, (D) OS from first-line ARPI, (E) OS from metastatic biopsy. (F) Preclinical trial schematic. (G) Representative LuCaP 176 PDX tumors (left), tumor growth curves (middle), and endpoint tumor volumes (right). n = 6 or more mice per group. (H and I) Representative IHC staining and quantification of 176 PDX tumor for (H) AR and (I) phospho-histone H3. Plots represent mean ± SEM. Significance was determined by Wilcoxon rank-sum tests in A and B; log-rank tests in C–E; by Brown-Forsythe and Welch ANOVA with Dunnett’s T3 multiple comparison tests in G; by 1-way ANOVA with Šidák’s multiple comparison tests in H and I. *P < 0.05; **P < 0.01; ***P < 0.001; ****P < 0.0001.
eIF4E cap-binding domain inhibition drives lineage plasticity and sensitization to enzalutamide in vivo. Our patient-based and mechanistic data demonstrate that eIF4E correlates with and drives basal-to-luminal lineage plasticity. This raises the important question, can inhibition of the eIF4E cap-binding domain induce a lineage switch to sensitize AR-low, basal prostate cancers to ARPIs. To address this, we employed the LuCaP 176 PDX model (Figure 1L). Mice were randomized to receive vehicle, PF-07293623 (50 mg/kg, orally, twice daily), the ARPI enzalutamide (10 mg/kg, orally, daily), or a combination of PF-07293623 and enzalutamide (50 mg/kg and 10 mg/kg, respectively) (Figure 6F). As expected, the LuCaP 176 PDX was insensitive to enzalutamide (Figure 6G). However, combining PF-07293623 with enzalutamide led to tumor regression, which was not observed with either therapy alone (Figure 6G). Mice treated with PF-07293623 alone or in combination with enzalutamide showed no signs of toxicity (Supplemental Figure 7, E and F). In contrast, a subset of mice in the enzalutamide-only treatment group exhibited leukopenia, anemia, and thrombocytopenia, toxicities that have been reported in patients receiving enzalutamide (Supplemental Figure 7, E and F) (55). These results demonstrate that eIF4E cap-binding domain inhibition can sensitize resistant AR-low prostate cancer to enzalutamide.
To determine if PF-07293623 caused drug-induced lineage plasticity by converting AR-low LuCaP 176 tumors to a more luminal state, we assessed AR expression. Treatment with PF alone led to a significant increase in AR-positive cancer cells (Figure 6H). Moreover, the combination of enzalutamide and PF-07293623 resulted in higher AR protein abundance compared with enzalutamide alone, suggesting enhanced luminal features following eIF4E cap-binding domain inhibition (Figure 6H). Consistent with the 2D LuCaP 176 model, PF-0729362– treated LuCaP 176 tumors exhibited increased BAP1 and OTUD3 expression, deubiquitinases that may contribute to AR upregulation through protein stabilization (Figure 5G, Supplemental Figure 7G). Next, we sought to determine the cellular mechanisms underlying the reduction in tumor growth observed with PF-07293623 treatment. Phospho-histone H3 (pHH3) staining revealed decreased proliferative activity in tumors treated with enzalutamide, PF-07293623, and the combination. However, the most profound decrease in proliferation was observed in tumors treated with PF-07293623 and enzalutamide (Figure 6I). Additionally, PF07293623-treated tumors exhibited increased cellular apoptosis, supporting its role in promoting programmed cell death (Supplemental Figure 7H). Of note, no difference in necrosis was observed (Supplemental Figure 7I). Together, these data demonstrate that eIF4E cap-binding domain inhibition promotes lineage plasticity in AR-low basal prostate cancer in vivo, shifting it toward a luminal phenotype characterized by increased AR protein levels and enhanced sensitivity to an AR-targeted therapy.


Copyright © 2026 American Society for Clinical Investigation
ISSN: 0021-9738 (print), 1558-8238 (online)