
Advertisement
Research ArticleEndocrinologyMetabolismReproductive biology
Open Access |  10.1172/JCI197311
Insulin resistance is associated with mammary mitochondrial dysfunction at the onset of human lactation
Xin Meng,1 Taha Elajnaf,1 Hussam Rostom,1 Michelle Ma,1 Annalee Furst,2 Bryony R. Davies,1 Isabella R. Honess,1 Gaurav Pandey,2 Isadora C. Furigo,3 Craig L. Doig,4 Jayne F. Martin Carli,5 Rajesh V. Thakker,6,7,8 Lars Bode,2 Kelsey E. Johnson,9 and Fadil M. Hannan1
1Larsson-Rosenquist Foundation Oxford Centre for the Endocrinology of Human Lactation (LRF-OCEHL), Nuffield Department of Women’s & Reproductive Health, University of Oxford, Oxford, United Kingdom.
2Department of Pediatrics, Larsson-Rosenquist Foundation Mother-Milk-Infant Center of Research Excellence (MOMI CORE), and the Human Milk Institute (HMI), UCSD, La Jolla, California, USA.
3Center for Discoveries in Life Sciences (DLS), Coventry University, Coventry, United Kingdom.
4Centre for Systems Health and integrated Metabolic Research (SHiMR), Department of Biosciences, School of Science and Technology, Nottingham Trent University, Nottingham, United Kingdom.
5Department of Obstetrics and Gynecology, Division of Reproductive Sciences, University of Colorado Anschutz Medical Campus, Aurora, Colorado, USA.
6Academic Endocrine Unit, Radcliffe Department of Medicine, Oxford Centre for Diabetes, Endocrinology and Metabolism (OCDEM), University of Oxford, Oxford, United Kingdom.
7National Institute for Health Research Oxford Biomedical Research Centre, Oxford, United Kingdom.
8Centre for Endocrinology, William Harvey Research Institute, Barts and the London School of Medicine, Queen Mary University of London, London, United Kingdom.
9Center for Genetic Epidemiology, Keck School of Medicine, University of Southern California, Los Angeles, California, USA.
Address correspondence to: Fadil M. Hannan, Nuffield Department of Women’s & Reproductive Health, University of Oxford, Level 3, Women’s Centre, John Radcliffe Hospital, Headley Way, Headington, Oxford OX3 9DU, United Kingdom. Email: fadil.hannan@wrh.ox.ac.uk.
Authorship note: XM, TE, and HR contributed equally to this work.
Find articles by Meng, X. in: PubMed | Google Scholar
1Larsson-Rosenquist Foundation Oxford Centre for the Endocrinology of Human Lactation (LRF-OCEHL), Nuffield Department of Women’s & Reproductive Health, University of Oxford, Oxford, United Kingdom.
2Department of Pediatrics, Larsson-Rosenquist Foundation Mother-Milk-Infant Center of Research Excellence (MOMI CORE), and the Human Milk Institute (HMI), UCSD, La Jolla, California, USA.
3Center for Discoveries in Life Sciences (DLS), Coventry University, Coventry, United Kingdom.
4Centre for Systems Health and integrated Metabolic Research (SHiMR), Department of Biosciences, School of Science and Technology, Nottingham Trent University, Nottingham, United Kingdom.
5Department of Obstetrics and Gynecology, Division of Reproductive Sciences, University of Colorado Anschutz Medical Campus, Aurora, Colorado, USA.
6Academic Endocrine Unit, Radcliffe Department of Medicine, Oxford Centre for Diabetes, Endocrinology and Metabolism (OCDEM), University of Oxford, Oxford, United Kingdom.
7National Institute for Health Research Oxford Biomedical Research Centre, Oxford, United Kingdom.
8Centre for Endocrinology, William Harvey Research Institute, Barts and the London School of Medicine, Queen Mary University of London, London, United Kingdom.
9Center for Genetic Epidemiology, Keck School of Medicine, University of Southern California, Los Angeles, California, USA.
Address correspondence to: Fadil M. Hannan, Nuffield Department of Women’s & Reproductive Health, University of Oxford, Level 3, Women’s Centre, John Radcliffe Hospital, Headley Way, Headington, Oxford OX3 9DU, United Kingdom. Email: fadil.hannan@wrh.ox.ac.uk.
Authorship note: XM, TE, and HR contributed equally to this work.
Find articles by Elajnaf, T. in: PubMed | Google Scholar
1Larsson-Rosenquist Foundation Oxford Centre for the Endocrinology of Human Lactation (LRF-OCEHL), Nuffield Department of Women’s & Reproductive Health, University of Oxford, Oxford, United Kingdom.
2Department of Pediatrics, Larsson-Rosenquist Foundation Mother-Milk-Infant Center of Research Excellence (MOMI CORE), and the Human Milk Institute (HMI), UCSD, La Jolla, California, USA.
3Center for Discoveries in Life Sciences (DLS), Coventry University, Coventry, United Kingdom.
4Centre for Systems Health and integrated Metabolic Research (SHiMR), Department of Biosciences, School of Science and Technology, Nottingham Trent University, Nottingham, United Kingdom.
5Department of Obstetrics and Gynecology, Division of Reproductive Sciences, University of Colorado Anschutz Medical Campus, Aurora, Colorado, USA.
6Academic Endocrine Unit, Radcliffe Department of Medicine, Oxford Centre for Diabetes, Endocrinology and Metabolism (OCDEM), University of Oxford, Oxford, United Kingdom.
7National Institute for Health Research Oxford Biomedical Research Centre, Oxford, United Kingdom.
8Centre for Endocrinology, William Harvey Research Institute, Barts and the London School of Medicine, Queen Mary University of London, London, United Kingdom.
9Center for Genetic Epidemiology, Keck School of Medicine, University of Southern California, Los Angeles, California, USA.
Address correspondence to: Fadil M. Hannan, Nuffield Department of Women’s & Reproductive Health, University of Oxford, Level 3, Women’s Centre, John Radcliffe Hospital, Headley Way, Headington, Oxford OX3 9DU, United Kingdom. Email: fadil.hannan@wrh.ox.ac.uk.
Authorship note: XM, TE, and HR contributed equally to this work.
Find articles by Rostom, H. in: PubMed | Google Scholar
1Larsson-Rosenquist Foundation Oxford Centre for the Endocrinology of Human Lactation (LRF-OCEHL), Nuffield Department of Women’s & Reproductive Health, University of Oxford, Oxford, United Kingdom.
2Department of Pediatrics, Larsson-Rosenquist Foundation Mother-Milk-Infant Center of Research Excellence (MOMI CORE), and the Human Milk Institute (HMI), UCSD, La Jolla, California, USA.
3Center for Discoveries in Life Sciences (DLS), Coventry University, Coventry, United Kingdom.
4Centre for Systems Health and integrated Metabolic Research (SHiMR), Department of Biosciences, School of Science and Technology, Nottingham Trent University, Nottingham, United Kingdom.
5Department of Obstetrics and Gynecology, Division of Reproductive Sciences, University of Colorado Anschutz Medical Campus, Aurora, Colorado, USA.
6Academic Endocrine Unit, Radcliffe Department of Medicine, Oxford Centre for Diabetes, Endocrinology and Metabolism (OCDEM), University of Oxford, Oxford, United Kingdom.
7National Institute for Health Research Oxford Biomedical Research Centre, Oxford, United Kingdom.
8Centre for Endocrinology, William Harvey Research Institute, Barts and the London School of Medicine, Queen Mary University of London, London, United Kingdom.
9Center for Genetic Epidemiology, Keck School of Medicine, University of Southern California, Los Angeles, California, USA.
Address correspondence to: Fadil M. Hannan, Nuffield Department of Women’s & Reproductive Health, University of Oxford, Level 3, Women’s Centre, John Radcliffe Hospital, Headley Way, Headington, Oxford OX3 9DU, United Kingdom. Email: fadil.hannan@wrh.ox.ac.uk.
Authorship note: XM, TE, and HR contributed equally to this work.
Find articles by Ma, M. in: PubMed | Google Scholar
1Larsson-Rosenquist Foundation Oxford Centre for the Endocrinology of Human Lactation (LRF-OCEHL), Nuffield Department of Women’s & Reproductive Health, University of Oxford, Oxford, United Kingdom.
2Department of Pediatrics, Larsson-Rosenquist Foundation Mother-Milk-Infant Center of Research Excellence (MOMI CORE), and the Human Milk Institute (HMI), UCSD, La Jolla, California, USA.
3Center for Discoveries in Life Sciences (DLS), Coventry University, Coventry, United Kingdom.
4Centre for Systems Health and integrated Metabolic Research (SHiMR), Department of Biosciences, School of Science and Technology, Nottingham Trent University, Nottingham, United Kingdom.
5Department of Obstetrics and Gynecology, Division of Reproductive Sciences, University of Colorado Anschutz Medical Campus, Aurora, Colorado, USA.
6Academic Endocrine Unit, Radcliffe Department of Medicine, Oxford Centre for Diabetes, Endocrinology and Metabolism (OCDEM), University of Oxford, Oxford, United Kingdom.
7National Institute for Health Research Oxford Biomedical Research Centre, Oxford, United Kingdom.
8Centre for Endocrinology, William Harvey Research Institute, Barts and the London School of Medicine, Queen Mary University of London, London, United Kingdom.
9Center for Genetic Epidemiology, Keck School of Medicine, University of Southern California, Los Angeles, California, USA.
Address correspondence to: Fadil M. Hannan, Nuffield Department of Women’s & Reproductive Health, University of Oxford, Level 3, Women’s Centre, John Radcliffe Hospital, Headley Way, Headington, Oxford OX3 9DU, United Kingdom. Email: fadil.hannan@wrh.ox.ac.uk.
Authorship note: XM, TE, and HR contributed equally to this work.
Find articles by Furst, A. in: PubMed | Google Scholar
1Larsson-Rosenquist Foundation Oxford Centre for the Endocrinology of Human Lactation (LRF-OCEHL), Nuffield Department of Women’s & Reproductive Health, University of Oxford, Oxford, United Kingdom.
2Department of Pediatrics, Larsson-Rosenquist Foundation Mother-Milk-Infant Center of Research Excellence (MOMI CORE), and the Human Milk Institute (HMI), UCSD, La Jolla, California, USA.
3Center for Discoveries in Life Sciences (DLS), Coventry University, Coventry, United Kingdom.
4Centre for Systems Health and integrated Metabolic Research (SHiMR), Department of Biosciences, School of Science and Technology, Nottingham Trent University, Nottingham, United Kingdom.
5Department of Obstetrics and Gynecology, Division of Reproductive Sciences, University of Colorado Anschutz Medical Campus, Aurora, Colorado, USA.
6Academic Endocrine Unit, Radcliffe Department of Medicine, Oxford Centre for Diabetes, Endocrinology and Metabolism (OCDEM), University of Oxford, Oxford, United Kingdom.
7National Institute for Health Research Oxford Biomedical Research Centre, Oxford, United Kingdom.
8Centre for Endocrinology, William Harvey Research Institute, Barts and the London School of Medicine, Queen Mary University of London, London, United Kingdom.
9Center for Genetic Epidemiology, Keck School of Medicine, University of Southern California, Los Angeles, California, USA.
Address correspondence to: Fadil M. Hannan, Nuffield Department of Women’s & Reproductive Health, University of Oxford, Level 3, Women’s Centre, John Radcliffe Hospital, Headley Way, Headington, Oxford OX3 9DU, United Kingdom. Email: fadil.hannan@wrh.ox.ac.uk.
Authorship note: XM, TE, and HR contributed equally to this work.
Find articles by Davies, B. in: PubMed | Google Scholar
1Larsson-Rosenquist Foundation Oxford Centre for the Endocrinology of Human Lactation (LRF-OCEHL), Nuffield Department of Women’s & Reproductive Health, University of Oxford, Oxford, United Kingdom.
2Department of Pediatrics, Larsson-Rosenquist Foundation Mother-Milk-Infant Center of Research Excellence (MOMI CORE), and the Human Milk Institute (HMI), UCSD, La Jolla, California, USA.
3Center for Discoveries in Life Sciences (DLS), Coventry University, Coventry, United Kingdom.
4Centre for Systems Health and integrated Metabolic Research (SHiMR), Department of Biosciences, School of Science and Technology, Nottingham Trent University, Nottingham, United Kingdom.
5Department of Obstetrics and Gynecology, Division of Reproductive Sciences, University of Colorado Anschutz Medical Campus, Aurora, Colorado, USA.
6Academic Endocrine Unit, Radcliffe Department of Medicine, Oxford Centre for Diabetes, Endocrinology and Metabolism (OCDEM), University of Oxford, Oxford, United Kingdom.
7National Institute for Health Research Oxford Biomedical Research Centre, Oxford, United Kingdom.
8Centre for Endocrinology, William Harvey Research Institute, Barts and the London School of Medicine, Queen Mary University of London, London, United Kingdom.
9Center for Genetic Epidemiology, Keck School of Medicine, University of Southern California, Los Angeles, California, USA.
Address correspondence to: Fadil M. Hannan, Nuffield Department of Women’s & Reproductive Health, University of Oxford, Level 3, Women’s Centre, John Radcliffe Hospital, Headley Way, Headington, Oxford OX3 9DU, United Kingdom. Email: fadil.hannan@wrh.ox.ac.uk.
Authorship note: XM, TE, and HR contributed equally to this work.
Find articles by Honess, I. in: PubMed | Google Scholar
1Larsson-Rosenquist Foundation Oxford Centre for the Endocrinology of Human Lactation (LRF-OCEHL), Nuffield Department of Women’s & Reproductive Health, University of Oxford, Oxford, United Kingdom.
2Department of Pediatrics, Larsson-Rosenquist Foundation Mother-Milk-Infant Center of Research Excellence (MOMI CORE), and the Human Milk Institute (HMI), UCSD, La Jolla, California, USA.
3Center for Discoveries in Life Sciences (DLS), Coventry University, Coventry, United Kingdom.
4Centre for Systems Health and integrated Metabolic Research (SHiMR), Department of Biosciences, School of Science and Technology, Nottingham Trent University, Nottingham, United Kingdom.
5Department of Obstetrics and Gynecology, Division of Reproductive Sciences, University of Colorado Anschutz Medical Campus, Aurora, Colorado, USA.
6Academic Endocrine Unit, Radcliffe Department of Medicine, Oxford Centre for Diabetes, Endocrinology and Metabolism (OCDEM), University of Oxford, Oxford, United Kingdom.
7National Institute for Health Research Oxford Biomedical Research Centre, Oxford, United Kingdom.
8Centre for Endocrinology, William Harvey Research Institute, Barts and the London School of Medicine, Queen Mary University of London, London, United Kingdom.
9Center for Genetic Epidemiology, Keck School of Medicine, University of Southern California, Los Angeles, California, USA.
Address correspondence to: Fadil M. Hannan, Nuffield Department of Women’s & Reproductive Health, University of Oxford, Level 3, Women’s Centre, John Radcliffe Hospital, Headley Way, Headington, Oxford OX3 9DU, United Kingdom. Email: fadil.hannan@wrh.ox.ac.uk.
Authorship note: XM, TE, and HR contributed equally to this work.
Find articles by Pandey, G. in: PubMed | Google Scholar
1Larsson-Rosenquist Foundation Oxford Centre for the Endocrinology of Human Lactation (LRF-OCEHL), Nuffield Department of Women’s & Reproductive Health, University of Oxford, Oxford, United Kingdom.
2Department of Pediatrics, Larsson-Rosenquist Foundation Mother-Milk-Infant Center of Research Excellence (MOMI CORE), and the Human Milk Institute (HMI), UCSD, La Jolla, California, USA.
3Center for Discoveries in Life Sciences (DLS), Coventry University, Coventry, United Kingdom.
4Centre for Systems Health and integrated Metabolic Research (SHiMR), Department of Biosciences, School of Science and Technology, Nottingham Trent University, Nottingham, United Kingdom.
5Department of Obstetrics and Gynecology, Division of Reproductive Sciences, University of Colorado Anschutz Medical Campus, Aurora, Colorado, USA.
6Academic Endocrine Unit, Radcliffe Department of Medicine, Oxford Centre for Diabetes, Endocrinology and Metabolism (OCDEM), University of Oxford, Oxford, United Kingdom.
7National Institute for Health Research Oxford Biomedical Research Centre, Oxford, United Kingdom.
8Centre for Endocrinology, William Harvey Research Institute, Barts and the London School of Medicine, Queen Mary University of London, London, United Kingdom.
9Center for Genetic Epidemiology, Keck School of Medicine, University of Southern California, Los Angeles, California, USA.
Address correspondence to: Fadil M. Hannan, Nuffield Department of Women’s & Reproductive Health, University of Oxford, Level 3, Women’s Centre, John Radcliffe Hospital, Headley Way, Headington, Oxford OX3 9DU, United Kingdom. Email: fadil.hannan@wrh.ox.ac.uk.
Authorship note: XM, TE, and HR contributed equally to this work.
Find articles by Furigo, I. in: PubMed | Google Scholar
1Larsson-Rosenquist Foundation Oxford Centre for the Endocrinology of Human Lactation (LRF-OCEHL), Nuffield Department of Women’s & Reproductive Health, University of Oxford, Oxford, United Kingdom.
2Department of Pediatrics, Larsson-Rosenquist Foundation Mother-Milk-Infant Center of Research Excellence (MOMI CORE), and the Human Milk Institute (HMI), UCSD, La Jolla, California, USA.
3Center for Discoveries in Life Sciences (DLS), Coventry University, Coventry, United Kingdom.
4Centre for Systems Health and integrated Metabolic Research (SHiMR), Department of Biosciences, School of Science and Technology, Nottingham Trent University, Nottingham, United Kingdom.
5Department of Obstetrics and Gynecology, Division of Reproductive Sciences, University of Colorado Anschutz Medical Campus, Aurora, Colorado, USA.
6Academic Endocrine Unit, Radcliffe Department of Medicine, Oxford Centre for Diabetes, Endocrinology and Metabolism (OCDEM), University of Oxford, Oxford, United Kingdom.
7National Institute for Health Research Oxford Biomedical Research Centre, Oxford, United Kingdom.
8Centre for Endocrinology, William Harvey Research Institute, Barts and the London School of Medicine, Queen Mary University of London, London, United Kingdom.
9Center for Genetic Epidemiology, Keck School of Medicine, University of Southern California, Los Angeles, California, USA.
Address correspondence to: Fadil M. Hannan, Nuffield Department of Women’s & Reproductive Health, University of Oxford, Level 3, Women’s Centre, John Radcliffe Hospital, Headley Way, Headington, Oxford OX3 9DU, United Kingdom. Email: fadil.hannan@wrh.ox.ac.uk.
Authorship note: XM, TE, and HR contributed equally to this work.
Find articles by Doig, C. in: PubMed | Google Scholar
1Larsson-Rosenquist Foundation Oxford Centre for the Endocrinology of Human Lactation (LRF-OCEHL), Nuffield Department of Women’s & Reproductive Health, University of Oxford, Oxford, United Kingdom.
2Department of Pediatrics, Larsson-Rosenquist Foundation Mother-Milk-Infant Center of Research Excellence (MOMI CORE), and the Human Milk Institute (HMI), UCSD, La Jolla, California, USA.
3Center for Discoveries in Life Sciences (DLS), Coventry University, Coventry, United Kingdom.
4Centre for Systems Health and integrated Metabolic Research (SHiMR), Department of Biosciences, School of Science and Technology, Nottingham Trent University, Nottingham, United Kingdom.
5Department of Obstetrics and Gynecology, Division of Reproductive Sciences, University of Colorado Anschutz Medical Campus, Aurora, Colorado, USA.
6Academic Endocrine Unit, Radcliffe Department of Medicine, Oxford Centre for Diabetes, Endocrinology and Metabolism (OCDEM), University of Oxford, Oxford, United Kingdom.
7National Institute for Health Research Oxford Biomedical Research Centre, Oxford, United Kingdom.
8Centre for Endocrinology, William Harvey Research Institute, Barts and the London School of Medicine, Queen Mary University of London, London, United Kingdom.
9Center for Genetic Epidemiology, Keck School of Medicine, University of Southern California, Los Angeles, California, USA.
Address correspondence to: Fadil M. Hannan, Nuffield Department of Women’s & Reproductive Health, University of Oxford, Level 3, Women’s Centre, John Radcliffe Hospital, Headley Way, Headington, Oxford OX3 9DU, United Kingdom. Email: fadil.hannan@wrh.ox.ac.uk.
Authorship note: XM, TE, and HR contributed equally to this work.
Find articles by Martin Carli, J. in: PubMed | Google Scholar
1Larsson-Rosenquist Foundation Oxford Centre for the Endocrinology of Human Lactation (LRF-OCEHL), Nuffield Department of Women’s & Reproductive Health, University of Oxford, Oxford, United Kingdom.
2Department of Pediatrics, Larsson-Rosenquist Foundation Mother-Milk-Infant Center of Research Excellence (MOMI CORE), and the Human Milk Institute (HMI), UCSD, La Jolla, California, USA.
3Center for Discoveries in Life Sciences (DLS), Coventry University, Coventry, United Kingdom.
4Centre for Systems Health and integrated Metabolic Research (SHiMR), Department of Biosciences, School of Science and Technology, Nottingham Trent University, Nottingham, United Kingdom.
5Department of Obstetrics and Gynecology, Division of Reproductive Sciences, University of Colorado Anschutz Medical Campus, Aurora, Colorado, USA.
6Academic Endocrine Unit, Radcliffe Department of Medicine, Oxford Centre for Diabetes, Endocrinology and Metabolism (OCDEM), University of Oxford, Oxford, United Kingdom.
7National Institute for Health Research Oxford Biomedical Research Centre, Oxford, United Kingdom.
8Centre for Endocrinology, William Harvey Research Institute, Barts and the London School of Medicine, Queen Mary University of London, London, United Kingdom.
9Center for Genetic Epidemiology, Keck School of Medicine, University of Southern California, Los Angeles, California, USA.
Address correspondence to: Fadil M. Hannan, Nuffield Department of Women’s & Reproductive Health, University of Oxford, Level 3, Women’s Centre, John Radcliffe Hospital, Headley Way, Headington, Oxford OX3 9DU, United Kingdom. Email: fadil.hannan@wrh.ox.ac.uk.
Authorship note: XM, TE, and HR contributed equally to this work.
Find articles by
Thakker, R.
in:
PubMed
|
Google Scholar
|

1Larsson-Rosenquist Foundation Oxford Centre for the Endocrinology of Human Lactation (LRF-OCEHL), Nuffield Department of Women’s & Reproductive Health, University of Oxford, Oxford, United Kingdom.
2Department of Pediatrics, Larsson-Rosenquist Foundation Mother-Milk-Infant Center of Research Excellence (MOMI CORE), and the Human Milk Institute (HMI), UCSD, La Jolla, California, USA.
3Center for Discoveries in Life Sciences (DLS), Coventry University, Coventry, United Kingdom.
4Centre for Systems Health and integrated Metabolic Research (SHiMR), Department of Biosciences, School of Science and Technology, Nottingham Trent University, Nottingham, United Kingdom.
5Department of Obstetrics and Gynecology, Division of Reproductive Sciences, University of Colorado Anschutz Medical Campus, Aurora, Colorado, USA.
6Academic Endocrine Unit, Radcliffe Department of Medicine, Oxford Centre for Diabetes, Endocrinology and Metabolism (OCDEM), University of Oxford, Oxford, United Kingdom.
7National Institute for Health Research Oxford Biomedical Research Centre, Oxford, United Kingdom.
8Centre for Endocrinology, William Harvey Research Institute, Barts and the London School of Medicine, Queen Mary University of London, London, United Kingdom.
9Center for Genetic Epidemiology, Keck School of Medicine, University of Southern California, Los Angeles, California, USA.
Address correspondence to: Fadil M. Hannan, Nuffield Department of Women’s & Reproductive Health, University of Oxford, Level 3, Women’s Centre, John Radcliffe Hospital, Headley Way, Headington, Oxford OX3 9DU, United Kingdom. Email: fadil.hannan@wrh.ox.ac.uk.
Authorship note: XM, TE, and HR contributed equally to this work.
Find articles by Bode, L. in: PubMed | Google Scholar
1Larsson-Rosenquist Foundation Oxford Centre for the Endocrinology of Human Lactation (LRF-OCEHL), Nuffield Department of Women’s & Reproductive Health, University of Oxford, Oxford, United Kingdom.
2Department of Pediatrics, Larsson-Rosenquist Foundation Mother-Milk-Infant Center of Research Excellence (MOMI CORE), and the Human Milk Institute (HMI), UCSD, La Jolla, California, USA.
3Center for Discoveries in Life Sciences (DLS), Coventry University, Coventry, United Kingdom.
4Centre for Systems Health and integrated Metabolic Research (SHiMR), Department of Biosciences, School of Science and Technology, Nottingham Trent University, Nottingham, United Kingdom.
5Department of Obstetrics and Gynecology, Division of Reproductive Sciences, University of Colorado Anschutz Medical Campus, Aurora, Colorado, USA.
6Academic Endocrine Unit, Radcliffe Department of Medicine, Oxford Centre for Diabetes, Endocrinology and Metabolism (OCDEM), University of Oxford, Oxford, United Kingdom.
7National Institute for Health Research Oxford Biomedical Research Centre, Oxford, United Kingdom.
8Centre for Endocrinology, William Harvey Research Institute, Barts and the London School of Medicine, Queen Mary University of London, London, United Kingdom.
9Center for Genetic Epidemiology, Keck School of Medicine, University of Southern California, Los Angeles, California, USA.
Address correspondence to: Fadil M. Hannan, Nuffield Department of Women’s & Reproductive Health, University of Oxford, Level 3, Women’s Centre, John Radcliffe Hospital, Headley Way, Headington, Oxford OX3 9DU, United Kingdom. Email: fadil.hannan@wrh.ox.ac.uk.
Authorship note: XM, TE, and HR contributed equally to this work.
Find articles by Johnson, K. in: PubMed | Google Scholar
1Larsson-Rosenquist Foundation Oxford Centre for the Endocrinology of Human Lactation (LRF-OCEHL), Nuffield Department of Women’s & Reproductive Health, University of Oxford, Oxford, United Kingdom.
2Department of Pediatrics, Larsson-Rosenquist Foundation Mother-Milk-Infant Center of Research Excellence (MOMI CORE), and the Human Milk Institute (HMI), UCSD, La Jolla, California, USA.
3Center for Discoveries in Life Sciences (DLS), Coventry University, Coventry, United Kingdom.
4Centre for Systems Health and integrated Metabolic Research (SHiMR), Department of Biosciences, School of Science and Technology, Nottingham Trent University, Nottingham, United Kingdom.
5Department of Obstetrics and Gynecology, Division of Reproductive Sciences, University of Colorado Anschutz Medical Campus, Aurora, Colorado, USA.
6Academic Endocrine Unit, Radcliffe Department of Medicine, Oxford Centre for Diabetes, Endocrinology and Metabolism (OCDEM), University of Oxford, Oxford, United Kingdom.
7National Institute for Health Research Oxford Biomedical Research Centre, Oxford, United Kingdom.
8Centre for Endocrinology, William Harvey Research Institute, Barts and the London School of Medicine, Queen Mary University of London, London, United Kingdom.
9Center for Genetic Epidemiology, Keck School of Medicine, University of Southern California, Los Angeles, California, USA.
Address correspondence to: Fadil M. Hannan, Nuffield Department of Women’s & Reproductive Health, University of Oxford, Level 3, Women’s Centre, John Radcliffe Hospital, Headley Way, Headington, Oxford OX3 9DU, United Kingdom. Email: fadil.hannan@wrh.ox.ac.uk.
Authorship note: XM, TE, and HR contributed equally to this work.
Find articles by Hannan, F. in: PubMed | Google Scholar
Published August 13, 2026 - More info
J Clin Invest. 2026;136(20):e197311. https://doi.org/10.1172/JCI197311.
© 2026 Meng et al. This work is licensed under the Creative Commons Attribution 4.0 International License. To view a copy of this license, visit http://creativecommons.org/licenses/by/4.0/.
Received: June 26, 2025; Accepted: August 11, 2026

Related article:
Abstract
Lactation insufficiency in postpartum women has been associated with obesity and insulin resistance, among other risk factors. Challenges related to translating findings from animal models of lactation and the limited ability to study pregnant and lactating women in clinical trials have impeded more detailed mechanistic understanding of this relationship. In this issue of the JCI, Meng et al. combined studies in human milk samples and in vitro mammary epithelial cell models from humans and rodents to provide compelling evidence that mitochondrial dysfunction mediates the link between insulin resistance and lactation insufficiency. Notably, they observed that chronic exposure to high levels of insulin led to mitochondrial fragmentation and loss of volume in mouse mammary epithelial cells. This framework linking mitochondria, insulin signaling, and lactation should be extended to in vivo models and primary human tissues to better define the mechanisms supporting successful lactation.
Authors
Laura L. Hernandez
-
Results
Assessment of IR using the plasma leptin-to-adiponectin ratio. Seventy-five breastfeeding women with healthy term pregnancies were investigated at 36 weeks’ gestation and on 1 or more days during postpartum days 1–5 (18) (Figure 1A). Participants were categorized based on their nonfasting plasma leptin-to-adiponectin ratio (LAR) measured at 36 weeks’ gestation into tertiles of n = 25 designated as low (LAR ≤ 2 ng/μg), medium (LAR > 2 to ≤ 5 ng/μg), or high (LAR > 5 ng/μg) degree of IR (Supplemental Figure 1 and Supplemental Table 1; supplemental material available online with this article; https://doi.org/10.1172/JCI197311DS1). LAR is reported as an IR measure in nondiabetic individuals (19), and it was validated in an additional 20 breastfeeding women who provided postpartum fasting blood samples for homeostasis model assessment (HOMA) (Supplemental Figure 1) (20, 21). This showed significant correlations between LAR and HOMA measures (Supplemental Figure 1). Plasma LAR also correlated with BMI, assessed at 8–10 weeks’ gestation, and with glucose tolerance test values measured at 24–36 weeks’ gestation during the routine care of participants with GDM risk factors (Supplemental Figure 1). Plasma LAR was not associated with parity, comorbidities, pregnancy duration, delivery mode, infant birthweight, or the type of infant feeding (Table 1). However, participants were slightly younger in the high IR group (33.2 ± 0.9 years vs. 36.0 ± 0.8 years in the low IR group, P < 0.05, 1-way ANOVA) (Table 1).
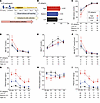 Figure 1
Association of IR with the timing of SA and circulating hormone concentrations. (A) Study protocol. (B) Timing of SA as assessed by participant daily self-reporting of breast fullness. *P < 0.05 compared with medium and low IR groups (χ2 test). (C–E) Milk concentrations of (C) lactose, (D) Na+, and (E) K+. (F) Milk Na+/K+ ratio. *P < 0.05, **P < 0.01 (2-way ANOVA). (G–I) Plasma concentrations of (G) leptin and (H) adiponectin and (I) leptin/adiponectin ratio (LAR). *P < 0.05, **P < 0.01, ***P < 0.001 (2-way ANOVA). All participants were stratified into low (black), medium (blue), or high IR (red) categories based on plasma LAR values. Sample sizes are shown below graphs in C–I. Day 1 samples were collected at 21 ± 1.0 hours postpartum, day 2 samples at 46 ± 1.0 hours postpartum, day 3 samples at 71 ± 1.0 hours postpartum, and day 4 samples at 96 ± 1.0 hours postpartum. No significant differences in sample collection time were observed between low, medium, and high IR groups (Kruskal-Wallis test). Red and blue asterisks represent P values for high vs. low IR group comparisons and medium vs. low IR group comparisons, respectively. D, postpartum day.
IR is associated with later onset of SA and neonatal weight loss. Daily assessments of postpartum increases in breast fullness, which indicates SA timing (10), showed that high IR participants had later onset of milk coming in (2.8 ± 0.1 days vs. 2.5 ± 0.1 days postpartum for the low IR group, P < 0.05, χ2 test) (Figure 1B). This was associated with increased neonatal weight loss during postpartum days 1–5 (–6.1% for high IR group vs. –2.7% for low IR group, P < 0.001, 1-way ANOVA) (Table 1).
The impact of IR on SA was further assessed using milk lactose and electrolyte measurements, as lactation onset is characterized by a rise in lactose together with decreasing Na+ and increasing K+ concentrations ≤72 hours postpartum (12). These changes in milk lactose and electrolytes, which are mediated by increasing MEC synthetic function and tight junction closure, respectively, are early indicators of SA and precede the increase in milk volume and breast fullness occurring in this period (12). The accuracy of milk lactose, Na+, and K+ measurements was assessed by spike and recovery and demonstrated 80%–111% recovery (Supplemental Table 2). High IR participants had lower milk lactose compared with the low IR group on postpartum day 1 (77 ± 18 mmol/L vs. 113 ± 17 mmol/L, P < 0.05, 2-way ANOVA) (Figure 1C). Moreover, milk Na+ was significantly elevated in the high IR group on postpartum day 1 (77 ± 14 mmol/L vs. 51 ± 7.8 mmol/L for the low IR group, P < 0.05, 2-way ANOVA), though no differences were observed in milk K+ between high and low IR groups (Figure 1, D and E). The milk Na+/K+ ratio, which is used as a SA biomarker (15, 22), was also significantly elevated in the high IR group on postpartum day 1 (5.3 ± 1.0 mmol/mmol vs. 3.3 ± 0.8 mmol/mmol for the low IR group, P < 0.05, 2-way ANOVA) but normalized thereafter (Figure 1F).
A longitudinal assessment of IR-related hormones showed that plasma leptin decreased in all participants postpartum, as reported (Figure 1G) (23). In contrast, plasma adiponectin showed no temporal change but was significantly lower in high IR participants at 36 weeks’ gestation and on postpartum day 1, whereas postpartum plasma LAR decreased in all groups, mirroring the leptin decrease (Figure 1, H and I). Serum nonfasted insulin was elevated in high IR participants at 36 weeks’ gestation but showed no significant postpartum change (Supplemental Figure 2). Furthermore, the later SA onset in high IR participants was not associated with alterations in serum progesterone or prolactin, which mediate lactation onset after childbirth (Supplemental Figure 2) (8, 13).
IR is associated with mammary transcriptome dysregulation during SA. To explore the underlying mechanisms of altered SA in insulin-resistant breastfeeding participants, we performed bulk RNA-seq on the MFG fraction from postpartum day 2–5 colostrum and milk samples donated by 71 participants (total of 106 samples) (Figure 2A and Supplemental Table 1) (15). MFG RNA quality was variable with RNA integrity number (RIN) values ranging 1.3–9.1 (Supplemental Figure 3). However, principal components analysis showed no clustering of MFG RNA-seq data according to RIN value (Supplemental Figure 3). Moreover, to account for any bias due to variable RNA quality, RIN values were used as covariates in all gene expression analyses. Samples from 19 to 37 participants (25%–49% of the cohort) were analyzed per postpartum day (Figure 2B and Supplemental Table 1).
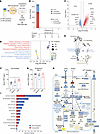 Figure 2
Association of IR with the MFG transcriptome during SA. (A) MFG RNA-seq protocol. TG, triglyceride; MEC, mammary epithelial cell. (B) Number of differentially expressed genes (DEGs) from high vs. low and medium vs. low IR groups on postpartum days 2–5. Day 2 samples were collected at 45 ± 1.5 hours postpartum, day 3 samples at 72 ± 1.3 hours postpartum, day 4 samples at 96 ± 1.2 hours postpartum, and day 5 samples at 120 ± 1.4 hours postpartum. No significant differences in sample collection time were observed between low, medium, and high IR groups (Kruskal-Wallis test). (C) Volcano plot showing upregulated (red) and downregulated (blue) genes from high vs. low IR groups on postpartum day 2. Horizontal and vertical dashed lines indicate meta-q = 0.05 and log2 expression fold-change = 0.5, respectively. (D) GSEA showing top upregulated (red) and downregulated (blue) processes from high vs. low IR groups on postpartum day 2. Circle size represents number of genes. Circle color represents FDR-adjusted P value (meta-q) obtained from fast GSEA (FGSEA) and single-sample GSEA (ssGSEA). (E) Inflammatory gene network upregulated in the high IR group on postpartum day 2. Network comprises nodes representing genes and edges representing functional gene interactions. Node size corresponds to number of connections to other nodes. (F and G) Serum C-reactive protein (CRP) measured at (F) 36 weeks’ gestation and (G) postpartum day 2 in low, medium, and high IR groups. *P < 0.05 (1-way ANOVA). (H) Schematic of lactating MEC showing processes altered in the high IR group on postpartum day 2. Upregulated (red) and downregulated (blue) genes and proteins are shown. Unaltered genes and proteins are shown in white. (I) Mitochondrial processes altered in the high IR group on postpartum day 2. Numbers of upregulated and downregulated genes are shown in red and blue, respectively.
MFG RNA-seq has been validated for assessing the lactating MEC transcriptome in different species (Supplemental Table 3), and a comparison with tissue expression profiles from the Genotype-Tissue Expression and Mouse Gene Atlas databases showed that the MFG transcriptomes exhibited the greatest similarity to human female mammary tissue and mouse lactating mammary gland (Supplemental Figure 4) (24, 25). IR did not affect total numbers of MFG transcripts, of which genes encoding milk proteins (LALBA, CSN2, CSN1S1, and LTF) were most abundant and comprised 30% of all transcripts (Supplemental Figure 4) (26). However, on postpartum day 2, 4,425 out of a total of 17,669 different transcripts (25%) were differentially expressed with a log2 fold-change ≥ 0.5 (meta-q < 0.05) when high IR (n = 4 participants) and low IR (n = 8 participants) groups were compared (Figure 2, B and C; Supplemental Figure 5; and Supplemental Table 4). Characteristics, such as maternal age, parity, BMI, delivery mode, timing of milk collection, or provision of breastfeeding support, did not differ between high and low IR groups on postpartum day 2 (Supplemental Table 5). However, high IR participants, whose MFG transcriptomes were assessed on postpartum day 2, reported later SA than low IR participants, and their infants had greater postpartum day 1–5 weight loss (Supplemental Table 5). A comparison of the medium (n = 7 participants) and low IR (n = 8 participants) groups on postpartum day 2 led to only 14 DEGs being detected, of which 13 overlapped with those identified in high IR participants (Figure 2B, Supplemental Figure 5, and Supplemental Table 6). No DEGs were detected on days 3–5 postpartum when comparing high, medium, and low IR groups, even when using a less stringent meta-q threshold of 0.1 (Figure 2B and Supplemental Tables 7–9). Thus, IR may affect lactation only during the colostrum stage (Figure 2, B and C). We assessed whether differences in BMI contributed to the differential gene expression observed between high and low IR groups. None of the 19 participants, whose MFG transcriptomes were assessed on postpartum day 2, were obese (Supplemental Table 5), but a comparison of participants with BMI > 25 kg/m2 (range 25.3–28.6 kg/m2, n = 6) and those with BMI < 25 kg/m2 (range 19.0–24.6 kg/m2, n = 13) yielded only 43 DEGs on postpartum day 2, of which 40 were also identified in the high IR group (Supplemental Figure 5 and Supplemental Table 10).
Genes with the greatest differential expression on postpartum day 2 showed significant correlation between their expression and third-trimester plasma LAR values (Supplemental Figure 6). The top upregulated genes included inflammatory components, such as CXCL8 (16-fold increase, meta-q = 3.3 × 10⁻⁵), while genes encoding mitochondrial proteins, such as ARG2 (4.7-fold decrease, meta-q = 4.7 × 10⁻¹²), were among the most downregulated (Figure 2C and Supplemental Figure 6). However, expression of these genes on postpartum days 3–5 generally showed no correlation with third-trimester plasma LAR values (Supplemental Table 11).
Gene set enrichment analysis (GSEA) demonstrated that pro-inflammatory processes were most highly upregulated in the high IR group (Figure 2D). Upregulated inflammatory genes were involved in biological processes ranging from TGF-β signaling to apoptosis (Figure 2E). This pro-inflammatory gene signature may be due to a high abundance of immune cells within the colostrum MFG fraction (15). We assessed this by flow cytometry and demonstrated that <5% of cells within the MFG fraction were of immune origin (CD45+), while >95% were nonimmune cells (CD45–), most likely from the mammary epithelium (Supplemental Figure 7). There was no association between LAR and the number of cells within the MFG fraction (Supplemental Figure 7).
Consistent with IR being associated with systemic inflammation (27), participants in the high IR group whose MFG transcriptomes were assessed on postpartum day 2 had higher third-trimester serum C-reactive protein (CRP) concentrations (7.7 ± 1.8 mg/L) than the low IR group (1.9 ± 0.4 mg/L, P < 0.05, Kruskal-Wallis test) (Figure 2F). All participants, irrespective of IR group, had elevated CRP on postpartum day 2, likely due to parturition-associated acute inflammation (Figure 2G) (28). To determine whether systemic inflammation may have contributed to the altered mammary gene expression on postpartum day 2, we grouped participants into tertiles according to their third-trimester CRP values (Supplemental Figure 8 and Supplemental Table 12). A comparison of postpartum day 2 MFG transcriptomes from participants in the low (CRP, 0.47–1.2 mg/L, n = 5) and high (CRP, 4.5–11.1 mg/L, n = 5) tertiles revealed 67 DEGs (Supplemental Figure 8 and Supplemental Table 13). This represented <2% of the 4,425 DEGs observed in high IR participants, indicating that inflammation alone is unlikely to account for the widespread early-postpartum altered mammary gene expression.
Protein synthesis and branched chain amino acid catabolism were the most downregulated processes in high IR participants (Figure 2D). Expression of the signaling gene, JAK2, which can be activated in insulin-resistant states (29), was increased in high IR participants (Figure 2H). IR was associated with lower expression of mammary insulin signaling genes (INSR, IRS1, AKT1), which promote metabolic processes supporting lactation, such as glucose uptake and lipid synthesis (30), and genes encoding the mTOR complex 1, which probably increase lactating MEC protein translation, also showed lower expression (Figure 2H) (31). Moreover, high IR participants had lower expression of genes coordinating milk synthesis, such as STAT5A, a prolactin signaling component, and mammary alveologenesis transcription factors (EHF, ELF5, GATA3), (Figure 2H and Supplemental Figure 6) (13, 32–34). Genes involved in de novo fatty acid synthesis (SREBF1, FASN) and the biogenesis and secretion of MFGs into milk (PLIN3, CIDEA, XDH, MUC1) also showed lower expression (Figure 2H and Supplemental Figure 6) (35–38). Furthermore, IR affected mammary protein synthesis with lower expression of ribosomal and casein genes (CSN2, CSN3) (Figure 2H). The B4GALT1 lactose synthase subunit was also downregulated and probably contributed to the low milk lactose concentrations in high IR participants (Figure 1C and Figure 2H). In addition, expression of genes involved in parathyroid hormone–related peptide-mediated Ca2+ mobilization from the maternal skeleton (PTHLH), influx of circulating Ca2+ via store-operated Ca2+ channels into MECs (ORAI1), and Ca2+ efflux from MECs into milk (NHERF1) were decreased in the high IR group (Figure 2H) (39–42). Finally, genes encoding tight junction proteins (TJP2, TJP3, CLDN8) were downregulated (Figure 2H), which may explain the increased milk Na+ and milk Na+/K+ ratio in high IR participants (Figure 1, D and F).
IR was also associated with 266 nuclear encoded mitochondrial DEGs (Figure 2, H and I). To ascertain which mitochondrial processes are altered in high IR participants, DEGs were categorized according to MitoCarta3.0 pathway annotations (Supplemental Table 14) (43). This revealed downregulation of genes involved in oxidative phosphorylation (OXPHOS), mitochondrial nutrient metabolism, mitochondrial protein import, and mitochondrial genome transcription and translation (Figure 2I). In contrast, genes encoding mitochondrial proteins promoting cellular apoptosis were upregulated (Figure 2I). These findings were suggestive of IR-mediated mammary mitochondrial dysfunction. To determine if this was a consequence of defective insulin action, we proceeded to assess the effect of insulin in cultured MECs.
Influence of insulin and the Akt signaling protein on the cultured human MEC transcriptome. The human MCF-12A mammary cell line, which expresses β-casein in the presence of prolactin, insulin, and glucocorticoids, was used for these studies (44). RT-qPCR analysis demonstrated that MCF-12A cells express β-casein (CSN2), INSR, and AKT1, which encodes the Akt signaling protein (Supplemental Figure 9) (30, 45).
Cells were treated with 0, 10, or 100 nM insulin followed by bulk RNA-seq at 0, 1, 4, and 8 hours (Figure 3A). Insulin altered the MCF-12A cell transcriptome in a dose- and time-dependent manner (Figure 3B and Supplemental Figure 10). The effects of insulin peaked at 4 hours posttreatment where out of 17,708 transcripts, 4,571 (26%) and 5,207 (29%) were significantly altered with a log2 fold-change ≥ 0.5 (meta-q < 0.05) by 10 nM and 100 nM insulin, respectively (Figure 3B, Supplemental Figure 10, and Supplemental Tables 15 and 16). Insulin upregulated genes involved in lactation, including prolactin signaling (SOCS2) (46), secretory differentiation and SA (HIF1A) (47), tight junction formation and closure (TJP2, TJP3, CLDN8) (48), lipid droplet biogenesis (XDH, CIDEA, PLIN3) (38, 49), and calcium mobilization and transport (PTHLH, ORAI1) (Supplemental Tables 15 and 16) (40). The 10 and 100 nM insulin doses had concordant effects on gene expression (r = 0.97; P < 0.0001), with 4,029 out of 5,745 transcripts (70%) induced by both insulin doses being similarly altered (Figure 3C and Supplemental Figure 11).
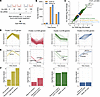 Figure 3
Effect of insulin on the MCF-12A cell transcriptome. (A) RNA-seq protocol. (B) Number of DEGs at 1, 4, and 8 hours following 10 nM and 100 nM insulin (n = 3–5 biological replicates). (C) Expression fold-change correlation between DEGs from 10 nM and 100 nM insulin treatments. (D) Time-series analysis of 4 gene clusters characterized by transient increase (yellow), transient decrease (red), gradual decrease (green), or gradual increase (blue) in expression following 100 nM insulin treatment. Black dashed lines indicate mean expression. (E) Examples of temporal expression trajectories. (F) Most significantly enriched Gene Ontology terms in each cluster.
Dynamic changes in the MCF-12A cell transcriptional response to 100 nM insulin were also assessed using time-series clustering of gene expression (TMixClust) (50). Silhouette analysis identified 2 major temporal patterns characterized by peak expression changes occurring with either 4 hours (cluster 1: transient increase, n = 70 genes; and cluster 2: transient decrease, n = 505 genes) or 8 hours of insulin treatment (cluster 3: gradual decrease, n = 69 genes; and cluster 4: gradual increase, n = 442 genes) (Figure 3D, Supplemental Figure 10, and Supplemental Table 17). Clusters 1 and 2 included lactation genes, such as SOCS2, PTHLH, and GATA3, whereas clusters 3 and 4 contained insulin signaling genes (IRS2, FOS) and mitochondrial genes (MSTO1, MPV17L) (Figure 3E and Supplemental Table 17). Gene Ontology analysis showed enrichment of genes with a transient change in expression (clusters 1 and 2) in ribosome biogenesis, cell-cell adhesion, and metal ion transport, whereas genes with a gradual change in expression (clusters 3 and 4) were enriched in the MAPK pathway, metabolic processes, and cell cycle (Figure 3F).
Next, we investigated the role of Akt in insulin-induced transcription by knocking down this signaling protein prior to 0 and 100 nM insulin treatment (Figure 4A). Administration of Akt-targeted siRNA decreased AKT1 RNA expression by 83% compared with use of nontargeted (scramble) siRNA (Supplemental Figure 9). Knockdown also decreased Akt protein by 60% and attenuated phosphorylated Akt (p-Akt) following 100 nM insulin for 30 minutes (Figure 4, B and C). Furthermore, Akt knockdown mitigated the transcriptional effects of insulin. In cells treated with 100 nM insulin for 4 hours, Akt knockdown decreased the number of DEGs from 5,204 to 2,779 (Figure 4D). We modeled the interaction between insulin and Akt on gene expression at 4 hours using DESeq2 (51). This identified 2,648 genes (51% of insulin-induced genes, log2 fold-change > 0.5 at adjusted P < 0.05) that were significantly altered by insulin in an Akt-dependent manner (Figure 4E and Supplemental Table 18). Out of the 2,648 genes, Akt knockdown attenuated the expression of 2,603 genes (98% of insulin-Akt dependent genes), while 45 genes showed enhanced expression (Figure 4E and Supplemental Table 18). The attenuated genes were involved in hormone signaling (NR3C1, SOCS2), secretory differentiation and SA (HIF1A), and lipid droplet biogenesis (XDH, PLIN2) (Supplemental Table 18). Biological pathway analysis showed an enrichment of insulin-induced genes involved in ribosome biogenesis and RNA processing, ER stress response, and ER-to-cytosol transport (Figure 4F). Mitochondrial biogenesis processes, such as structural organization and transfer RNA processing, were also enriched after insulin (Figure 4F). However, both protein synthesis and mitochondrial processes were no longer enriched after Akt knockdown (Figure 4F).
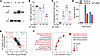 Figure 4
Effect of Akt knockdown on insulin-mediated differential gene expression. (A) Capillary protein electrophoresis blot showing phosphorylated and total Akt in MCF-12A cells following 30 minutes of 0, 10, or 100 nM insulin and 100 nM insulin with Akt-targeted siRNA treatments. (B and C) Quantitative analysis of (B) total Akt shown as percentage compared with control (0 nM insulin) and (C) p-Akt normalized to total Akt and shown as a fold-change compared with control (0 nM insulin). Data shown as mean ± SEM (n = 4–6 biological replicates). ***P < 0.001 and ****P < 0.0001 compared with untreated cells. ##P < 0.01 and ###P < 0.001 in cells treated with 100 nM insulin and Akt-targeted siRNA compared with cells treated with 100 nM insulin alone (1-way ANOVA). (D) Number of DEGs at 1, 4, and 8 hours following 100 nM insulin ± Akt-targeted siRNA. (E) Interaction analysis between Akt expression and 100 nM insulin at 4 hours. Scatterplot shows the relationship between the expression of insulin-induced DEGs that are attenuated (red dots) or enhanced (blue dots) by Akt knockdown. X axis shows log2 expression fold-change from 100 nM insulin alone, and the y axis shows the log2 expression fold-change from 100 nM insulin + Akt-targeted siRNA. (F) Top enriched biological processes following 100 nM insulin ± Akt-targeted siRNA treatment. Circle size represents number of genes involved per process. Processes no longer enriched after Akt knockdown are shown in red.
Influence of insulin on mitochondrial gene expression in cultured mammary cells. In MCF-12A cells, 100 nM insulin altered the expression of 259 genes encoding mitochondrial proteins (Figure 5A and Supplemental Table 19). These genes are involved in OXPHOS, mtDNA maintenance, import of nuclear encoded proteins, and mitochondrial lipid metabolism (Figure 5B). Akt knockdown affected insulin-mediated changes in the expression of 158 out of 259 mitochondrial genes (61%) (Figure 5C).
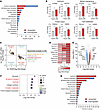 Figure 5
Effect of insulin on mitochondrial gene expression in cultured mammary cells. (A) Major mitochondrial processes altered in MCF-12A cells following 100 nM insulin. Numbers of up- and downregulated genes are shown in red and blue, respectively. (B) Selected mitochondrial genes altered in MCF-12A cells after 0 nM (gray) or 100 nM (red) insulin. Data shown as mean ± SEM (n = 5 biological replicates). *Meta-q < 0.05 from DEG analysis. (C) Interaction analysis between Akt expression and 100 nM insulin, showing mitochondrial genes with either attenuated or enhanced expression following Akt knockdown in MCF-12A cells treated with 100 nM insulin. Numbers of genes categorized according to pathway annotations are shown (43). Other mitochondrial processes include detoxification, NAD metabolism, dynamics, signaling, mitophagy, and small molecule transport. (D) Heatmap of OXPHOS genes upregulated by 100 nM insulin. Each cell represents mean log2 fold-change from n = 5 biological replicates. (E) Volcano plot showing up- (red) and downregulated (blue) genes following 100 nM insulin in HC11 cells. (F) Enriched biological processes following 100 nM insulin in HC11 cells. Mitochondrial processes are shown in red. Circle color represents FDR-adjusted P value (meta-q) obtained from FGSEA and ssGSEA. (G) Mitochondrial processes altered in HC11 cells following 100 nM insulin.
Treatment of MCF-12A cells with 100 nM insulin for 8 hours increased the expression of 10 genes involved in mitochondrial ATP generation, thus highlighting a potential role for this hormone in promoting mammary OXPHOS (Figure 5D). We validated this using the murine HC11 cell line, an established model for studying mammary cell mitochondria (52, 53). HC11 cells were differentiated to express β-casein (54), then treated with 100 nM insulin for 8 hours prior to bulk RNA-seq (Supplemental Figure 12). Insulin altered the expression of 3,128 (27%) out of 11,791 transcripts, of which 1,589 were upregulated and 1,539 were downregulated (Figure 5E, Supplemental Figure 13, and Supplemental Table 20). Biological pathway analysis showed that the major effects of insulin in HC11 cells were on mitochondrial processes (Figure 5, F and G). This included increased expression of genes involved in OXPHOS, mitochondrial import and folding of nuclear-encoded proteins, transcription and translation of the mitochondrial genome, and structural organization mediated by the mitochondrial contact site and cristae organizing system (Supplemental Figure 14 and Supplemental Table 21) (55).
Insulin promotes mitochondrial biogenesis and OXPHOS in cultured mammary cells. Insulin had a pronounced effect on mitochondrial gene expression in murine HC11 cells. These cells were used to investigate whether insulin may promote mitochondrial biogenesis as assessed by changes in mitochondrial volume and morphology. Cells were treated with 0, 10, and 100 nM insulin for 24 hours and labeled with a mitochondrial probe (PK Mito Orange) (Figure 6A). This revealed that 10 and 100 nM insulin increased mitochondrial volume in a concentration-dependent manner (2.54 ± 0.16 μm3 [P < 0.05] and 2.66 ± 0.15 μm3 [P < 0.01], respectively, vs. 2.04 ± 0.07 μm3 for control cells, 1-way ANOVA), consistent with increased mitochondrial biogenesis (Figure 6, B and C). However, insulin did not affect mitochondrial length or the number of branches, which are indicators of fusion and fission events (Figure 6, D and E) (56). Next, we investigated the effect of hyperinsulinemia, which occurs in IR conditions, such as obesity and T2DM, by treating cells with 1,000 nM insulin, as reported (57, 58). Exposure to 1,000 nM insulin for 24 hours led to decreases in mitochondrial volume and length and number of branches, as well as increasing mitochondrial roundness and fragmentation (Figure 6, B–F). Transmission electron microscopy was used to confirm these findings. This showed that cells treated with 1,000 nM insulin for 24 hours had predominantly small, rounded mitochondria, whereas cells treated with 0, 10, or 100 nM insulin had both rounded and tubular mitochondria (Supplemental Figure 15).
 Figure 6
Effect of insulin on mitochondrial volume and morphology in cultured mammary cells. (A) Protocol for mitochondrial volume and morphology analysis in HC11 cells. (B) Representative images of mitochondria in cells treated with insulin (0, 10, 100, or 1,000 nM) for 24 hours, shown as maximum z projections. Scale bar = 10 μm. (C–F) Quantitative analysis of mitochondrial parameters: (C) volume, (D) length, (E) number of branches, and (F) sphericity in insulin-treated cells. On average, 7,000–10,000 mitochondria were analyzed per image from each condition (n = 5–10 images per condition). Data in C–F are shown as mean ± SEM (n = 7–10 biological replicates). *P < 0.05, **P < 0.01, ***P < 0.001, ****P < 0.0001 (1-way ANOVA).
We determined if insulin-mediated mitochondrial biogenesis alters bioenergetics using live cell monitoring of O2 and pH as indicators of OXPHOS and glycolysis, respectively (59). HC11 cells treated with 10 and 100 nM insulin showed a concentration-dependent decrease in basal intracellular O2 and increase in O2 consumption rate (OCR), consistent with increased OXPHOS (Figure 7, A and B). Insulin (100 nM) had a more pronounced effect on maximal O2 consumption induced by carbonylcyanide p-trifluoromethoxyphenylhydrazone (FCCP), a mitochondria uncoupler, and resulted in ~3-fold increase in maximal OCR compared with untreated cells (P < 0.01, 1-way ANOVA) (Figure 7, C and D). Furthermore, insulin caused a concentration-dependent decrease in pH and increase in the extracellular acidification rate (ECAR), consistent with increased basal glycolysis (Figure 7, E and F). Glycolytic capacity, which was calculated as the difference between oligomycin-stimulated glycolysis and glycolysis-independent extracellular acidification (60), significantly increased following 100 nM insulin (P < 0.001, 1-way ANOVA) (Figure 7, G and H). These findings indicate that insulin enhances both basal and maximal glycolysis and OXPHOS in HC11 cells.
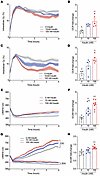 Figure 7
Bioenergetic effects of insulin in cultured mammary cells. (A) Changes in basal intracellular O2 in response to insulin. (B) Basal OCR shown as a fold-change compared with HC11 cells without insulin. (C) Changes in intracellular O2 in response to insulin and FCCP-induced O2 consumption. (D) FCCP-induced OCR shown as a fold-change compared with cells without insulin. (E) Changes in basal pH in response to insulin, expressed as fluorescence lifetime. (F) Basal extracellular acidification rate (ECAR) shown as a fold-change compared with cells without insulin. (G) Changes in pH in response to insulin and stimulation or inhibition of glycolysis with oligomycin (OG) or 2-deoxyglucose (2DG), respectively. (H) Glycolytic capacity calculated by ECAR after oligomycin addition minus ECAR after 2DG addition. Data in B, D, F, and H are shown as mean ± SEM (n = 5–8 biological replicates). **P < 0.01, ***P < 0.001 compared with untreated HC11 cells (1-way ANOVA).
Transcriptional components mediating effects of insulin on mitochondrial gene expression. In skeletal muscle, insulin is reported to influence mitochondrial biogenesis and cellular bioenergetics by regulating peroxisome proliferator–activated receptor γ coactivator-1-alpha (PGC-1α) expression (61, 62). PGC-1α is a transcriptional coactivator that acts via nuclear transcription factors (TFs), including nuclear respiratory factor-1 (NRF-1), to increase expression of genes mediating mitochondrial formation and function (63). However, in HC11 cells, insulin paradoxically decreased PGC-1α gene expression (Supplemental Figure 16A), despite this hormone increasing both mitochondrial gene expression and volume (Figures 5 and 6). Moreover, treatment with 10 and 100 nM insulin for 8 hours had no effect on PGC-1α protein abundance (Supplemental Figure 16, B and C). Thus, insulin may be acting by a distinct transcriptional mechanism in the mammary gland compared with skeletal muscle, which we explored using chromatin immunoprecipitation sequencing (ChIP-seq) data from the ChIP-Atlas (64). In silico analysis of TFs binding to highly upregulated mitochondrial genes in insulin-treated HC11 cells was performed using murine lactating mammary gland and skeletal muscle ChIP-seq data (Supplemental Table 22) (64). This revealed 14 TFs to bind the promoter region of these mitochondrial genes, with 9 TFs associated with mitochondrial gene loci in the lactating mammary gland but not skeletal muscle (Supplemental Figure 16D). These mammary-selective TFs include established mediators of lactation, such as STAT5A and the E74 like ETS transcription factor 5, as well as nuclear receptors binding progesterone and estradiol (Supplemental Figure 16D). In contrast, the NRF-1 TF was shown to associate with mitochondrial gene loci in skeletal muscle but not the lactating mammary gland (Supplemental Figure 16D).


Copyright © 2026 American Society for Clinical Investigation
ISSN: 0021-9738 (print), 1558-8238 (online)