
Advertisement
Clinical Research and Public HealthGeneticsOncology
Open Access |  10.1172/JCI196284
Genome-wide variation in cell-free DNA end-motif entropy predicts immunotherapy response in head and neck cancer
Ravi Bandaru,1,2 Hailu Fu,1,2 Haizi Zheng,3 Jocelyn Liang,1,2 Li Wang,1,2 Shuchi Gulati,4 Benjamin H. Hinrichs,5 Mingxiang Teng,6 Bin Zhang,7,8 Masha Kocherginsky,9 De-Chen Lin,10 David A. Hildeman,11 Francis P. Worden,12 Matthew Old,13 Neal E. Dunlap,14 John M. Kaczmar,15 Maura L. Gillison,16 Dalia El-Gamal,4 Trisha Wise Draper,4 and Yaping Liu1,2
1Department of Biochemistry and Molecular Genetics, Feinberg School of Medicine, Northwestern University, Chicago, Illinois, USA.
2Robert H. Lurie Comprehensive Cancer Center of Northwestern University, Chicago, Illinois, USA.
3Division of Human Genetics, Cincinnati Children’s Hospital Medical Center, Cincinnati, Ohio, USA.
4Division of Hematology/Oncology, and
5Department of Pathology, University of Cincinnati, Cincinnati, Ohio, USA.
6Department of Biostatistics and Bioinformatics, Moffitt Cancer Center, Tampa, Florida, USA.
7Department of Pediatrics, University of Cincinnati College of Medicine, Cincinnati, Ohio, USA.
8Division of Biostatistics and Epidemiology, Cincinnati Children’s Hospital Medical Center, Ohio, USA.
9Department of Preventive Medicine, Feinberg School of Medicine, Northwestern University, Chicago, Illinois, USA.
10Center for Craniofacial Molecular Biology, Herman Ostrow School of Dentistry, and Norris Comprehensive Cancer Center, University of Southern California, Los Angeles, California, USA.
11Division of Immunobiology, University of Cincinnati College of Medicine, Cincinnati, Ohio, USA.
12University of Michigan Cancer Center, Ann Arbor, Michigan, USA.
13Department of Otolaryngology, Ohio State University, Columbus, Ohio, USA.
14Department of Radiation Oncology, University of Louisville, Louisville, Kentucky, USA.
15Division of Hematology/Oncology, Medical University of South Carolina, Charleston, South Carolina, USA.
16The University of Texas MD Anderson Cancer Center, Houston, Texas, USA.
Address correspondence to: Trisha Wise-Draper, Division of Hematology/Oncology, University of Cincinnati Vontz Center for Molecular Studies, 3125 Eden Avenue, ML 0562, Cincinnati, Ohio, 45267, USA. Phone: 513.558.2826; Email: wiseth@ucmail.uc.edu. Or to: Yaping Liu, Department of Biochemistry and Molecular Genetics, Feinberg School of Medicine, Northwestern University, Robert H. Lurie Comprehensive Cancer Center of Northwestern University, 303 E Superior Street, 7-304, Chicago, Illinois, 60611, USA. Phone: 312. 503.1699; Email: lyping1986@gmail.com.
Find articles by Bandaru, R. in: PubMed | Google Scholar
1Department of Biochemistry and Molecular Genetics, Feinberg School of Medicine, Northwestern University, Chicago, Illinois, USA.
2Robert H. Lurie Comprehensive Cancer Center of Northwestern University, Chicago, Illinois, USA.
3Division of Human Genetics, Cincinnati Children’s Hospital Medical Center, Cincinnati, Ohio, USA.
4Division of Hematology/Oncology, and
5Department of Pathology, University of Cincinnati, Cincinnati, Ohio, USA.
6Department of Biostatistics and Bioinformatics, Moffitt Cancer Center, Tampa, Florida, USA.
7Department of Pediatrics, University of Cincinnati College of Medicine, Cincinnati, Ohio, USA.
8Division of Biostatistics and Epidemiology, Cincinnati Children’s Hospital Medical Center, Ohio, USA.
9Department of Preventive Medicine, Feinberg School of Medicine, Northwestern University, Chicago, Illinois, USA.
10Center for Craniofacial Molecular Biology, Herman Ostrow School of Dentistry, and Norris Comprehensive Cancer Center, University of Southern California, Los Angeles, California, USA.
11Division of Immunobiology, University of Cincinnati College of Medicine, Cincinnati, Ohio, USA.
12University of Michigan Cancer Center, Ann Arbor, Michigan, USA.
13Department of Otolaryngology, Ohio State University, Columbus, Ohio, USA.
14Department of Radiation Oncology, University of Louisville, Louisville, Kentucky, USA.
15Division of Hematology/Oncology, Medical University of South Carolina, Charleston, South Carolina, USA.
16The University of Texas MD Anderson Cancer Center, Houston, Texas, USA.
Address correspondence to: Trisha Wise-Draper, Division of Hematology/Oncology, University of Cincinnati Vontz Center for Molecular Studies, 3125 Eden Avenue, ML 0562, Cincinnati, Ohio, 45267, USA. Phone: 513.558.2826; Email: wiseth@ucmail.uc.edu. Or to: Yaping Liu, Department of Biochemistry and Molecular Genetics, Feinberg School of Medicine, Northwestern University, Robert H. Lurie Comprehensive Cancer Center of Northwestern University, 303 E Superior Street, 7-304, Chicago, Illinois, 60611, USA. Phone: 312. 503.1699; Email: lyping1986@gmail.com.
Find articles by Fu, H. in: PubMed | Google Scholar
1Department of Biochemistry and Molecular Genetics, Feinberg School of Medicine, Northwestern University, Chicago, Illinois, USA.
2Robert H. Lurie Comprehensive Cancer Center of Northwestern University, Chicago, Illinois, USA.
3Division of Human Genetics, Cincinnati Children’s Hospital Medical Center, Cincinnati, Ohio, USA.
4Division of Hematology/Oncology, and
5Department of Pathology, University of Cincinnati, Cincinnati, Ohio, USA.
6Department of Biostatistics and Bioinformatics, Moffitt Cancer Center, Tampa, Florida, USA.
7Department of Pediatrics, University of Cincinnati College of Medicine, Cincinnati, Ohio, USA.
8Division of Biostatistics and Epidemiology, Cincinnati Children’s Hospital Medical Center, Ohio, USA.
9Department of Preventive Medicine, Feinberg School of Medicine, Northwestern University, Chicago, Illinois, USA.
10Center for Craniofacial Molecular Biology, Herman Ostrow School of Dentistry, and Norris Comprehensive Cancer Center, University of Southern California, Los Angeles, California, USA.
11Division of Immunobiology, University of Cincinnati College of Medicine, Cincinnati, Ohio, USA.
12University of Michigan Cancer Center, Ann Arbor, Michigan, USA.
13Department of Otolaryngology, Ohio State University, Columbus, Ohio, USA.
14Department of Radiation Oncology, University of Louisville, Louisville, Kentucky, USA.
15Division of Hematology/Oncology, Medical University of South Carolina, Charleston, South Carolina, USA.
16The University of Texas MD Anderson Cancer Center, Houston, Texas, USA.
Address correspondence to: Trisha Wise-Draper, Division of Hematology/Oncology, University of Cincinnati Vontz Center for Molecular Studies, 3125 Eden Avenue, ML 0562, Cincinnati, Ohio, 45267, USA. Phone: 513.558.2826; Email: wiseth@ucmail.uc.edu. Or to: Yaping Liu, Department of Biochemistry and Molecular Genetics, Feinberg School of Medicine, Northwestern University, Robert H. Lurie Comprehensive Cancer Center of Northwestern University, 303 E Superior Street, 7-304, Chicago, Illinois, 60611, USA. Phone: 312. 503.1699; Email: lyping1986@gmail.com.
Find articles by Zheng, H. in: PubMed | Google Scholar
1Department of Biochemistry and Molecular Genetics, Feinberg School of Medicine, Northwestern University, Chicago, Illinois, USA.
2Robert H. Lurie Comprehensive Cancer Center of Northwestern University, Chicago, Illinois, USA.
3Division of Human Genetics, Cincinnati Children’s Hospital Medical Center, Cincinnati, Ohio, USA.
4Division of Hematology/Oncology, and
5Department of Pathology, University of Cincinnati, Cincinnati, Ohio, USA.
6Department of Biostatistics and Bioinformatics, Moffitt Cancer Center, Tampa, Florida, USA.
7Department of Pediatrics, University of Cincinnati College of Medicine, Cincinnati, Ohio, USA.
8Division of Biostatistics and Epidemiology, Cincinnati Children’s Hospital Medical Center, Ohio, USA.
9Department of Preventive Medicine, Feinberg School of Medicine, Northwestern University, Chicago, Illinois, USA.
10Center for Craniofacial Molecular Biology, Herman Ostrow School of Dentistry, and Norris Comprehensive Cancer Center, University of Southern California, Los Angeles, California, USA.
11Division of Immunobiology, University of Cincinnati College of Medicine, Cincinnati, Ohio, USA.
12University of Michigan Cancer Center, Ann Arbor, Michigan, USA.
13Department of Otolaryngology, Ohio State University, Columbus, Ohio, USA.
14Department of Radiation Oncology, University of Louisville, Louisville, Kentucky, USA.
15Division of Hematology/Oncology, Medical University of South Carolina, Charleston, South Carolina, USA.
16The University of Texas MD Anderson Cancer Center, Houston, Texas, USA.
Address correspondence to: Trisha Wise-Draper, Division of Hematology/Oncology, University of Cincinnati Vontz Center for Molecular Studies, 3125 Eden Avenue, ML 0562, Cincinnati, Ohio, 45267, USA. Phone: 513.558.2826; Email: wiseth@ucmail.uc.edu. Or to: Yaping Liu, Department of Biochemistry and Molecular Genetics, Feinberg School of Medicine, Northwestern University, Robert H. Lurie Comprehensive Cancer Center of Northwestern University, 303 E Superior Street, 7-304, Chicago, Illinois, 60611, USA. Phone: 312. 503.1699; Email: lyping1986@gmail.com.
Find articles by Liang, J. in: PubMed | Google Scholar
1Department of Biochemistry and Molecular Genetics, Feinberg School of Medicine, Northwestern University, Chicago, Illinois, USA.
2Robert H. Lurie Comprehensive Cancer Center of Northwestern University, Chicago, Illinois, USA.
3Division of Human Genetics, Cincinnati Children’s Hospital Medical Center, Cincinnati, Ohio, USA.
4Division of Hematology/Oncology, and
5Department of Pathology, University of Cincinnati, Cincinnati, Ohio, USA.
6Department of Biostatistics and Bioinformatics, Moffitt Cancer Center, Tampa, Florida, USA.
7Department of Pediatrics, University of Cincinnati College of Medicine, Cincinnati, Ohio, USA.
8Division of Biostatistics and Epidemiology, Cincinnati Children’s Hospital Medical Center, Ohio, USA.
9Department of Preventive Medicine, Feinberg School of Medicine, Northwestern University, Chicago, Illinois, USA.
10Center for Craniofacial Molecular Biology, Herman Ostrow School of Dentistry, and Norris Comprehensive Cancer Center, University of Southern California, Los Angeles, California, USA.
11Division of Immunobiology, University of Cincinnati College of Medicine, Cincinnati, Ohio, USA.
12University of Michigan Cancer Center, Ann Arbor, Michigan, USA.
13Department of Otolaryngology, Ohio State University, Columbus, Ohio, USA.
14Department of Radiation Oncology, University of Louisville, Louisville, Kentucky, USA.
15Division of Hematology/Oncology, Medical University of South Carolina, Charleston, South Carolina, USA.
16The University of Texas MD Anderson Cancer Center, Houston, Texas, USA.
Address correspondence to: Trisha Wise-Draper, Division of Hematology/Oncology, University of Cincinnati Vontz Center for Molecular Studies, 3125 Eden Avenue, ML 0562, Cincinnati, Ohio, 45267, USA. Phone: 513.558.2826; Email: wiseth@ucmail.uc.edu. Or to: Yaping Liu, Department of Biochemistry and Molecular Genetics, Feinberg School of Medicine, Northwestern University, Robert H. Lurie Comprehensive Cancer Center of Northwestern University, 303 E Superior Street, 7-304, Chicago, Illinois, 60611, USA. Phone: 312. 503.1699; Email: lyping1986@gmail.com.
Find articles by Wang, L. in: PubMed | Google Scholar
1Department of Biochemistry and Molecular Genetics, Feinberg School of Medicine, Northwestern University, Chicago, Illinois, USA.
2Robert H. Lurie Comprehensive Cancer Center of Northwestern University, Chicago, Illinois, USA.
3Division of Human Genetics, Cincinnati Children’s Hospital Medical Center, Cincinnati, Ohio, USA.
4Division of Hematology/Oncology, and
5Department of Pathology, University of Cincinnati, Cincinnati, Ohio, USA.
6Department of Biostatistics and Bioinformatics, Moffitt Cancer Center, Tampa, Florida, USA.
7Department of Pediatrics, University of Cincinnati College of Medicine, Cincinnati, Ohio, USA.
8Division of Biostatistics and Epidemiology, Cincinnati Children’s Hospital Medical Center, Ohio, USA.
9Department of Preventive Medicine, Feinberg School of Medicine, Northwestern University, Chicago, Illinois, USA.
10Center for Craniofacial Molecular Biology, Herman Ostrow School of Dentistry, and Norris Comprehensive Cancer Center, University of Southern California, Los Angeles, California, USA.
11Division of Immunobiology, University of Cincinnati College of Medicine, Cincinnati, Ohio, USA.
12University of Michigan Cancer Center, Ann Arbor, Michigan, USA.
13Department of Otolaryngology, Ohio State University, Columbus, Ohio, USA.
14Department of Radiation Oncology, University of Louisville, Louisville, Kentucky, USA.
15Division of Hematology/Oncology, Medical University of South Carolina, Charleston, South Carolina, USA.
16The University of Texas MD Anderson Cancer Center, Houston, Texas, USA.
Address correspondence to: Trisha Wise-Draper, Division of Hematology/Oncology, University of Cincinnati Vontz Center for Molecular Studies, 3125 Eden Avenue, ML 0562, Cincinnati, Ohio, 45267, USA. Phone: 513.558.2826; Email: wiseth@ucmail.uc.edu. Or to: Yaping Liu, Department of Biochemistry and Molecular Genetics, Feinberg School of Medicine, Northwestern University, Robert H. Lurie Comprehensive Cancer Center of Northwestern University, 303 E Superior Street, 7-304, Chicago, Illinois, 60611, USA. Phone: 312. 503.1699; Email: lyping1986@gmail.com.
Find articles by Gulati, S. in: PubMed | Google Scholar
1Department of Biochemistry and Molecular Genetics, Feinberg School of Medicine, Northwestern University, Chicago, Illinois, USA.
2Robert H. Lurie Comprehensive Cancer Center of Northwestern University, Chicago, Illinois, USA.
3Division of Human Genetics, Cincinnati Children’s Hospital Medical Center, Cincinnati, Ohio, USA.
4Division of Hematology/Oncology, and
5Department of Pathology, University of Cincinnati, Cincinnati, Ohio, USA.
6Department of Biostatistics and Bioinformatics, Moffitt Cancer Center, Tampa, Florida, USA.
7Department of Pediatrics, University of Cincinnati College of Medicine, Cincinnati, Ohio, USA.
8Division of Biostatistics and Epidemiology, Cincinnati Children’s Hospital Medical Center, Ohio, USA.
9Department of Preventive Medicine, Feinberg School of Medicine, Northwestern University, Chicago, Illinois, USA.
10Center for Craniofacial Molecular Biology, Herman Ostrow School of Dentistry, and Norris Comprehensive Cancer Center, University of Southern California, Los Angeles, California, USA.
11Division of Immunobiology, University of Cincinnati College of Medicine, Cincinnati, Ohio, USA.
12University of Michigan Cancer Center, Ann Arbor, Michigan, USA.
13Department of Otolaryngology, Ohio State University, Columbus, Ohio, USA.
14Department of Radiation Oncology, University of Louisville, Louisville, Kentucky, USA.
15Division of Hematology/Oncology, Medical University of South Carolina, Charleston, South Carolina, USA.
16The University of Texas MD Anderson Cancer Center, Houston, Texas, USA.
Address correspondence to: Trisha Wise-Draper, Division of Hematology/Oncology, University of Cincinnati Vontz Center for Molecular Studies, 3125 Eden Avenue, ML 0562, Cincinnati, Ohio, 45267, USA. Phone: 513.558.2826; Email: wiseth@ucmail.uc.edu. Or to: Yaping Liu, Department of Biochemistry and Molecular Genetics, Feinberg School of Medicine, Northwestern University, Robert H. Lurie Comprehensive Cancer Center of Northwestern University, 303 E Superior Street, 7-304, Chicago, Illinois, 60611, USA. Phone: 312. 503.1699; Email: lyping1986@gmail.com.
Find articles by Hinrichs, B. in: PubMed | Google Scholar
1Department of Biochemistry and Molecular Genetics, Feinberg School of Medicine, Northwestern University, Chicago, Illinois, USA.
2Robert H. Lurie Comprehensive Cancer Center of Northwestern University, Chicago, Illinois, USA.
3Division of Human Genetics, Cincinnati Children’s Hospital Medical Center, Cincinnati, Ohio, USA.
4Division of Hematology/Oncology, and
5Department of Pathology, University of Cincinnati, Cincinnati, Ohio, USA.
6Department of Biostatistics and Bioinformatics, Moffitt Cancer Center, Tampa, Florida, USA.
7Department of Pediatrics, University of Cincinnati College of Medicine, Cincinnati, Ohio, USA.
8Division of Biostatistics and Epidemiology, Cincinnati Children’s Hospital Medical Center, Ohio, USA.
9Department of Preventive Medicine, Feinberg School of Medicine, Northwestern University, Chicago, Illinois, USA.
10Center for Craniofacial Molecular Biology, Herman Ostrow School of Dentistry, and Norris Comprehensive Cancer Center, University of Southern California, Los Angeles, California, USA.
11Division of Immunobiology, University of Cincinnati College of Medicine, Cincinnati, Ohio, USA.
12University of Michigan Cancer Center, Ann Arbor, Michigan, USA.
13Department of Otolaryngology, Ohio State University, Columbus, Ohio, USA.
14Department of Radiation Oncology, University of Louisville, Louisville, Kentucky, USA.
15Division of Hematology/Oncology, Medical University of South Carolina, Charleston, South Carolina, USA.
16The University of Texas MD Anderson Cancer Center, Houston, Texas, USA.
Address correspondence to: Trisha Wise-Draper, Division of Hematology/Oncology, University of Cincinnati Vontz Center for Molecular Studies, 3125 Eden Avenue, ML 0562, Cincinnati, Ohio, 45267, USA. Phone: 513.558.2826; Email: wiseth@ucmail.uc.edu. Or to: Yaping Liu, Department of Biochemistry and Molecular Genetics, Feinberg School of Medicine, Northwestern University, Robert H. Lurie Comprehensive Cancer Center of Northwestern University, 303 E Superior Street, 7-304, Chicago, Illinois, 60611, USA. Phone: 312. 503.1699; Email: lyping1986@gmail.com.
Find articles by
Teng, M.
in:
PubMed
|
Google Scholar
|

1Department of Biochemistry and Molecular Genetics, Feinberg School of Medicine, Northwestern University, Chicago, Illinois, USA.
2Robert H. Lurie Comprehensive Cancer Center of Northwestern University, Chicago, Illinois, USA.
3Division of Human Genetics, Cincinnati Children’s Hospital Medical Center, Cincinnati, Ohio, USA.
4Division of Hematology/Oncology, and
5Department of Pathology, University of Cincinnati, Cincinnati, Ohio, USA.
6Department of Biostatistics and Bioinformatics, Moffitt Cancer Center, Tampa, Florida, USA.
7Department of Pediatrics, University of Cincinnati College of Medicine, Cincinnati, Ohio, USA.
8Division of Biostatistics and Epidemiology, Cincinnati Children’s Hospital Medical Center, Ohio, USA.
9Department of Preventive Medicine, Feinberg School of Medicine, Northwestern University, Chicago, Illinois, USA.
10Center for Craniofacial Molecular Biology, Herman Ostrow School of Dentistry, and Norris Comprehensive Cancer Center, University of Southern California, Los Angeles, California, USA.
11Division of Immunobiology, University of Cincinnati College of Medicine, Cincinnati, Ohio, USA.
12University of Michigan Cancer Center, Ann Arbor, Michigan, USA.
13Department of Otolaryngology, Ohio State University, Columbus, Ohio, USA.
14Department of Radiation Oncology, University of Louisville, Louisville, Kentucky, USA.
15Division of Hematology/Oncology, Medical University of South Carolina, Charleston, South Carolina, USA.
16The University of Texas MD Anderson Cancer Center, Houston, Texas, USA.
Address correspondence to: Trisha Wise-Draper, Division of Hematology/Oncology, University of Cincinnati Vontz Center for Molecular Studies, 3125 Eden Avenue, ML 0562, Cincinnati, Ohio, 45267, USA. Phone: 513.558.2826; Email: wiseth@ucmail.uc.edu. Or to: Yaping Liu, Department of Biochemistry and Molecular Genetics, Feinberg School of Medicine, Northwestern University, Robert H. Lurie Comprehensive Cancer Center of Northwestern University, 303 E Superior Street, 7-304, Chicago, Illinois, 60611, USA. Phone: 312. 503.1699; Email: lyping1986@gmail.com.
Find articles by Zhang, B. in: PubMed | Google Scholar
1Department of Biochemistry and Molecular Genetics, Feinberg School of Medicine, Northwestern University, Chicago, Illinois, USA.
2Robert H. Lurie Comprehensive Cancer Center of Northwestern University, Chicago, Illinois, USA.
3Division of Human Genetics, Cincinnati Children’s Hospital Medical Center, Cincinnati, Ohio, USA.
4Division of Hematology/Oncology, and
5Department of Pathology, University of Cincinnati, Cincinnati, Ohio, USA.
6Department of Biostatistics and Bioinformatics, Moffitt Cancer Center, Tampa, Florida, USA.
7Department of Pediatrics, University of Cincinnati College of Medicine, Cincinnati, Ohio, USA.
8Division of Biostatistics and Epidemiology, Cincinnati Children’s Hospital Medical Center, Ohio, USA.
9Department of Preventive Medicine, Feinberg School of Medicine, Northwestern University, Chicago, Illinois, USA.
10Center for Craniofacial Molecular Biology, Herman Ostrow School of Dentistry, and Norris Comprehensive Cancer Center, University of Southern California, Los Angeles, California, USA.
11Division of Immunobiology, University of Cincinnati College of Medicine, Cincinnati, Ohio, USA.
12University of Michigan Cancer Center, Ann Arbor, Michigan, USA.
13Department of Otolaryngology, Ohio State University, Columbus, Ohio, USA.
14Department of Radiation Oncology, University of Louisville, Louisville, Kentucky, USA.
15Division of Hematology/Oncology, Medical University of South Carolina, Charleston, South Carolina, USA.
16The University of Texas MD Anderson Cancer Center, Houston, Texas, USA.
Address correspondence to: Trisha Wise-Draper, Division of Hematology/Oncology, University of Cincinnati Vontz Center for Molecular Studies, 3125 Eden Avenue, ML 0562, Cincinnati, Ohio, 45267, USA. Phone: 513.558.2826; Email: wiseth@ucmail.uc.edu. Or to: Yaping Liu, Department of Biochemistry and Molecular Genetics, Feinberg School of Medicine, Northwestern University, Robert H. Lurie Comprehensive Cancer Center of Northwestern University, 303 E Superior Street, 7-304, Chicago, Illinois, 60611, USA. Phone: 312. 503.1699; Email: lyping1986@gmail.com.
Find articles by Kocherginsky, M. in: PubMed | Google Scholar
1Department of Biochemistry and Molecular Genetics, Feinberg School of Medicine, Northwestern University, Chicago, Illinois, USA.
2Robert H. Lurie Comprehensive Cancer Center of Northwestern University, Chicago, Illinois, USA.
3Division of Human Genetics, Cincinnati Children’s Hospital Medical Center, Cincinnati, Ohio, USA.
4Division of Hematology/Oncology, and
5Department of Pathology, University of Cincinnati, Cincinnati, Ohio, USA.
6Department of Biostatistics and Bioinformatics, Moffitt Cancer Center, Tampa, Florida, USA.
7Department of Pediatrics, University of Cincinnati College of Medicine, Cincinnati, Ohio, USA.
8Division of Biostatistics and Epidemiology, Cincinnati Children’s Hospital Medical Center, Ohio, USA.
9Department of Preventive Medicine, Feinberg School of Medicine, Northwestern University, Chicago, Illinois, USA.
10Center for Craniofacial Molecular Biology, Herman Ostrow School of Dentistry, and Norris Comprehensive Cancer Center, University of Southern California, Los Angeles, California, USA.
11Division of Immunobiology, University of Cincinnati College of Medicine, Cincinnati, Ohio, USA.
12University of Michigan Cancer Center, Ann Arbor, Michigan, USA.
13Department of Otolaryngology, Ohio State University, Columbus, Ohio, USA.
14Department of Radiation Oncology, University of Louisville, Louisville, Kentucky, USA.
15Division of Hematology/Oncology, Medical University of South Carolina, Charleston, South Carolina, USA.
16The University of Texas MD Anderson Cancer Center, Houston, Texas, USA.
Address correspondence to: Trisha Wise-Draper, Division of Hematology/Oncology, University of Cincinnati Vontz Center for Molecular Studies, 3125 Eden Avenue, ML 0562, Cincinnati, Ohio, 45267, USA. Phone: 513.558.2826; Email: wiseth@ucmail.uc.edu. Or to: Yaping Liu, Department of Biochemistry and Molecular Genetics, Feinberg School of Medicine, Northwestern University, Robert H. Lurie Comprehensive Cancer Center of Northwestern University, 303 E Superior Street, 7-304, Chicago, Illinois, 60611, USA. Phone: 312. 503.1699; Email: lyping1986@gmail.com.
Find articles by Lin, D. in: PubMed | Google Scholar
1Department of Biochemistry and Molecular Genetics, Feinberg School of Medicine, Northwestern University, Chicago, Illinois, USA.
2Robert H. Lurie Comprehensive Cancer Center of Northwestern University, Chicago, Illinois, USA.
3Division of Human Genetics, Cincinnati Children’s Hospital Medical Center, Cincinnati, Ohio, USA.
4Division of Hematology/Oncology, and
5Department of Pathology, University of Cincinnati, Cincinnati, Ohio, USA.
6Department of Biostatistics and Bioinformatics, Moffitt Cancer Center, Tampa, Florida, USA.
7Department of Pediatrics, University of Cincinnati College of Medicine, Cincinnati, Ohio, USA.
8Division of Biostatistics and Epidemiology, Cincinnati Children’s Hospital Medical Center, Ohio, USA.
9Department of Preventive Medicine, Feinberg School of Medicine, Northwestern University, Chicago, Illinois, USA.
10Center for Craniofacial Molecular Biology, Herman Ostrow School of Dentistry, and Norris Comprehensive Cancer Center, University of Southern California, Los Angeles, California, USA.
11Division of Immunobiology, University of Cincinnati College of Medicine, Cincinnati, Ohio, USA.
12University of Michigan Cancer Center, Ann Arbor, Michigan, USA.
13Department of Otolaryngology, Ohio State University, Columbus, Ohio, USA.
14Department of Radiation Oncology, University of Louisville, Louisville, Kentucky, USA.
15Division of Hematology/Oncology, Medical University of South Carolina, Charleston, South Carolina, USA.
16The University of Texas MD Anderson Cancer Center, Houston, Texas, USA.
Address correspondence to: Trisha Wise-Draper, Division of Hematology/Oncology, University of Cincinnati Vontz Center for Molecular Studies, 3125 Eden Avenue, ML 0562, Cincinnati, Ohio, 45267, USA. Phone: 513.558.2826; Email: wiseth@ucmail.uc.edu. Or to: Yaping Liu, Department of Biochemistry and Molecular Genetics, Feinberg School of Medicine, Northwestern University, Robert H. Lurie Comprehensive Cancer Center of Northwestern University, 303 E Superior Street, 7-304, Chicago, Illinois, 60611, USA. Phone: 312. 503.1699; Email: lyping1986@gmail.com.
Find articles by
Hildeman, D.
in:
PubMed
|
Google Scholar
|
1Department of Biochemistry and Molecular Genetics, Feinberg School of Medicine, Northwestern University, Chicago, Illinois, USA.
2Robert H. Lurie Comprehensive Cancer Center of Northwestern University, Chicago, Illinois, USA.
3Division of Human Genetics, Cincinnati Children’s Hospital Medical Center, Cincinnati, Ohio, USA.
4Division of Hematology/Oncology, and
5Department of Pathology, University of Cincinnati, Cincinnati, Ohio, USA.
6Department of Biostatistics and Bioinformatics, Moffitt Cancer Center, Tampa, Florida, USA.
7Department of Pediatrics, University of Cincinnati College of Medicine, Cincinnati, Ohio, USA.
8Division of Biostatistics and Epidemiology, Cincinnati Children’s Hospital Medical Center, Ohio, USA.
9Department of Preventive Medicine, Feinberg School of Medicine, Northwestern University, Chicago, Illinois, USA.
10Center for Craniofacial Molecular Biology, Herman Ostrow School of Dentistry, and Norris Comprehensive Cancer Center, University of Southern California, Los Angeles, California, USA.
11Division of Immunobiology, University of Cincinnati College of Medicine, Cincinnati, Ohio, USA.
12University of Michigan Cancer Center, Ann Arbor, Michigan, USA.
13Department of Otolaryngology, Ohio State University, Columbus, Ohio, USA.
14Department of Radiation Oncology, University of Louisville, Louisville, Kentucky, USA.
15Division of Hematology/Oncology, Medical University of South Carolina, Charleston, South Carolina, USA.
16The University of Texas MD Anderson Cancer Center, Houston, Texas, USA.
Address correspondence to: Trisha Wise-Draper, Division of Hematology/Oncology, University of Cincinnati Vontz Center for Molecular Studies, 3125 Eden Avenue, ML 0562, Cincinnati, Ohio, 45267, USA. Phone: 513.558.2826; Email: wiseth@ucmail.uc.edu. Or to: Yaping Liu, Department of Biochemistry and Molecular Genetics, Feinberg School of Medicine, Northwestern University, Robert H. Lurie Comprehensive Cancer Center of Northwestern University, 303 E Superior Street, 7-304, Chicago, Illinois, 60611, USA. Phone: 312. 503.1699; Email: lyping1986@gmail.com.
Find articles by Worden, F. in: PubMed | Google Scholar
1Department of Biochemistry and Molecular Genetics, Feinberg School of Medicine, Northwestern University, Chicago, Illinois, USA.
2Robert H. Lurie Comprehensive Cancer Center of Northwestern University, Chicago, Illinois, USA.
3Division of Human Genetics, Cincinnati Children’s Hospital Medical Center, Cincinnati, Ohio, USA.
4Division of Hematology/Oncology, and
5Department of Pathology, University of Cincinnati, Cincinnati, Ohio, USA.
6Department of Biostatistics and Bioinformatics, Moffitt Cancer Center, Tampa, Florida, USA.
7Department of Pediatrics, University of Cincinnati College of Medicine, Cincinnati, Ohio, USA.
8Division of Biostatistics and Epidemiology, Cincinnati Children’s Hospital Medical Center, Ohio, USA.
9Department of Preventive Medicine, Feinberg School of Medicine, Northwestern University, Chicago, Illinois, USA.
10Center for Craniofacial Molecular Biology, Herman Ostrow School of Dentistry, and Norris Comprehensive Cancer Center, University of Southern California, Los Angeles, California, USA.
11Division of Immunobiology, University of Cincinnati College of Medicine, Cincinnati, Ohio, USA.
12University of Michigan Cancer Center, Ann Arbor, Michigan, USA.
13Department of Otolaryngology, Ohio State University, Columbus, Ohio, USA.
14Department of Radiation Oncology, University of Louisville, Louisville, Kentucky, USA.
15Division of Hematology/Oncology, Medical University of South Carolina, Charleston, South Carolina, USA.
16The University of Texas MD Anderson Cancer Center, Houston, Texas, USA.
Address correspondence to: Trisha Wise-Draper, Division of Hematology/Oncology, University of Cincinnati Vontz Center for Molecular Studies, 3125 Eden Avenue, ML 0562, Cincinnati, Ohio, 45267, USA. Phone: 513.558.2826; Email: wiseth@ucmail.uc.edu. Or to: Yaping Liu, Department of Biochemistry and Molecular Genetics, Feinberg School of Medicine, Northwestern University, Robert H. Lurie Comprehensive Cancer Center of Northwestern University, 303 E Superior Street, 7-304, Chicago, Illinois, 60611, USA. Phone: 312. 503.1699; Email: lyping1986@gmail.com.
Find articles by Old, M. in: PubMed | Google Scholar
1Department of Biochemistry and Molecular Genetics, Feinberg School of Medicine, Northwestern University, Chicago, Illinois, USA.
2Robert H. Lurie Comprehensive Cancer Center of Northwestern University, Chicago, Illinois, USA.
3Division of Human Genetics, Cincinnati Children’s Hospital Medical Center, Cincinnati, Ohio, USA.
4Division of Hematology/Oncology, and
5Department of Pathology, University of Cincinnati, Cincinnati, Ohio, USA.
6Department of Biostatistics and Bioinformatics, Moffitt Cancer Center, Tampa, Florida, USA.
7Department of Pediatrics, University of Cincinnati College of Medicine, Cincinnati, Ohio, USA.
8Division of Biostatistics and Epidemiology, Cincinnati Children’s Hospital Medical Center, Ohio, USA.
9Department of Preventive Medicine, Feinberg School of Medicine, Northwestern University, Chicago, Illinois, USA.
10Center for Craniofacial Molecular Biology, Herman Ostrow School of Dentistry, and Norris Comprehensive Cancer Center, University of Southern California, Los Angeles, California, USA.
11Division of Immunobiology, University of Cincinnati College of Medicine, Cincinnati, Ohio, USA.
12University of Michigan Cancer Center, Ann Arbor, Michigan, USA.
13Department of Otolaryngology, Ohio State University, Columbus, Ohio, USA.
14Department of Radiation Oncology, University of Louisville, Louisville, Kentucky, USA.
15Division of Hematology/Oncology, Medical University of South Carolina, Charleston, South Carolina, USA.
16The University of Texas MD Anderson Cancer Center, Houston, Texas, USA.
Address correspondence to: Trisha Wise-Draper, Division of Hematology/Oncology, University of Cincinnati Vontz Center for Molecular Studies, 3125 Eden Avenue, ML 0562, Cincinnati, Ohio, 45267, USA. Phone: 513.558.2826; Email: wiseth@ucmail.uc.edu. Or to: Yaping Liu, Department of Biochemistry and Molecular Genetics, Feinberg School of Medicine, Northwestern University, Robert H. Lurie Comprehensive Cancer Center of Northwestern University, 303 E Superior Street, 7-304, Chicago, Illinois, 60611, USA. Phone: 312. 503.1699; Email: lyping1986@gmail.com.
Find articles by Dunlap, N. in: PubMed | Google Scholar
1Department of Biochemistry and Molecular Genetics, Feinberg School of Medicine, Northwestern University, Chicago, Illinois, USA.
2Robert H. Lurie Comprehensive Cancer Center of Northwestern University, Chicago, Illinois, USA.
3Division of Human Genetics, Cincinnati Children’s Hospital Medical Center, Cincinnati, Ohio, USA.
4Division of Hematology/Oncology, and
5Department of Pathology, University of Cincinnati, Cincinnati, Ohio, USA.
6Department of Biostatistics and Bioinformatics, Moffitt Cancer Center, Tampa, Florida, USA.
7Department of Pediatrics, University of Cincinnati College of Medicine, Cincinnati, Ohio, USA.
8Division of Biostatistics and Epidemiology, Cincinnati Children’s Hospital Medical Center, Ohio, USA.
9Department of Preventive Medicine, Feinberg School of Medicine, Northwestern University, Chicago, Illinois, USA.
10Center for Craniofacial Molecular Biology, Herman Ostrow School of Dentistry, and Norris Comprehensive Cancer Center, University of Southern California, Los Angeles, California, USA.
11Division of Immunobiology, University of Cincinnati College of Medicine, Cincinnati, Ohio, USA.
12University of Michigan Cancer Center, Ann Arbor, Michigan, USA.
13Department of Otolaryngology, Ohio State University, Columbus, Ohio, USA.
14Department of Radiation Oncology, University of Louisville, Louisville, Kentucky, USA.
15Division of Hematology/Oncology, Medical University of South Carolina, Charleston, South Carolina, USA.
16The University of Texas MD Anderson Cancer Center, Houston, Texas, USA.
Address correspondence to: Trisha Wise-Draper, Division of Hematology/Oncology, University of Cincinnati Vontz Center for Molecular Studies, 3125 Eden Avenue, ML 0562, Cincinnati, Ohio, 45267, USA. Phone: 513.558.2826; Email: wiseth@ucmail.uc.edu. Or to: Yaping Liu, Department of Biochemistry and Molecular Genetics, Feinberg School of Medicine, Northwestern University, Robert H. Lurie Comprehensive Cancer Center of Northwestern University, 303 E Superior Street, 7-304, Chicago, Illinois, 60611, USA. Phone: 312. 503.1699; Email: lyping1986@gmail.com.
Find articles by Kaczmar, J. in: PubMed | Google Scholar
1Department of Biochemistry and Molecular Genetics, Feinberg School of Medicine, Northwestern University, Chicago, Illinois, USA.
2Robert H. Lurie Comprehensive Cancer Center of Northwestern University, Chicago, Illinois, USA.
3Division of Human Genetics, Cincinnati Children’s Hospital Medical Center, Cincinnati, Ohio, USA.
4Division of Hematology/Oncology, and
5Department of Pathology, University of Cincinnati, Cincinnati, Ohio, USA.
6Department of Biostatistics and Bioinformatics, Moffitt Cancer Center, Tampa, Florida, USA.
7Department of Pediatrics, University of Cincinnati College of Medicine, Cincinnati, Ohio, USA.
8Division of Biostatistics and Epidemiology, Cincinnati Children’s Hospital Medical Center, Ohio, USA.
9Department of Preventive Medicine, Feinberg School of Medicine, Northwestern University, Chicago, Illinois, USA.
10Center for Craniofacial Molecular Biology, Herman Ostrow School of Dentistry, and Norris Comprehensive Cancer Center, University of Southern California, Los Angeles, California, USA.
11Division of Immunobiology, University of Cincinnati College of Medicine, Cincinnati, Ohio, USA.
12University of Michigan Cancer Center, Ann Arbor, Michigan, USA.
13Department of Otolaryngology, Ohio State University, Columbus, Ohio, USA.
14Department of Radiation Oncology, University of Louisville, Louisville, Kentucky, USA.
15Division of Hematology/Oncology, Medical University of South Carolina, Charleston, South Carolina, USA.
16The University of Texas MD Anderson Cancer Center, Houston, Texas, USA.
Address correspondence to: Trisha Wise-Draper, Division of Hematology/Oncology, University of Cincinnati Vontz Center for Molecular Studies, 3125 Eden Avenue, ML 0562, Cincinnati, Ohio, 45267, USA. Phone: 513.558.2826; Email: wiseth@ucmail.uc.edu. Or to: Yaping Liu, Department of Biochemistry and Molecular Genetics, Feinberg School of Medicine, Northwestern University, Robert H. Lurie Comprehensive Cancer Center of Northwestern University, 303 E Superior Street, 7-304, Chicago, Illinois, 60611, USA. Phone: 312. 503.1699; Email: lyping1986@gmail.com.
Find articles by Gillison, M. in: PubMed | Google Scholar
1Department of Biochemistry and Molecular Genetics, Feinberg School of Medicine, Northwestern University, Chicago, Illinois, USA.
2Robert H. Lurie Comprehensive Cancer Center of Northwestern University, Chicago, Illinois, USA.
3Division of Human Genetics, Cincinnati Children’s Hospital Medical Center, Cincinnati, Ohio, USA.
4Division of Hematology/Oncology, and
5Department of Pathology, University of Cincinnati, Cincinnati, Ohio, USA.
6Department of Biostatistics and Bioinformatics, Moffitt Cancer Center, Tampa, Florida, USA.
7Department of Pediatrics, University of Cincinnati College of Medicine, Cincinnati, Ohio, USA.
8Division of Biostatistics and Epidemiology, Cincinnati Children’s Hospital Medical Center, Ohio, USA.
9Department of Preventive Medicine, Feinberg School of Medicine, Northwestern University, Chicago, Illinois, USA.
10Center for Craniofacial Molecular Biology, Herman Ostrow School of Dentistry, and Norris Comprehensive Cancer Center, University of Southern California, Los Angeles, California, USA.
11Division of Immunobiology, University of Cincinnati College of Medicine, Cincinnati, Ohio, USA.
12University of Michigan Cancer Center, Ann Arbor, Michigan, USA.
13Department of Otolaryngology, Ohio State University, Columbus, Ohio, USA.
14Department of Radiation Oncology, University of Louisville, Louisville, Kentucky, USA.
15Division of Hematology/Oncology, Medical University of South Carolina, Charleston, South Carolina, USA.
16The University of Texas MD Anderson Cancer Center, Houston, Texas, USA.
Address correspondence to: Trisha Wise-Draper, Division of Hematology/Oncology, University of Cincinnati Vontz Center for Molecular Studies, 3125 Eden Avenue, ML 0562, Cincinnati, Ohio, 45267, USA. Phone: 513.558.2826; Email: wiseth@ucmail.uc.edu. Or to: Yaping Liu, Department of Biochemistry and Molecular Genetics, Feinberg School of Medicine, Northwestern University, Robert H. Lurie Comprehensive Cancer Center of Northwestern University, 303 E Superior Street, 7-304, Chicago, Illinois, 60611, USA. Phone: 312. 503.1699; Email: lyping1986@gmail.com.
Find articles by El-Gamal, D. in: PubMed | Google Scholar
1Department of Biochemistry and Molecular Genetics, Feinberg School of Medicine, Northwestern University, Chicago, Illinois, USA.
2Robert H. Lurie Comprehensive Cancer Center of Northwestern University, Chicago, Illinois, USA.
3Division of Human Genetics, Cincinnati Children’s Hospital Medical Center, Cincinnati, Ohio, USA.
4Division of Hematology/Oncology, and
5Department of Pathology, University of Cincinnati, Cincinnati, Ohio, USA.
6Department of Biostatistics and Bioinformatics, Moffitt Cancer Center, Tampa, Florida, USA.
7Department of Pediatrics, University of Cincinnati College of Medicine, Cincinnati, Ohio, USA.
8Division of Biostatistics and Epidemiology, Cincinnati Children’s Hospital Medical Center, Ohio, USA.
9Department of Preventive Medicine, Feinberg School of Medicine, Northwestern University, Chicago, Illinois, USA.
10Center for Craniofacial Molecular Biology, Herman Ostrow School of Dentistry, and Norris Comprehensive Cancer Center, University of Southern California, Los Angeles, California, USA.
11Division of Immunobiology, University of Cincinnati College of Medicine, Cincinnati, Ohio, USA.
12University of Michigan Cancer Center, Ann Arbor, Michigan, USA.
13Department of Otolaryngology, Ohio State University, Columbus, Ohio, USA.
14Department of Radiation Oncology, University of Louisville, Louisville, Kentucky, USA.
15Division of Hematology/Oncology, Medical University of South Carolina, Charleston, South Carolina, USA.
16The University of Texas MD Anderson Cancer Center, Houston, Texas, USA.
Address correspondence to: Trisha Wise-Draper, Division of Hematology/Oncology, University of Cincinnati Vontz Center for Molecular Studies, 3125 Eden Avenue, ML 0562, Cincinnati, Ohio, 45267, USA. Phone: 513.558.2826; Email: wiseth@ucmail.uc.edu. Or to: Yaping Liu, Department of Biochemistry and Molecular Genetics, Feinberg School of Medicine, Northwestern University, Robert H. Lurie Comprehensive Cancer Center of Northwestern University, 303 E Superior Street, 7-304, Chicago, Illinois, 60611, USA. Phone: 312. 503.1699; Email: lyping1986@gmail.com.
Find articles by Wise Draper, T. in: PubMed | Google Scholar
1Department of Biochemistry and Molecular Genetics, Feinberg School of Medicine, Northwestern University, Chicago, Illinois, USA.
2Robert H. Lurie Comprehensive Cancer Center of Northwestern University, Chicago, Illinois, USA.
3Division of Human Genetics, Cincinnati Children’s Hospital Medical Center, Cincinnati, Ohio, USA.
4Division of Hematology/Oncology, and
5Department of Pathology, University of Cincinnati, Cincinnati, Ohio, USA.
6Department of Biostatistics and Bioinformatics, Moffitt Cancer Center, Tampa, Florida, USA.
7Department of Pediatrics, University of Cincinnati College of Medicine, Cincinnati, Ohio, USA.
8Division of Biostatistics and Epidemiology, Cincinnati Children’s Hospital Medical Center, Ohio, USA.
9Department of Preventive Medicine, Feinberg School of Medicine, Northwestern University, Chicago, Illinois, USA.
10Center for Craniofacial Molecular Biology, Herman Ostrow School of Dentistry, and Norris Comprehensive Cancer Center, University of Southern California, Los Angeles, California, USA.
11Division of Immunobiology, University of Cincinnati College of Medicine, Cincinnati, Ohio, USA.
12University of Michigan Cancer Center, Ann Arbor, Michigan, USA.
13Department of Otolaryngology, Ohio State University, Columbus, Ohio, USA.
14Department of Radiation Oncology, University of Louisville, Louisville, Kentucky, USA.
15Division of Hematology/Oncology, Medical University of South Carolina, Charleston, South Carolina, USA.
16The University of Texas MD Anderson Cancer Center, Houston, Texas, USA.
Address correspondence to: Trisha Wise-Draper, Division of Hematology/Oncology, University of Cincinnati Vontz Center for Molecular Studies, 3125 Eden Avenue, ML 0562, Cincinnati, Ohio, 45267, USA. Phone: 513.558.2826; Email: wiseth@ucmail.uc.edu. Or to: Yaping Liu, Department of Biochemistry and Molecular Genetics, Feinberg School of Medicine, Northwestern University, Robert H. Lurie Comprehensive Cancer Center of Northwestern University, 303 E Superior Street, 7-304, Chicago, Illinois, 60611, USA. Phone: 312. 503.1699; Email: lyping1986@gmail.com.
Find articles by Liu, Y. in: PubMed | Google Scholar
Published May 19, 2026 - More info
J Clin Invest. 2026;136(13):e196284. https://doi.org/10.1172/JCI196284.
© 2026 Bandaru et al. This work is licensed under the Creative Commons Attribution 4.0 International License. To view a copy of this license, visit http://creativecommons.org/licenses/by/4.0/.
Received: October 20, 2025; Accepted: May 12, 2026

-
Results
Generation of cfDNA WGS from longitudinal plasma samples in a multi-institutional phase II trial. Our cohort comprised 68 patients from the original cohort of 92 patients with locally advanced, surgically resectable HNSCC who had available plasma samples and were enrolled in a prospective, multi-institutional phase II clinical trial. For a subset of patients in the original cohort, only whole blood was collected, and these samples were excluded because genomic DNA contamination precludes accurate cfDNA fragmentation profiling. Thus, the current cohort spanned 6 academic institutes and included 40 clinical full or partial responders and 28 nonresponders, as determined by treatment effect (TE) (see Methods), with no significant differences in demographic or clinical variables between the response groups (Table 1, Figure 1, and Supplemental Table 1; supplemental material available online with this article; https://doi.org/10.1172/JCI196284DS1). All patients received a single 200 mg i.v. dose of neoadjuvant pembrolizumab, followed by surgical resection and adjuvant radiotherapy (60–66 Gy). High-risk patients received concurrent weekly cisplatin (40 mg/m2), and all patients were eligible to receive postoperative pembrolizumab for up to 7 total doses. Plasma (0.5 mL) was collected at 3 defined clinical time points: prior to neoadjuvant therapy (screen), the day of surgery (day 0), and 3–10 weeks after surgery (adjuvant week 1).
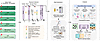 Figure 1
Experimental design and analytical workflow for the HNSCC cohort. Patients with head and HNSCC underwent surgical tumor resection and pembrolizumab immunotherapy, followed by adjuvant radiation therapy (60–66 Gy over 6 weeks) and cisplatin (40 mg/m2) for high-risk pathological features. A total of 185 blood samples were collected at defined intervals throughout the course of treatment and follow-up from 68 patients across 6 institutions (UC, U-M, OSU, MUSC, MDACC, and UofL). Plasma-derived circulating cfDNA was isolated from blood samples collected at 3 different time points (screen, day 0, and adjuvant week 1) and subjected to WGS. Fragmentation features were extracted using FinaleToolkit, including MDS, single genome-wide summary score), rMDS, end-motif frequencies, DELFI, genome-wide coverage, and fragment length distributions. CV, cross-validation.
Of the 185 cfDNA WGS libraries generated from plasma samples, 176 met predefined quality control criteria (details are provided in Methods), achieving a median sequencing coverage of approximately 1.9× per sample (Supplemental Figure 1A and Supplemental Table 2). From these, 10 patients (i.e., 25 samples) were randomly set aside as a prespecified holdout set for the later evaluation of the machine learning model, and the analysts remained blinded to these samples. The remaining 151 samples from 58 patients constituted the analysis dataset used for all subsequent analyses, including unsupervised rMDS clustering, differential rMDS analysis, and machine learning model training and cross-validation (Supplemental Figure 1B). The pre-holdout set of 25 samples from 10 patients was reserved exclusively for the evaluation of model generalizability and was not used in any upstream analyses. Forty-one patients provided samples across all 3 longitudinal time points, with sample distribution approximately balanced among visits (Supplemental Figure 2A). Samples from the University of Cincinnati (UC) constituted a greater proportion (48%) compared with other institutions (Supplemental Figure 2B). Responders and nonresponders were balanced in the analysis set. Technical metadata, including cfDNA isolation and library preparation dates, showed no systematic biases or imbalances between the analysis set and the pre-holdout set (Supplemental Figure 2, C and D).
Unsupervised analysis of rMDS distinguishes immunotherapy responders from nonresponders. We first examined whether differences in fragmentation patterns existed between responders and nonresponders. Given the low sequencing coverage, we partitioned the reference genome into nonoverlapping bins of 500 kb. Within each genomic bin, we utilized FinaleToolkit (21) to extract standard fragmentomic features, including fragment length, fragment coverage corrected for guanine + cytosine% (G+C%) content bias, and DELFI. Additionally, FinaleToolkit was used to compute genome-wide summary statistics for each sample, including frequencies of 5′ end motifs (n = 256) and MDS (n = 1) (18). Copy number variations (CNVs) for each genomic bin and tumor fractions for each sample were calculated using ichorCNA (22). To isolate the response-associated variance, we removed potential batch effects arising from plasma collection sites, cfDNA isolation procedures, and library preparation dates (details are provided in Methods; Supplemental Figure 3). Despite these analyses, none of these features demonstrated the separations between responders and nonresponders (silhouette scores 0.015–0.077; Supplemental Figure 4 and Supplemental Table 3).
A recent study has reported differences in genome-wide MDSs between patients with HNSCC and healthy individuals (18). However, the genome-wide MDS represents only a single aggregated metric of the variations in cfDNA 5′ end motifs. Given that the 5′ end of cfDNA fragments strongly correlates with cellular epigenetic profiles (18, 23), which vary substantially across genomic regions and reflect underlying gene-regulatory mechanisms (24, 25), evaluating end-motif diversity variations at a regional level across the genome could better capture this biological complexity. To address this, we developed a fragmentomic metric, termed the rMDS, which extends the genome-wide MDS by quantifying variations in the Shannon entropy of 5′ end 4 mer motifs across distinct genomic regions (Figure 2A). Remarkably, after correcting for batch effects, the z score transformed rMDS value effectively and unbiasedly discriminated immunotherapy responders from nonresponders in our cohort (Figure 2B). Interestingly, rMDS could differentiate between these 2 groups even at the pretreatment screening time point, suggesting that baseline differences in cellular epigenetic states may predict responsiveness to immunotherapy (Figure 2C). The greatest separation was observed at the most recent sample collection time point (adjuvant week 1, silhouette score = 0.327) compared with day 0 (silhouette score = 0.297) and screening (silhouette score = 0.261).
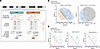 Figure 2
rMDS distinguishes immunotherapy responders from nonresponders. (A) Schematic representation of rMDS calculation: cfDNA 5′ end motifs are quantified within 500 kb genomic bins, and Shannon entropy is computed to yield rMDS, preserving regional information relative to genome-wide MDS. (B) UMAP visualization demonstrates clear separation of responders and nonresponders based on rMDS from 5′ end motifs that are related to cfDNA fragmentation, with minimal separation observed using 3′ end motifs as the control. (C) rMDS (5′ end motifs) profiles at screening, day 0, and adjuvant week 1 also independently separate responders from nonresponders. Silhouette scores quantify cluster separation. Ellipses represent approximately 2 SDs from group centroids.
It is possible that the observed separation between the 2 groups could be attributed to potential batch effects specifically related to nucleotide sequence context or confounding changes in the overall nucleotide composition of cfDNA fragments, rather than genuine fragmentation patterns at the 5′ end. To address these concerns, we calculated the rMDS control based on 3′ end 4 mer motifs, which are not reported to be related to cfDNA fragmentation by the standard WGS approach we used. As expected, we found no differences in the 3′ end rMDS control between responders and nonresponders (silhouette score = 0.07), suggesting that the observed group separation by the 5′ end rMDS was not confounded by sequence composition or other technical effects (Figure 2B).
To assess the effect of sequencing depth on rMDS estimation, we performed empirical downsampling using the deeply sequenced BH01 cfDNA dataset from Snyder et al. (13) (~56× effective coverage). Reads were downsampled to 50×, 25×, 10×, 5×, 2×, 1×, and 0.1× coverage, and 500 kb rMDS profiles were recalculated (Supplemental Figure 6). Correlation with the full-depth reference increased monotonically with coverage, reaching r = 0.93 at 5× and remaining high at approximately 2× (r = 0.82), comparable to our study (~1.9×). Substantial decreases in correlation with the full-depth reference occurred only at extreme downsampling (0.1×). Downsampling of patient samples similarly demonstrated preserved responder/nonresponder discrimination at moderate reductions in coverage (silhouette scores = 0.3–0.42), with deterioration only at very low depth (silhouette score = 0.151; Supplemental Figure 7). These results suggest that, while deeper sequencing improved precision, a biologically meaningful rMDS structure was retained at the coverage used in our study.
We further evaluated the optimal k mer choice (Supplemental Figure 8). The 4 mer model demonstrated the strongest group separation (silhouette score = 0.3). Shorter 3 mers probably lacked sufficient sequence complexity, whereas 5 and 6 mers greatly expanded the feature space (1,024–4,096 different end motifs), resulting in sparse counts per end-motif type in each genomic bin at our sequencing depth (~1–4 fragments per end-motif type in each bin) and, thus, unstable entropy estimation. Therefore, 4 mers provided an optimal balance between contextual information and statistical robustness under the current low-coverage conditions.
Longitudinal dynamics of differential rMDS patterns reveal telomere-associated fragmentation shifts. To identify genomic regions with differential rMDS patterns, we conducted a genome-wide comparative analysis of rMDS between immunotherapy responders and nonresponders. Besides the technical batch effect, other clinical variables, such as age and sex, could also affect the cfDNA fragmentation status. We further used a linear mixed-effects modeling approach to account for repeated measures across time points and different clinical covariates, including age, race, sex, ethnicity, diagnosis, smoking status, and alcohol use (details in Methods). After the correction for multiple hypothesis testing, we identified 1,080 significantly differential 500 kb bins (q < 0.1, Supplemental Table 4), including 545 genomic bins showing higher rMDSs in nonresponders and 535 bins showing lower rMDSs (Figure 3A). To explore the longitudinal dynamics of these differential rMDS regions, we applied joint hierarchical clustering to z score–transformed rMDS values measured across 3 longitudinal time points in the same patients (Figure 3B).
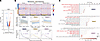 Figure 3
Differential rMDS regions between immunotherapy responders and nonresponders. (A) Volcano plot of differential rMDS genomic bins between responders and nonresponders across all samples. Regions with significantly increased or decreased motif diversity in responders are highlighted (linear mixed-effects model with empirical Bayes moderation; FDR <0.1). (B) Heatmap of differentially enriched rMDS regions across 3 time points (screen, day 0, adjuvant [Adj] week 1) reveals distinct longitudinal dynamics between responders and nonresponders, stratified by cluster. Middle panel: Line plots show the mean z score trajectory over time for each cluster, separated by response status. Bottom panel: Normalized density of distances from each rMDS region to the nearest chromosome end for each cluster, compared with a null distribution. P values indicate 1-sided Mann-Whitney U tests assessing whether the actual distribution was significantly closer to chromosome ends than the null. (C) GO enrichment analysis of differential rMDS clusters. Enrichment was tested using g:Profiler (hypergeometric test with FDR correction). The top 10 terms by fold enrichment are shown.
This clustering approach yielded 3 distinct clusters, each characterized by unique dynamic patterns of the rMDS. Cluster 1 showed the most pronounced divergence in rMDSs between responders and nonresponders, with initially large differences at screening that narrowed at day 0 before separating again by adjuvant week 1. Cluster 2 consistently showed higher rMDSs in nonresponders across all time points, whereas cluster 3 demonstrated the opposite pattern (Figure 3B).
Because the differential regions were defined using a statistical model that jointly evaluated response-associated differences across all time points while adjusting for patient-level covariates, we further examined the trajectories using covariate-corrected rMDS values. Consistent with the model results, visualization of covariate-adjusted signals confirmed substantial differences between responders and nonresponders for all 3 clusters (Supplemental Figure 9), supporting the robustness of the identified differential regions. These analyses clarify that the regions identified by the mixed-effects model captured longitudinal response-associated effects that may not have been fully apparent when visualizing unadjusted, only technically corrected, rMDS values alone.
Intrigued by the genomic locations of these clusters, we performed enrichment analysis. Remarkably, cluster 1 regions were significantly enriched near telomeric regions (Mann-Whitney P = 5.8 × 10⁻¹⁵, permutation P < 1 × 10⁻⁵), a feature absent in clusters 2 and 3 (Figure 3B). These findings suggest that distinct fragmentation dynamics near telomeric chromatin may be associated with the immunotherapy response.
Gene ontology analysis links longitudinal dynamics of differential rMDS patterns to immune, lectin signaling, and keratinization programs. Next, we sought to characterize the genes enriched in differential rMDS regions exhibiting distinct longitudinal dynamics. Gene ontology (GO) analysis identified unique functional signatures across rMDS clusters related to both immune system components and HNSCC tumor biology (Figure 3C and Supplemental Table 5). Specifically, cluster 1 was characterized by enrichment in keratinization, a defining histologic hallmark of squamous cell carcinomas, which constitute the predominant form of head and neck cancers. Particularly, the extent and type of keratinization were known to have prognostic value and were linked to differential survival outcomes (26–32). Cluster 2 was predominantly enriched for IL-1 and centromere protein A–related (CENPA-related) terms. Previous studies indicate that IL-1 signaling has been related to tumor growth and metastasis in HNSCC (33). Moreover, subnuclear patterns of CENPA have been shown to be correlated with immunotherapy responses in other cancer types (34) and chemotherapy disease curability in patients with HNSCC (35). Cluster 3 was characterized by enrichment in lectin signaling; previous studies have shown that genes within this group, such as KLRK1, are highly expressed in HNSCC and are linked to favorable prognosis and increased immune cell infiltration (36).
Representative rMDS z score trajectories at selected genomic loci further illustrated these patterns. A cluster 3 region located at chr12:52.0–52.5 Mb, encompassing keratin genes (e.g., KRT7, KRT86, and KRT85), showed an increase in rMDS in responders and a decrease in rMDS in nonresponders (Supplemental Figure 10). Another telomeric cluster 1 region at chr9:135.5–137.5 Mb demonstrated similar diverging trends (Supplemental Figure 10). Furthermore, loci enriched for CENPA-related and lectin signaling–related genes from clusters 2 and 3 displayed distinct group-specific fragmentation dynamics (Supplemental Figure 11).
rMDS-based predictive modeling robustly discriminates immunotherapy responders across multiple validation scenarios. We next explored the potential of rMDS as a composite biomarker for predicting immunotherapy responses in patients with HNSCC. To mitigate overfitting due to limited sample sizes, we applied singular value decomposition (SVD) to genome-wide rMDS values, reducing feature dimensionality. Additionally, we utilized the Tabular Prior-data Fitted Network (TabPFN) classifier, which is specifically designed for machine learning studies with small sample sizes (37). Patient-level predictions were obtained using the most recent available time point, since our unsupervised analysis suggested greater rMDS separation at more recent time points (Figure 2C and Figure 4A).
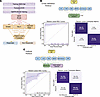 Figure 4
Predicting immunotherapy responses in HNSCC using rMDS. (A) Overview of the rMDS-based machine learning pipeline. Dimensionality reduction was first applied using truncated SVD. Dimensionality reduction was performed by truncated SVD, and reduced features were used to train TabPFN models. Patient-level probabilities were obtained by using the most recent available time point, then binarized as responder or nonresponder. (B) Cross-validation strategy. Models were trained using a 10-fold patient-level cross-validation repeated 100 times. (C) Institute holdout evaluation strategy. For each iteration, one institute was held out entirely for testing while the model was trained on the remaining institutions. The average ROC curve (mean ± SD) and confusion matrix (mean ± SD) are shown.
We implemented a comprehensive 3-tier validation strategy to rigorously evaluate model performance under different scenarios. First, we assessed model accuracy through 10-fold patient-level cross-validation repeated 100 times on the analysis set. This approach yielded exceptional performance with a mean AUC of 0.99 ± 0.05 (Figure 4B). At 95% specificity, the model achieved 97.6% ± 10.1% sensitivity. Classification accuracy was consistently high across response categories, correctly identifying nonresponders 96.4% ± 13.0% of the time and responders 93.0% ± 15.4% of the time (Figure 4B). Sample-level analysis confirmed robust performance across all collection time points, with the highest AUC observed at adjuvant week 1 (0.99 ± 0.04), followed by screen (0.97 ± 0.09) and day 0 (0.95 ± 0.12) (Supplemental Figure 12 and Supplemental Table 6).
To evaluate real-world applicability in which samples originate from previously unseen institutions, we performed single-institute holdout validation within the analysis set (leave one institute out [LOIO]). Each institution was sequentially held out while training on samples from all other sites. This more stringent evaluation yielded a mean AUC of 0.89 ± 0.12 (Figure 4C), with a sensitivity of 75.3% ± 30.9% at 95% specificity. Classification accuracy remained robust, with correct identification of nonresponders and responders 81.9% ± 25.6% and 89.9% ± 14.6% of the time, respectively (Figure 4C). Consistent with previous analyses, adjuvant week 1 samples showed the highest discriminatory power (AUC = 0.94 ± 0.14), followed by screen (0.83 ± 0.15) and day 0 (0.82 ± 0.21) (Supplemental Figure 13 and Supplemental Table 7).
We assessed model generalizability by simulating the scenario of applying our predictor to entirely independent patient cohorts when the batch effects were not fully corrected. This pre-holdout analysis was included specifically to illustrate the effect of uncorrected technical variation on the predictive model. We randomly selected 10 patients (and their associated longitudinal samples) as a “pre-holdout” set across 100 iterations. This most stringent evaluation scenario yielded a mean AUC of 0.69 ± 0.19 (Supplemental Figure 14), with a sensitivity of 37.9% ± 27.0% at 95% specificity. While classification accuracy was more modest under these conditions, correctly identifying nonresponders 57.2% ± 26.5% of the time and responders 68.5% ± 20.0% of the time, performance remained above chance levels across all time points (AUC range: 0.67–0.68) (Supplemental Figure 15 and Supplemental Table 6). Together, these results demonstrate that when technical batch effects are properly accounted for, rMDS-based prediction models maintain robust performance under multiple validation conditions.
To further quantify the effect of batch correction on predictive performance, we directly compared model accuracy before and after correction in both cross-validation and institute holdout settings (Supplemental Figure 16). In the absence of correction, performance was markedly reduced (cross-validation mean AUC: 0.51 ± 0.28; institute holdout mean AUC: 0.64 ± 0.20). After correction, performance improved substantially (10-fold cross-validation mean AUC: 0.99 ± 0.05; institute holdout mean AUC: 0.89 ± 0.12).
Given the enrichment of telomeric and keratinization-associated loci in differential rMDS clusters, we also evaluated whether restricting features to these focal regions retained predictive value (Supplemental Figure 17). Models trained using rMDS derived exclusively from keratinization loci showed moderate discrimination (mean AUC = 0.67 ± 0.21), whereas telomere-proximal regions demonstrated improved performance (mean AUC = 0.76 ± 0.28). Combining keratinization and telomeric loci maintained comparable performance (mean AUC = 0.73 ± 0.32). These results suggest that specific biologically enriched regions harbor concentrated fragmentation signals that may serve as feature subsets for future biomarker development with increased coverage.
rMDS-based response predictions correlate with survival outcomes and enhance risk stratification. We next evaluated whether rMDS-based response predictions could serve as prognostic biomarkers. Five-year DFS and overall survival (OS) were analyzed according to the predicted response status using the single-institute holdout evaluation. Survival analyses were based on the predicted response status from the single-institute holdout evaluation, restricted to patients with available adjuvant week 1 samples. Notably, despite the single-institute holdout achieving 74.2% accuracy, patients predicted as responders exhibited significantly improved DFS compared with predicted nonresponders (log-rank test, P = 0.035; Figure 5A). This prognostic capability was superior to established biomarkers, as no significant differences were observed when using the PD-L1 combined positive score (CPS) (P = 0.97) or tumor fraction (P = 0.50) from the same patients. The rMDS predictions demonstrated a prognostic value comparable to that of pathological risk stratification (P = 0.013; Supplemental Figure 18).
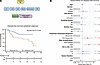 Figure 5
cfDNA rMDS-based model predicts clinical outcomes in patients with HNSCC treated with pembrolizumab. (A) DFS stratified by predicted treatment response (responder vs. nonresponder) using a cfDNA rMDS-based model with a single-institute holdout evaluation strategy. The global log-rank P value and risk table are shown. (B) HRs for DFS across clinical and demographic covariates, estimated by Cox proportional hazards regression (P values indicated).
For OS, although rMDS-predicted responders showed a trend toward improved outcomes (log-rank test, P = 0.197), this did not reach statistical significance. In comparison, neither the PD-L1 CPS (P = 0.52) nor the tumor fraction (P = 0.15) showed prognostic value for OS, whereas pathological risk remained significant (P = 0.002, Supplemental Figure 19, A–D). HR analysis revealed that rMDS-predicted nonresponders had significant HRs of 2.67 (95% CI: 1.03–6.92) for DFS, demonstrating the clinical utility of this biomarker approach. While no statistically significant HR was observed for OS with rMDS predictions (1.98, 95% CI: 0.69–5.74), pathological risk showed significant HRs for both DFS (3.31, 95% CI: 1.21–9.01) and OS (7.16, 95% CI: 1.62–31.6) (Figure 5B, Supplemental Figure 19E, and Supplemental Table 7). Since some patients may have experienced recurrence between neoadjuvant and adjuvant treatments, we further adjusted the survival time to reflect the months since neoadjuvant pembrolizumab initiation, and the results remained similar. (Supplemental Figures 20 and 21, and Supplemental Table 7).
These findings suggest that rMDS-based predictions may provide clinically meaningful risk stratification and short-term outcome prediction, outperforming conventional markers like PD-L1 CPS and tumor fraction and offering the potential to enhance future clinical risk stratification models.

-
Methods
Sex as a biological variable. Our study examined male and female individuals, and there was no significant effect of sex on the conclusion.
Study cohort and sample collection. This prospective, multi-institutional phase II clinical trial (NCT02641093) enrolled patients with newly diagnosed, surgically resectable, locally advanced HNSCC receiving neoadjuvant and adjuvant immunotherapy.
Patients were recruited from 6 academic centers: UC, University of Michigan (U-M), Ohio State University (OSU), Medical University of South Carolina (MUSC), MD Anderson Cancer Center (MDACC), and University of Louisville (UofL). Each patient received a single i.v. dose of pembrolizumab (200 mg) 7–21 days prior to surgery, followed by adjuvant radiotherapy (60–66 Gy in 30–33 fractions). High-risk patients received concurrent weekly cisplatin (40 mg/m2), and all patients were eligible for adjuvant pembrolizumab (200 mg i.v. every 3 weeks, up to 6 doses).
Eligibility criteria included age 18 years or older, newly diagnosed and histologically or cytologically confirmed HNSCC, and locally advanced disease classified as stage III or IV according to the American Joint Committee on Cancer (AJCC) 8th Edition (T3 or T4 tumor, ≥N2 nodal disease, or clinical evidence of extranodal extension [ENE] on imaging). Tumors had to be deemed resectable by the treating head and neck surgeon, with no involvement of the skull base or T4b stage. Additional inclusion criteria were an Eastern Cooperative Oncology Group (ECOG) performance status of 1 or less and adequate organ function.
Key exclusion criteria were human HPV+ oropharyngeal cancer (HPV+ disease outside the oropharynx was permissible, although HPV testing was not mandatory), nasopharyngeal cancer, metastatic disease (as determined by chest CT or PET/CT), autoimmune disease, active intercurrent illness (including significant cardiovascular disease, active viral infections, or major psychiatric illness), and steroid use exceeding prednisone 10 mg daily. For comprehensive details, refer to the original study (19).
Peripheral blood collected at the first 3 time points was used in this study: (a) pretreatment screening (screen); (b) immediately after surgical resection (day 0); and (c) approximately 3–10 weeks following surgery (adjuvant week 1). We included all plasma samples available from the trial for cfDNA analysis. Samples for which only whole blood was collected were excluded, as genomic DNA contamination in whole-blood specimens can compromise the integrity of cfDNA fragmentation measurements.
Treatment response and pathological risk determination. The pathological response to neoadjuvant pembrolizumab was evaluated by centralized histopathological analysis. Resected tumor specimens were assessed by experienced pathologists for standard pathological risk features, including extracapsular nodal extension (ENE), margin status, lymphovascular invasion, perineural invasion, and the number of involved lymph nodes. For comprehensive details, refer to the original study (19).
The primary metric for treatment response was the pathological TE, defined as tumor necrosis accompanied by histiocytic inflammation and/or giant cell reaction to keratinaceous debris. TE was quantified as the ratio of the area showing these features to the total area comprising residual viable tumor and the TE. Pathological response was classified as no response (TE <10%) or response (TE ≥10%), similar to previous studies (20, 43). The presence of positive surgical margins and/or ENE was used to define pathological risk. For comprehensive details, refer to the original study (19).
Plasma processing and cfDNA extraction. Peripheral blood was shipped overnight, and cfDNA was isolated from 500 μL plasma, with all samples stored at –80°C prior to processing. Before isolation, plasma samples were thawed on ice, centrifuged at 1,600g for 10 minutes at 4°C, and then subjected to a second centrifugation at 16,000g for 10 minutes at 4°C to remove residual cell debris. cfDNA extraction was performed using the MagMAX Cell-Free DNA Isolation Kit (Applied Biosystems) following the manufacturer’s protocol. cfDNA concentration and size distribution were measured using Qubit (Invitrogen, Thermo Fisher Scientific) and BioAnalyzer (Agilent Technologies), respectively. For each patient, plasma samples collected at 3 different time points were processed together within the same isolation batch.
cfDNA WGS. cfDNA samples were randomly allocated into 8 library preparation batches, ensuring that all time points from each patient were included in the same batch. Library preparation was performed on 1 ng cfDNA using the KAPA HyperPrep Kit (Roche) and NEXTFLEX Unique Dual Index Barcodes (PerkinElmer; 300 nM final concentration). Sequencing was carried out on the Illumina NovaSeq 6000 S4 platform using paired-end 150 bp reads (PE150).
Data preprocessing of cfDNA WGS data. Raw sequencing data were processed using the FinaleDB Workflow (44) (https://github.com/epifluidlab/finaledb_workflow), implemented via Snakemake (version 7.8.0) (45). Specifically, paired-end FASTQ files underwent adapter trimming with Trimmomatic (version 0.39) (46), followed by alignment to the human reference genome (hg38) using BWA-MEM (version 0.7.15) (47) with default parameters. PCR duplicates were removed with samblaster (version 0.1.24) (48). Reads were retained if both ends were uniquely mapped, properly paired, nonsupplemental, and had a mapping quality of 30 or greater. Only autosomal fragments of 50–350 bp in length were included. Reads overlapping ENCODE blacklist regions (49) (hg38) were excluded to eliminate mapping artifacts.
rMDS. The autosome genome was divided into 500 kb nonoverlapped bins. For each 500 kb bin j, the raw rMDS was defined as the normalized Shannon entropy of 5′ end 4 mer motifs:
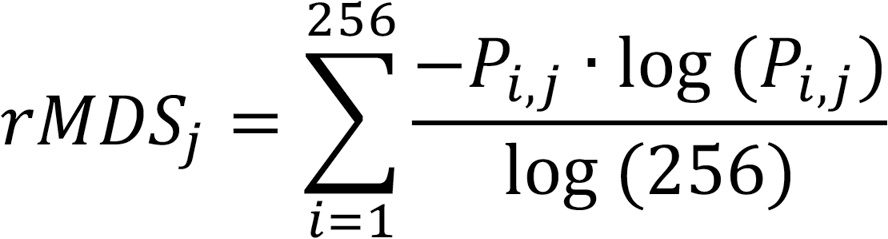
where Pi,j is the relative frequency of the ith 4 mer end motif in bin j. Normalization by log(256) ensures that the score ranges from 0 (minimum diversity) to 1 (maximum diversity). The resulting rMDS values were then z score transformed across all bins in each sample,
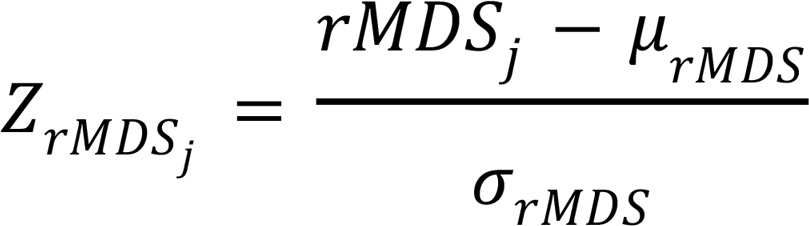
where μrMDS and σrMDS denote the mean and SD of rMDS values across the genome, respectively. These z-transformed values were used in all downstream analyses. The 500 kb bin size provided a balance between genomic resolution and fragment count per bin (~2 × 10⁴ fragments/bin at 1.9× coverage).
Other cfDNA fragmentation feature extraction. Additional fragmentation features were extracted from preprocessed BED and BAM files using FinaleToolkit (version 0.10.7) (21). The autosomal genome was divided into nonoverlapping 500 kb bins using Bedtools (version 2.31.1) (50), excluding low-mappability regions identified by the UCSC 45 mer mappability track (hg38) (51). Fragment-level BED files were used to calculate: (a) fragment length distributions, (b) 4 mer fragment end-motif frequencies, (c) global MDSs, and (d) DELFI scores (with the --no merge-bins option). GC-corrected coverage values were derived from DELFI-corrected fragment counts. For copy number and tumor fraction analyses, BAM files were processed using ichorCNA (version 0.2.0) (22) with hg38 genome settings at the same resolution.
Batch correction and dimensionality reduction. Batch correction of rMDS values and other fragmentomic features was performed using a linear model adapted from the limma framework (52). For each 500 kb genomic bin, rMDS values were modeled as a function of cfDNA isolation date, WGS library preparation date, and collection institute, with treatment response (responder vs. nonresponder) included as a preserved biological covariate. Design matrices employed sum contrasts via the patsy.contrasts.sum method (patsy version 0.5.6). Linear coefficients were estimated on the analysis set (including the Institute Holdout set) using ordinary least squares, and batch effects were regressed out. To preserve the independence of the pre-holdout set, batch correction was performed by applying the design matrix contrasts and regression coefficients learned from the analysis set. No parameters were re-estimated using pre-holdout data. Matrix operations were implemented with NumPy (version 1.26.4) (53) and pandas (version 2.2.2) (54).
Corrected matrices were standardized using z score normalization (StandardScaler, scikit-learn version 1.5.2) (55). Dimensionality reduction was conducted using truncated SVD (numpy.linalg.svd) (53), with components selected according to the singular value spectrum and variance explained (Supplemental Figure 5).
Low-dimensional embeddings were generated using UMAP (umap-learn version 0.5.7; metric=’cosine’, n_neighbors=50, min_dist=0.5) (56). Confidence ellipses (2 SD) for each group were constructed from the eigen decomposition of the covariance matrix, and ellipse intersections were computed using Shapely (version 2.1.0). Visualizations were produced with Matplotlib (version 3.8.3) (57) and Seaborn (version 0.13.2) (58). To quantify the quality and stability of the resulting clusters, specifically the separation between responders and nonresponders, we calculated Silhouette scores. The Silhouette score for each sample was computed as (b − a)/max(a,b), where a is the mean intracluster distance and b is the mean distance to the nearest neighboring cluster.
Sequencing depth and stability analysis. To evaluate the effect of sequencing depth on rMDS, we used a reference cfDNA WGS sample from BH01 in Snyder et al. (13) (56× effective coverage) and performed empirical downsampling to 50×, 25×, 10×, 5×, 2×, 1×, and 0.1× effective coverage. Pearson correlation coefficients were computed between each downsampled profile and the 56× reference to assess signal recovery. Additionally, responder and nonresponder samples were downsampled to assess the stability of group-level biological discrimination across varying depths.
Differential analysis of rMDS. Differential analysis of rMDS between treatment responders and nonresponders was performed using the limma (52) package in R with a linear mixed-effects modeling approach to account for repeated measures across time points. A global design matrix incorporating treatment response group and clinical covariates (age, race, sex, ethnicity, diagnosis, smoking, alcohol use) was constructed, with within-patient correlation estimated using patient ID as a blocking variable and array-specific weights applied to handle variance heterogeneity. Linear models were fitted using empirical Bayes moderation, and raw P values were corrected for multiple testing using q values to control the FDR. Genomic bins with q values of less than 0.1 were considered significantly differential between responders and nonresponders.
Clustering and chromosomal enrichment of differential rMDS regions. Using clinical covariate-corrected (Supplemental Figure 9) and uncorrected rMDS data (Figure 3), differential 500 kb bins were clustered based on rMDS values across the 3 time points (screen, day 0, adjuvant week 1). Genomic bins (columns) were hierarchically clustered using Ward’s method (scipy.cluster.hierarchy.linkage) (59), with clusters determined via fcluster (t=3, criterion=’maxclust’). Patient rows were independently clustered within each treatment group. Heatmaps were generated with Marsilea (version 0.5.1) (60).
For each cluster, the average rMDS trajectory across time points was computed and stratified by response group. Longitudinal patterns were visualized as line plots (Seaborn, version 0.13.2, ci=95) (58).
Telomeric enrichment was assessed by calculating the distance from each bin midpoint to the nearest chromosome end using hg38.chrom.sizes (UCSC) (51). For each cluster, the empirical distance distribution was compared with a null distribution generated from 100,000 randomly sampled 500 kb bins, using a 1-sided Mann-Whitney U test (scipy.stats.mannwhitneyu) (59) and a permutation test to determine whether observed distances were significantly shorter than expected. Density plots were generated with kernel density estimation (scipy.stats.gaussian_kde) (59), normalized for comparison.
Gene ontology and pathway enrichment analysis of differential rMDS regions. Functional enrichment analysis was performed for each rMDS cluster using g:Profiler (version e112_eg59_p19_25aa4782) (61). Genomic bins were mapped to nearby genes using default Ensembl annotations. Enrichment of GO Biological Process and Reactome pathway terms was tested, and fold enrichment was calculated as (intersection size/query size) divided by (term size/effective domain size). The top 10 significant enriched terms with the highest fold changes were visualized in the main figure.
Locus-specific visualization of differential rMDS signal profiles. Genome-wide sliding windows of 500 kb (step size: 10 kb) were generated. Basically, fragment end-motif profiles were computed using the interval-end-motifs and rmds modules from FinaleToolkit (version 0.10.7) (21) in each 10 kb window using the rMDS value within the nearby 500 kb window (± 250 kb from the center of 10 kb window). Signal matrices were z score normalized, batch corrected, and averaged by group (response and time point). Visualization was performed with IGV (version 2.19.2) (62), using color-coded overlays to differentiate response groups and time points.
Machine learning classification of the treatment response. To evaluate the predictive power of rMDS features, models were trained using TabPFNClassifier (tabpfn version 2.0.8) (37). Input matrices were batch-corrected, z score normalized, and reduced via truncated SVD (scikit-learn version 1.5.2, n_components=6) (55). Model performance was assessed using ROC AUC, accuracy, F1 score, precision, recall, and balanced accuracy. Patient-level predictions were obtained using the most recent available time point (adjuvant week 1 or day 0).
Model robustness was tested to evaluate the effect of random sampling by 3 approaches. (a) Cross-validation evaluation: The model underwent 100 rounds of 10-fold cross-validation at the patient level. In each round, patients were randomly divided into 10 groups, with 9 groups used for training and 1 group held out for testing. This process was repeated 10 times per round (rotating which group was held out) and then replicated 100 times with different random splits. (b) Single-institute holdout evaluation: The model was trained using data from 5 institutes, and then tested separately on data from the that was held out. (c) Pre-holdout evaluation: The model underwent 100 rounds of testing, in which 10 patients were randomly selected as the test set in each round. Importantly, any batch correction factors were learned only from the training set, ensuring the test remained truly independent.
Performance metrics were computed at both the sample and patient levels. ROC curves and confusion matrices were visualized using Seaborn (version 0.13.2) (56) and Matplotlib (version 3.8.3) (57).
Survival analysis. Survival analyses were performed in R (version 4.5.0) using survival (version 3.8.3) (63, 64). Kaplan-Meier estimates for DFS and OS were calculated, with time-to-event defined as days from the adjuvant week 1 dose. Patients missing this time point were excluded from downstream analysis.
PD-L1 expression was assessed using IHC. Formalin-fixed, paraffin-embedded tumor tissue samples were stained using the 22C3 antibody clone (Agilent Technologies, Dako) and evaluated with the FDA-approved PD-L1 IHC pharmDx assay. Testing was performed at Caris Life Sciences or NeoGenomics Laboratories and independently confirmed by a board-certified pathologist at the University of Cincinnati.
The CPS was calculated as follows: CPS = (number of PD-L1+ tumor cells + PD-L1+ immune cells) × 100/(total number of viable tumor cells). For comprehensive details, refer to the original study (19).
Survival analyses were stratified by the predicted treatment response (responder vs. nonresponder) from the single-institute holdout evaluation, pathological risk categories (intermediate vs. high), PD-L1 CPS categories (>20, 1–19, 0), and tumor fraction (low vs. high, dichotomized at the median). Kaplan-Meier survival curves were generated with accompanying risk tables showing the number of patients at risk. For group comparisons, log-rank tests were applied (63). Visualizations were created using ggplot2 (version 3.5.2) (65), with pairwise comparisons performed for multilevel groups.
Cox proportional hazards regression models were fitted to estimate HRs with 95% CIs. Univariate analyses were performed for age, sex, HPV status (determined by p16 IHC as a surrogate), smoking history, alcohol use, predicted response, risk stratification, PD-L1 expression, and tumor fraction. Results were considered statistically significant at a P value of less than 0.05.
Statistics. Cluster separation between immunotherapy responders and nonresponders was quantified using silhouette scores. Pearson correlation coefficients were used to assess agreement between downsampled and full-depth rMDS profiles. Telomeric enrichment of differential rMDS clusters was evaluated using 1-sided Mann-Whitney U and permutation tests. Differential rMDS analysis between responders and nonresponders was performed using linear mixed-effects models within the limma framework, with empirical Bayes moderation; multiple testing correction was applied using q values, with a FDR threshold of a q < 0.1. Kaplan-Meier survival curves were compared using log-rank tests, and HRs with 95% CIs were estimated using Cox proportional hazards regression. All other tests were 2 sided, and results were considered statistically significant at a P value of less than 0.05. Unless otherwise indicated (e.g., Figure 2B ellipses represent approximately 2 SDs from group centroids), data in figures are presented as mean ± SD. ROC curves and confusion matrices show mean ± SD across validation iterations; hazard ratios are shown with 95% confidence intervals. Kaplan-Meier estimates are shown with number-at-risk tables; log-rank P values are indicated.
Study approval. The study was approved by the IRBs of all participating sites: University of Cincinnati, Cincinnati, Ohio, USA; University of Michigan, Ann Arbor, Michigan, USA; The Ohio State University, Columbus, Ohio, USA; Medical University of South Carolina, Charleston, South Carolina, USA; The University of Texas MD Anderson Cancer Center, Houston, Texas, USA; and University of Louisville, Louisville, Kentucky, USA. The study was conducted in accordance with the Declaration of Helsinki and Good Clinical Practice guidelines. Written informed consent was obtained from all participants prior to study procedures.
Data availability. All analysis code is available at the study’s GitHub repository (https://github.com/epifluidlab/headneck). Supporting data values for all figures, including data points shown in graphs and values underlying reported means, are provided in the Supporting Data Values file. Raw WGS data from plasma cfDNA will be available in the European Genome-phenome Archive (EGA) with controlled access (accession code EGAS50000001286. Data access can be obtained through a request to the corresponding authors. The corresponding authors will generally respond to requests within 1 week. Once granted, the access has no time restriction. The raw sequencing data are protected by data privacy laws. The deidentified, post-processed fragment files are available in zenodo.org (doi: 10.5281/zenodo.15738112).


Copyright © 2026 American Society for Clinical Investigation
ISSN: 0021-9738 (print), 1558-8238 (online)