
Advertisement
Research ArticleAutoimmunityImmunology
Open Access |  10.1172/JCI199528
Identification of a systemic lupus erythematosus disease signature in resting naive B cells
James R. Rose,1 Yusho Ishii,2,3 Arezou Khosroshahi,2,3 Sakeenah Hicks,1 Scott A. Jenks,2,3 Christopher D. Scharer,1 Ignacio Sanz,2,3 and Jeremy M. Boss1
1Department of Microbiology and Immunology,
2Division of Rheumatology, Department of Medicine, and
3Lowance Center for Human Immunology, School of Medicine, Emory University, Atlanta, Georgia, USA.
Address correspondence to: Jeremy M. Boss, Department of Microbiology and Immunology, Emory University School of Medicine, 1510 Clifton Rd., NE, Atlanta, Georgia, 30322, USA. Email: jmboss@emory.edu. Or to: Ignacio Sanz, Department of Medicine, Division of Rheumatology, Lowance Center for Human Immunology, 247 Whitehead Research Bldg., Emory University School of Medicine, 615 Michael St. Atlanta, Georgia, 30322, USA. Email: ignacio.sanz@emory.edu.
Authorship note: JRR and YI contributed equally to this work and are co–first authors. IS and JMB contributed equally and are co–corresponding authors.
Find articles by Rose, J. in: PubMed | Google Scholar
1Department of Microbiology and Immunology,
2Division of Rheumatology, Department of Medicine, and
3Lowance Center for Human Immunology, School of Medicine, Emory University, Atlanta, Georgia, USA.
Address correspondence to: Jeremy M. Boss, Department of Microbiology and Immunology, Emory University School of Medicine, 1510 Clifton Rd., NE, Atlanta, Georgia, 30322, USA. Email: jmboss@emory.edu. Or to: Ignacio Sanz, Department of Medicine, Division of Rheumatology, Lowance Center for Human Immunology, 247 Whitehead Research Bldg., Emory University School of Medicine, 615 Michael St. Atlanta, Georgia, 30322, USA. Email: ignacio.sanz@emory.edu.
Authorship note: JRR and YI contributed equally to this work and are co–first authors. IS and JMB contributed equally and are co–corresponding authors.
Find articles by Ishii, Y. in: PubMed | Google Scholar
1Department of Microbiology and Immunology,
2Division of Rheumatology, Department of Medicine, and
3Lowance Center for Human Immunology, School of Medicine, Emory University, Atlanta, Georgia, USA.
Address correspondence to: Jeremy M. Boss, Department of Microbiology and Immunology, Emory University School of Medicine, 1510 Clifton Rd., NE, Atlanta, Georgia, 30322, USA. Email: jmboss@emory.edu. Or to: Ignacio Sanz, Department of Medicine, Division of Rheumatology, Lowance Center for Human Immunology, 247 Whitehead Research Bldg., Emory University School of Medicine, 615 Michael St. Atlanta, Georgia, 30322, USA. Email: ignacio.sanz@emory.edu.
Authorship note: JRR and YI contributed equally to this work and are co–first authors. IS and JMB contributed equally and are co–corresponding authors.
Find articles by Khosroshahi, A. in: PubMed | Google Scholar
1Department of Microbiology and Immunology,
2Division of Rheumatology, Department of Medicine, and
3Lowance Center for Human Immunology, School of Medicine, Emory University, Atlanta, Georgia, USA.
Address correspondence to: Jeremy M. Boss, Department of Microbiology and Immunology, Emory University School of Medicine, 1510 Clifton Rd., NE, Atlanta, Georgia, 30322, USA. Email: jmboss@emory.edu. Or to: Ignacio Sanz, Department of Medicine, Division of Rheumatology, Lowance Center for Human Immunology, 247 Whitehead Research Bldg., Emory University School of Medicine, 615 Michael St. Atlanta, Georgia, 30322, USA. Email: ignacio.sanz@emory.edu.
Authorship note: JRR and YI contributed equally to this work and are co–first authors. IS and JMB contributed equally and are co–corresponding authors.
Find articles by Hicks, S. in: PubMed | Google Scholar
1Department of Microbiology and Immunology,
2Division of Rheumatology, Department of Medicine, and
3Lowance Center for Human Immunology, School of Medicine, Emory University, Atlanta, Georgia, USA.
Address correspondence to: Jeremy M. Boss, Department of Microbiology and Immunology, Emory University School of Medicine, 1510 Clifton Rd., NE, Atlanta, Georgia, 30322, USA. Email: jmboss@emory.edu. Or to: Ignacio Sanz, Department of Medicine, Division of Rheumatology, Lowance Center for Human Immunology, 247 Whitehead Research Bldg., Emory University School of Medicine, 615 Michael St. Atlanta, Georgia, 30322, USA. Email: ignacio.sanz@emory.edu.
Authorship note: JRR and YI contributed equally to this work and are co–first authors. IS and JMB contributed equally and are co–corresponding authors.
Find articles by Jenks, S. in: PubMed | Google Scholar
1Department of Microbiology and Immunology,
2Division of Rheumatology, Department of Medicine, and
3Lowance Center for Human Immunology, School of Medicine, Emory University, Atlanta, Georgia, USA.
Address correspondence to: Jeremy M. Boss, Department of Microbiology and Immunology, Emory University School of Medicine, 1510 Clifton Rd., NE, Atlanta, Georgia, 30322, USA. Email: jmboss@emory.edu. Or to: Ignacio Sanz, Department of Medicine, Division of Rheumatology, Lowance Center for Human Immunology, 247 Whitehead Research Bldg., Emory University School of Medicine, 615 Michael St. Atlanta, Georgia, 30322, USA. Email: ignacio.sanz@emory.edu.
Authorship note: JRR and YI contributed equally to this work and are co–first authors. IS and JMB contributed equally and are co–corresponding authors.
Find articles by
Scharer, C.
in:
PubMed
|
Google Scholar
|

1Department of Microbiology and Immunology,
2Division of Rheumatology, Department of Medicine, and
3Lowance Center for Human Immunology, School of Medicine, Emory University, Atlanta, Georgia, USA.
Address correspondence to: Jeremy M. Boss, Department of Microbiology and Immunology, Emory University School of Medicine, 1510 Clifton Rd., NE, Atlanta, Georgia, 30322, USA. Email: jmboss@emory.edu. Or to: Ignacio Sanz, Department of Medicine, Division of Rheumatology, Lowance Center for Human Immunology, 247 Whitehead Research Bldg., Emory University School of Medicine, 615 Michael St. Atlanta, Georgia, 30322, USA. Email: ignacio.sanz@emory.edu.
Authorship note: JRR and YI contributed equally to this work and are co–first authors. IS and JMB contributed equally and are co–corresponding authors.
Find articles by Sanz, I. in: PubMed | Google Scholar
1Department of Microbiology and Immunology,
2Division of Rheumatology, Department of Medicine, and
3Lowance Center for Human Immunology, School of Medicine, Emory University, Atlanta, Georgia, USA.
Address correspondence to: Jeremy M. Boss, Department of Microbiology and Immunology, Emory University School of Medicine, 1510 Clifton Rd., NE, Atlanta, Georgia, 30322, USA. Email: jmboss@emory.edu. Or to: Ignacio Sanz, Department of Medicine, Division of Rheumatology, Lowance Center for Human Immunology, 247 Whitehead Research Bldg., Emory University School of Medicine, 615 Michael St. Atlanta, Georgia, 30322, USA. Email: ignacio.sanz@emory.edu.
Authorship note: JRR and YI contributed equally to this work and are co–first authors. IS and JMB contributed equally and are co–corresponding authors.
Find articles by
Boss, J.
in:
PubMed
|
Google Scholar
|
Published October 15, 2026 - More info
J Clin Invest. 2026;136(20):e199528. https://doi.org/10.1172/JCI199528.
© 2026 Rose et al. This work is licensed under the Creative Commons Attribution 4.0 International License. To view a copy of this license, visit http://creativecommons.org/licenses/by/4.0/.
Received: August 26, 2025; Accepted: August 18, 2026


-
Results
Resting and activated B cell subtypes are altered by SLE disease and disease activity. The frequency of total naive B cells has been shown to inversely correlate with SLE disease activity in studies that did not exclude the aN fraction (2, 10). Additionally, there is a direct correlation between disease activity and increased numbers of aN cells as well as the DN2 progeny of aN cells (2). These B cell abnormalities were present in the individuals assessed herein as determined by multiparameter flow cytometry analysis of isolated peripheral blood PBMCs (Supplemental Figure 1A; supplemental material available online with this article; https://doi.org/10.1172/JCI199528DS1) from a cohort of 14 healthy individuals treated as controls (HCs), 46 with inactive SLE (SELENA-SLEDAI ≤ 4), and 22 with active SLE (SELENA-SLEDAI ≥ 5) (Supplemental Tables 1 and 2). On average, transitional B cells were increased (P = 0.0500) in both SLE cohorts as previously described (Supplemental Figure 1B) (11).
The frequency and total number of rN cells were decreased in active disease compared with HC subjects and negatively correlated with SLEDAI (Supplemental Figure 1, C and D). The frequency and number of rN cells were similar between inactive disease and HC. As expected, the aN population was expanded as a fraction of total CD19+ cells and as a fraction of total naive B cells in active SLE (Supplemental Figure 1E). Within the IgD–CD27– DN compartment, we confirmed the expansion of DN2 cells (CD19+CD27–IgD–CD21–CD11c+) in active disease (2) and to a lesser but still significant degree in individuals with low-disease activity (Supplemental Figure 1F). A similar profile was observed for the DN3 cells (CD19+CD27–IgD–CD21–CD11c–), previously described in severe COVID-19 infection (12) and in IgG4-related disease (13). Combined, SLE cohorts displayed an increase of the DN2/DN1 and DN3/DN1 ratios, reflecting a reversal of the DN1 dominance within the DN B cell compartment characteristic of physiological B cell homeostasis (Supplemental Figure 1G). This effect was also seen in antibody-secreting cells (CD19+CD27++CD38++) (Supplemental Figure 1H). Reduced frequencies of unswitched memory B cells (CD19+CD27+IgD–) were observed in both SLE conditions (Supplemental Figure 1I), whereas switched memory B cells (SWM; CD19+CD27+IgD+) were unchanged by SLE diagnosis or disease activity (Supplemental Figure 1J). Overall, the B cell profiles of this SLE cohort align with our earlier findings (2, 3, 10).
Principal component analysis (PCA) using all gated B cell populations revealed that the samples from HCs were enriched in rN and unswitched memory B cells according to the principal component loadings, with considerable overlap with inactive SLE, while active individuals separated by PC1, reflecting their increased aN/DN2/antibody-secreting cell populations (Supplemental Figure 1K). The inactive SLE cohort was spread between SWM/DN1, T1/T2, and active disease–associated areas. Collectively, the B cell profiles of most inactive SLE showed more heterogeneity than those individuals with active disease. Importantly, inactive disease B cell profiles did not completely overlap with those from HC samples, a finding consistent with the hypothesis that B cells in inactive SLE may have unique molecular determinants.
SLE rN B cells express an abnormal transcriptome in patients with low disease activity. Our previous work demonstrated the presence of an SLE-specific transcriptome and epigenome in several B cell subsets of individuals with high disease activity, including rN (5, 6). To determine whether this transcriptome reflected a disease-determined regulatory program or was instead secondary to disease activity, RNA-seq was performed on cells isolated from PBMCs derived from an additional 17 HC, 15 inactive SLE (SELENA-SLEDAI ≤ 4), and 12 active SLE (SELENA-SLEDAI ≥ 5) individuals using a previously developed sorting strategy (14, 15) to rigorously sort rN B cells (CD19+CD27–IgD+MTG–CD24+CD38+) (5) and T1/T2 cells (CD19+CD27–IgD+MTG+CD24+CD38+) (Supplemental Table 1 and Supplemental Figure 2A). Here, the inactive disease cohort represented a longitudinal blend of individuals who were inactive and flare free from 1.6 to 107.3 months (Supplemental Figure 2B). PCA performed on the differentially expressed genes (DEGs) detected from pairwise comparisons of inactive SLE, active SLE, and HC, showed separation of each group of rN cells (Figure 1A). PC1 distinguished active SLE from both HC and inactive SLE and was positively correlated with SLEDAI (Figure 1B), whereas PC2 separated SLE samples from HC. Principal components were also analyzed with respect to other covariates, including age and medications, and revealed that these covariates were not correlated with the major PCs (Supplemental Figure 2, C and D). Thus, the data reflect that disease state and activity account for the dominant sources of variance in the data.
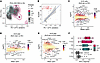 Figure 1
The distinct transcriptomes of active and inactive SLE B cells. (A) PCA plot of DEGs in rN B cells. Contours represent high-density regions calculated at probabilities (Prob). (B) Scatterplot of PC1 score by SLEDAI for SLE samples. P value and correlation were calculated by Pearson’s correlation test. (C–E). MA plots showing mean normalized expression (RPKM) for each gene by log2FC. Colors represent –log10 of P value derived from differential testing. (F) GSVA plot showing IFN-α response gene set. P values were calculated using 2-way ANOVA. Post hoc tests were performed across samples within the same cell type using Tukey’s honestly significant difference test and showed significance (adjusted P value < 0.05) in SLE versus HC comparisons but not between active and inactive SLE groups.
Differential expression analysis of rN B cells showed hundreds of DEGs between both disease activity groups and HCs and each other (Figure 1, C–E, Supplemental Figure 3A, and Supplemental Dataset 1). In general, both rN and T1/T2 B cells from individuals with active SLE displayed greater numbers of DEGs than their inactive SLE counterparts compared with HCs (Supplemental Figure 3A). PCA of T1/T2 cells also showed a similar separation, albeit with greater overlap between inactive and active SLE, as relatively few genes met FDR significance for differential expression between these 2 groups (Supplemental Figure 3, B and C). Thus, both rN and newly emerging T1/T2 B cells in inactive disease display hallmarks of an SLE disease state with a greater effect of disease activity on the transcriptome of rN cells. This pattern is consistent with the existence of a disease program initiated during early development, as reflected by T1/T2 B cells that expand during maturation into naive B cells and are modified during naive B cell activation. Additionally, many of the DEGs that are unique to either active or inactive SLE rN cells could dictate the properties of these cells in the different phases of the disease. For example, the upregulation in active disease of TNFRSF13B (TACI) (Supplemental Figure 3D), which binds BAFF and APRIL, could lead to alterations in tolerance (16). Upregulation of FCRL5 in active disease (Supplemental Figure 3D) could inhibit anergy and facilitate TLR signaling, as suggested from mouse models (17). In contrast, inactive disease rN cells overexpressed SPI1, which encodes the ETS transcription factor (TF) PU.1, and the epigenetic regulator EZH2 (Figure 1, D and E), a pattern consistent with preferential differentiation of inactive disease naive B cells through germinal centers (GCs) (18, 19).
Type I IFN response, TLR, and BCR signaling genes differentiate rN B cells in active SLE. A hallmark transcriptional feature of SLE is the upregulation of type I IFN response in multiple B cell populations (5, 20). Indeed, gene set variation analysis (GSVA) showed that the IFN-α response gene signature was present in the majority of individuals with SLE in this study (Figure 1F). Importantly, 2-way ANOVA of the GSVA results showed that the IFN-α response in rN cells was significantly different across HC and SLE samples but not between active and inactive disease.
A combined analysis of all cell types and activity levels highlighted limited DEG overlap between the groups (Figure 2A). The exceptions to this were primarily a core set of IFN response genes (N = 25) upregulated in all SLE groups (Figure 2B). In addition, 76 DEGs were shared only among the active disease rN and T1/T2 cells (Figure 2C). These genes were either upregulated or downregulated in active disease cells, while remaining at HC levels in inactive SLE. Of the genes upregulated (Figure 2D), ISG15, an IFN-induced antiviral response gene, has been associated with SLE disease activity (21). NLRP6, also overexpressed in active disease, encodes a key pattern recognition sensor component of inflammasome-mediated innate immunity and can be upregulated via type I IFN in some infections (22). The IFN regulatory factor 7 TF, encoded by IRF7, was more highly expressed in active disease B cells. IRF7 is a key regulator of the interferon response gene program (23) and genetic susceptibility to severe SLE (24). Of note, IRF7 mediates TLR7 signaling, a central SLE activation pathway (4). Finally, although THEMIS2 expression was significantly enriched in active versus HC, some inactive disease rN and T1/T2 samples also expressed high levels of THEMIS2 (Figure 2D). THEMIS2 encodes a protein known to interact with PLCγ2 to lower B cell activation thresholds to low-avidity antigens, a function of particular relevance to naive B cells (25). THEMIS2 is also of interest for SLE pathogenesis, as it is required to induce the expression of TBET and the production of IFN-γ (26), factors of major significance in the activation and differentiation of SLE naive B cells.
 Figure 2
Shared and distinct gene expression signatures in active and inactive SLE. (A) Venn diagram showing the number of DEGs shared and distinct across groups. (B) Heatmap of the 25 DEGs shared across all 4 groups from A. Normalized expression values (RPKM) were averaged by group and z scored. (C) Heatmap as in B showing the 76 DEGs overlapping between the indicated cell types. (D and E) Box-and-whisker plots showing normalized gene expression for indicated genes and groups with higher or lower expression, respectively, in active SLE. Dots represent individual samples and are colored according to log transformation of SLEDAI score. The box-and-whisker plots depict the minimum and maximum values (whiskers), the upper and lower quartiles, and the median.
Downregulation was also observed for PI3K family members, including the catalytic subunits PIK3CD and PIK3CG, as well as the regulatory subunit PIK3R5 and the TF FOXO1, which regulates PIK3R5 (27) (Figure 2, C and E). The PI3K/FOXO1 axis is an important regulator of B cell activation and homing to the lymph nodes, and its attenuation may enhance class switch recombination in primary B cells (28). Other examples of modulators of lymphocyte activation gene sets downregulated in active disease included FCRL3 and FCER2 (encoding CD23), although there appears to be a downward trend in inactive disease (Figure 2E). FCRL3 is an inhibitor of BCR signaling, and stimulation through FCRL3 enhances TLR9-mediated B cell activation but suppresses further differentiation to plasma cells (29). CD23 is induced by stimulation of B cells with IL-4, while being reduced by IFN stimulation. Human CD23 expression is strongly downregulated in SLE aN B cells (3). Also downregulated in B cells within the active SLE cohort was the expression of MEF2C (Figure 2, C and E), a TF involved in B cell development and GC formation (30, 31).
Inactive SLE has a unique transcriptional program. To better understand the nature of a SLE disease-state signature in the absence of disease activity, all pairwise DEGs were hierarchically clustered resulting in 4 distinct gene clusters (Figure 3A). In parallel, the samples were K-means clustered into 3 groups based on gene expression patterns. This approach resulted in a clear group of high SLEDAI active SLE samples that also displayed the largest transcriptional distance from HCs. Although heterogeneity exists, the majority of inactive individuals formed a distinct cluster. Cluster 1 contained DEGs highly expressed in both SLE groups and was enriched for IFN response genes (Figure 3), many of which were shared between rN and T1/T2 cells (Figure 2B). This cluster also included the gene for STAT4, a TF induced by type I interferons that participates in IL-12 signaling, promoting IFN-γ production (32, 33). Polymorphisms in STAT4 are associated with severe SLE (34), and its expression was elevated in rN cells from both disease activity levels, although to a greater extent in active SLE (Supplemental Figure 3D). Genes in cluster 2 were most highly expressed in active SLE, as exemplified by THEMIS2, also overexpressed in active transitional cells (Figure 2E). Cluster 2 also contained overexpressed members of the TNF superfamily, including TNFRSF10A (Death Receptor 4 or TRAIL receptor), which activates NF-κB inflammatory pathways. This cluster also contains the gene for STAG3, a protein critical for functionality of meiotic cohesin complexes, previously found as one of the top overexpressed genes in unfractionated CD19+ SLE B cells (35).
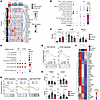 Figure 3
Cytokine and CD40 signaling gene expression in rN inactive SLE. (A) Heatmap showing DEGs in rN B cells with respect to disease activity. Normalized expression (RPKM) of DEGs were z scored and clustered using hierarchical clustering into 4 clusters by row, whereas columns were K-means clustered using a K = 3. (B) Bubble plot showing Gene Ontology enrichment of clusters from A. Bubbles are colored by the overlapped (k) genes normalized by each gene set size (K) and are presented as percentages. (C) Bar plots of normalized gene expression (RPKM) for indicated genes in rN cells. (D) Bubble plot showing GSEA. Bubbles are colored by normalized enrichment score (NES) and sized according to enrichment P value. Gene set descriptions are provided in Supplemental Table 3. A, active SLE; I, inactive SLE. (E) GSEA plots and NES for inactive or active SLE versus HC rN B cells. Dotted lines indicated enrichment that did not meet significance (FDR < 0.05). (F) Heatmap showing leading-edge genes from the CD40 signaling GSEA gene set in E. Normalized expression (RPKM) of DEGs were z scored. (G) GSEA plots for indicated gene sets for rN cells. (H) Bar plots of normalized gene expression (RPKM) for indicated genes from rN cells. In C and H, data are presented as the mean ±1 SD. Asterisks indicate significance in DESeq2 differential expression testing (Wald test with Benjamini-Hochberg correction), FDR < 0.05.
The remaining 2 clusters (3 and 4) contained genes that were down- and upregulated in inactive disease compared with HCs, respectively, and included gene sets broadly associated with cytokine responses, proliferation, and regulation of cell activation pathways (Figure 3, A and B). Cluster 3 comprised genes most severely repressed in active SLE and to a lesser extent in inactive SLE. Notably, it included IL4R, which counteracts the ability of IFN-γ to induce a TBET program in pathogenic SLE B cells as well as the differentiation of TLR7-activated naive B cells into pathogenic DN2 B cells (36–38). Cluster 3 also included downmodulated genes associated with B cell activation, naive B cell identity, and BCR signaling inhibition, including PIK3R5, MEF2C, and FCRL3 discussed above (29, 30) as well as NFAT1 (NFATC2), which is important for B cell anergy in a mouse self-tolerance model (39, 40). Cluster 4 contained genes highly expressed by inactive SLE rN B cells, including BCL6, which is required for the early stage of GC formation (Figure 3C) (41). Cluster 4 also contained genes associated with B cell activation and TNF-α/NF-κB signaling gene sets (Figure 3B), which suggests the potential for dysregulation of additional cytokine pathways in inactive SLE. To test this, we curated a library of gene sets representing various forms of B cell activation and cytokine signaling (Supplemental Table 3). In addition to enrichment of type I and II IFN gene sets in all SLE cell types and activity levels (Figure 3D), significant enrichment in inactive SLE rN B cells was found for CD40 signaling and several cytokine pathways, including TNF-α, IL-12, and IL-10, compared with HC and active SLE (Figure 3G and Supplemental Figure 3E). TNF-α/NF-κB and CD40 signaling pathways showed the greatest number of gene set members upregulated (FDR < 0.05) in inactive SLE (Figure 3E). It is important to note that many of these pathways have common overlapping genes and that all genes in a pathway may not be expressed in a given comparison.
We next interrogated the leading-edge subset of genes driving the association with CD40 signaling. That gene subset, with the greatest expression in inactive SLE, included members of not only the B cell CD40 response but also NF-κB signaling and GC B cell expressed genes (Figure 3F). Direct gene expression comparison between active and inactive SLE showed enrichment in inactive SLE for CD40 signaling, IL-4 response, and light zone GC B cell–expressed genes (Figure 3G). Compared with active disease, transcripts for GC B cell genes BCL6 (Figure 3C) and ITGB2 (Figure 3H) were significantly elevated in inactive SLE, suggesting that inactive SLE rN cells may be predisposed to interact with T cells and to follow distinct differentiation paths when activated. Alternatively, increased GC genes could restrict the differentiation potential of these B cells. Other significantly elevated transcripts in this comparison included CD44, a cell adhesion molecule with maximal expression in preactivated naive B cells and the TF BHLHE40, which is often associated with B cell activation and may restrict GC formation (Figure 3H) (42, 43). Increased expression of TNIP2, which encodes a modulator of NF-κB signaling, was observed in inactive SLE compared with HC (Figure 3H). Intriguingly, reduced expression of TRAF5 (a signaling mediator of CD40 signaling) (44, 45) in inactive SLE compared with HC suggested that this activation pathway may be dysfunctional to some extent (Supplemental Figure 3D). Overall, these data suggest an increased role of abnormal CD40, NF-κB, IL-4, and TNF-α cytokine signaling events in inactive disease rN B cells.
Epigenetic alterations to IFN-α response and TLR regulation loci remain accessible during disease remission. To characterize the epigenetic state of rN B cells during active and inactive SLE, we performed the assay for transposase-accessible chromatin with sequencing (ATAC-seq) (46) on a subset of the same SLE and HC samples that were profiled by RNA-seq above (Supplemental Table 1). A total of 24,793 differentially accessible regions (DARs) were found after comparing both disease groups and HCs in all pairwise combinations (Supplemental Dataset 2). Similar to the RNA-seq data, correlation analysis of the major principal components to other covariates revealed PC1 correlated with disease activity and SLEDAI and not to medications or other covariates (Supplemental Figure 2D). Both inactive (Figure 4A) and active SLE (Figure 4B) exhibited thousands of DARs (FDR < 0.05) when compared with HCs. On average, DARs present only in inactive disease exhibited small changes in accessibility, whereas those that overlapped both disease groups and active disease had higher absolute differential accessibility levels (Figure 4C). When assessing a 2-fold change, one-third of DARs from active disease rN cells overlapped with those occurring in inactive rN cells (Figure 4D). This collection of loci reflecting inactive and active disease-specific DARs, as well as those that overlapped, was used for gene pathway enrichment analysis (Figure 4E).
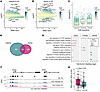 Figure 4
Chromatin accessibility changes in inactive SLE partially overlap those in active SLE. (A and B) MA plots showing mean normalized accessibility (reads per peak million [rppm]) for each locus by log2FC compared between the indicated groups. Dotted lines represent ± 0.5 log2FC cutoff. (C) Whisker-and-box plot showing absolute value of log2FC for loci in A and B separated by whether they occur in the indicated groups or overlap. (D) Venn diagram showing number of DARs in either disease activity compared with HCs using a log2FC cutoff of > 1. (E) Lollipop chart showing gene pathway enrichment of DARs (log2 of number observed [Obs]/number expected [Exp]) in the indicated groups. (F) Genome track plots. Black boxes represent DARs. (G) Whisker-and-box plots showing log2FC in gene expression in rN for each SLE group compared with HCs that have ≥ 1 shared accessible DAR. Lines connect individual genes. The box-and-whisker plots depict the minimum and maximum values (whiskers), the upper and lower quartiles, and the median. P value was calculated by paired 2-tailed Student’s t test.
This analysis showed significant enrichment for overlapping and nonoverlapping pathways in each disease group. A subset of regions was significantly changed in accessibility only in inactive SLE. Consistent with the reduced effect size for this set of DARs, subtle increases in accessibility in DARs within the NOTCH3, ETS1, and DGKD loci were observed for inactive SLE rN cells (Supplemental Figure 4A). NOTCH3 and ETS1 encode transcriptional regulators, and DGKD encodes a diacylglycerol kinase. DARs specifically associated with active SLE were enriched around genes in several signaling cascades and in the positive regulation of lymphocyte activation, including SOCS1, which encodes a suppressor of IFN signaling (47) and a direct regulator of IRF7 degradation (48). DARs at CLEC16A, which functions in autophagy and intracellular trafficking, were enriched in active SLE (Supplemental Figure 4B). CLEC16A is associated with susceptibility to autoimmune disease and inflammation (49, 50) and is located at an autoimmunity risk locus (51) that includes the MHC-II master regulators CIITA and SOCS1. The HKDC1 and SUPV3L1 genes, which encode a hexokinase and a mitochondrial double-stranded RNA helicase, respectively, contain DARs found only in active SLE (Supplemental Figure 4B).
Importantly, DARs in both disease activities (when compared with HCs) included regions with increased accessibility around several IFN response genes, such as IFI44/IFI44L and RSAD2 (Figure 4F and Supplemental Figure 4C). To determine whether these changes to chromatin accessibility were correlated with gene expression changes in SLE, expression was queried for those genes found at loci with at least 1 shared DAR in both active and inactive SLE. Many of these genes showed continued differential expression from HCs in both disease activity groups; however, a significant increase in the magnitude of expression changes was observed in active SLE individuals (Figure 4G). These data suggest that inactive disease rN B cells maintain accessible regions of chromatin around important loci, such as type I IFN response genes, indicating that either durable epigenetic memory, persistent inflammatory signaling, or both is occurring. The increase in overall gene expression at these shared loci suggests that additional events/factors are present/augmented in the active disease state.
Unique and shared TF motifs in inactive and active SLE epigenomes. To determine which TFs may play a role in regulating genes with differential accessibility in inactive and active SLE, enrichment analysis of known TF-binding motifs was performed on all DARs. Ranking the magnitude of enrichment of motifs over genomically matched background regions using HOMER (52) identified specific TF families that were enriched in each of the above categories of DARs. TF binding motifs for EBF1, p63, and TCF4, which contribute to mature B cell identity, homeostasis, and GC formation (53–56), were enriched in DARs with increased accessibility in inactive disease (Figure 5A). DARs in both disease activity groups (but not HCs) were enriched for ETS and IRF family motifs. Regions that became less accessible only in active SLE were enriched for NF-κB, FOXO1, and SPIB motifs, whereas inactive-specific DARs with less accessibility were enriched for EGR family motifs (Figure 5B). EGR motifs were previously shown to drive a network of genes in rN cells of active SLE (5). The enrichment for IRF family motifs, including IFN-stimulated response elements, was found within regions that remained accessible in both disease activity levels. However, additional enrichment of IRF and IFN-stimulated response element motifs was also found in DARs that were accessible only in active SLE (Figure 5C). Basic helix-loop-helix (bHLH) family motifs, such as those for TCF4, E2A (TCF3), and n-MYC, were also enriched with the highest ranking in the DARs specific to inactive SLE (Figure 5D). Intriguingly, significant enrichment of IRF8 motifs was found in regions both losing and gaining accessibility compared with HCs, particularly in active disease DARs, but also in those shared with inactive disease (Figure 5E). As above, NF-κB motifs were only enriched in DARs that lose accessibility in SLE (Down DAR), most significantly in active disease rN (Figure 5E). Together, these data suggest roles for ETS, IRF, bHLH, EGR, and NF-κB TF families in establishing or maintaining SLE disease activity–associated epigenetic changes.
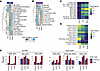 Figure 5
IRF and NFAT family factor motifs are enriched in shared elements of inactive and active SLE chromatin. (A and B) Heatmaps showing z scored ranking of HOMER motif enrichment from DARs with positive (A) or negative (B) log2FC compared with HCs ranked by effect size within each column. Columns represent specificity to active, inactive, or overlapped (those found in both disease states) DARs. (C and D) Heatmap of ranking for IRF (C) or bHLH (D) family factors after log10 transformation. (E) Bar plots showing percentage of regions containing indicated target motif (red) versus selected genomic background (blue). Act, active SLE; Inact, inactive SLE.
MEF2C and E2A/E2-2 factors likely regulate inactive SLE-specific gene sets. RNA expression and chromatin accessibility assay data were integrated into a gene regulatory network with the Taiji tool (57), which uses the PageRank algorithm to reveal the factors most implicated in coordinated regulation of RNA expression based on chromatin accessibility (Figure 6A). Similar to previous results (5), ATF3 was enriched in both active and inactive rN datasets, suggesting a role in driving the common SLE signature. PAX5 and RUNX1 had higher PageRank values in inactive disease for both rN and T1/T2 cells, while EGR1 and IKZF1 values were highest for the T1/T2 cell type within inactive SLE. TCF4, TCF3, and TCF12, which encode the TFs E2-2, E2A, and HEB, respectively, along with MEF2C and MEF2D showed the highest PageRank score in rN cells from inactive disease samples. In contrast, the factors NFATC2 and NFATC3 showed reduced importance in inactive disease rN cells compared with healthy or active counterparts (Figure 6A). This reduced importance correlated with lowered expression of the NFAT genes themselves (Figure 6B). A comparison of PageRank scores between active versus inactive disease showed that TFs such as TCF3, MEF2D, and CEBPB were predicted to be more important in inactive disease rN cells. Other PageRank scores were likely less driven by changes in their own transcript expression, but more by their influence on target genes. For example, BCL6 was more highly expressed in inactive disease but appears to have a lower impact on its target genes, as assessed by PageRank.
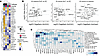 Figure 6
MEF2 and E2A/E2-2 regulate inactive SLE gene expression programs. (A) Heatmap showing log2FC of PageRank network importance score for SLE conditions (rN and T1/T2) versus HCs. (B) Scatterplots showing PageRank score (x axis) versus RNA expression. (C) Heatmap representing significance of overlap between TF target list and relevant B cell gene pathways. Color represents FDR P value of Fisher’s exact tests transformed using –log10.
To test this, TF gene targets in inactive rN cells, as determined by accessibility of motifs at predicted enhancer regions, were cross-referenced across the B cell activation and cytokine-signaling gene set libraries used in Figure 3. Fisher’s exact tests showed significant enrichments of target genes of PageRank-implicated TFs (Figure 6C). For example, IRF3 and IRF7 regulatory targets were most significantly enriched for IFN response genes, supporting their known role in TLR-mediated type I IFN response gene expression pathways (58). Targets of MEF2C/D and NR3C2, as well as to a lesser extent RUNX1 and NF-κB factors, were enriched for elements of the CD40 signaling gene set, which was expressed more highly by inactive rN B cells. MEF2C expression was significantly decreased from HCs in active SLE only (Supplemental Figure 3D). NFATC1 and NFATC2 target genes were enriched for B cell receptor and TLR signaling genes, suggesting alterations in the potential for these cells to respond to future antigen, cytokine, or stimulation challenges. The regulatory targets of E2A (TCF3), HEB (TCF12), PRDM1, and the glucocorticoid receptor NR3C1 were enriched for a gene set consisting of the DEGs from active versus inactive SLE in rN cells (Figure 6C). Thus, these data connect epigenetic changes in DARs with their associated TF motifs and alterations in gene expression pathways regulated in inactive SLE.


Copyright © 2026 American Society for Clinical Investigation
ISSN: 0021-9738 (print), 1558-8238 (online)