
Advertisement
Research ArticleClinical ResearchDevelopmentMetabolism
Open Access |  10.1172/JCI197010
l-2-Hydroxyglutarate impairs neuronal differentiation through epigenetic activation of MYC expression
Wen Gu,1 Xun Wang,1 Ashley Solmonson,1 Ling Cai,1,2 Yi Xiao,1 Alpaslan Tasdogan,1 Jordan Franklin,1 Yuannyu Zhang,1 Hua Zhang,3,4 Aundrea K. Westfall,1 Ashley Rowe,1 Hetali Trivedi,1 Brandon Faubert,1 Zheng Wu,1 Jessica Sudderth,1 Lauren G. Zacharias,1 Bushra Afroze,5 Ilya Bezprozvanny,3 Sunil Sudarshan,6 Feng Cai,1 Samuel K. McBrayer,1,7 Thomas P. Mathews,1 and Ralph J. DeBerardinis1,8,9
1Children’s Medical Center Research Institute,
2Quantitative Biomedical Research Center, Peter O’Donnell Jr. School of Public Health,
3Department of Physiology, and
4Department of Pathology, University of Texas Southwestern Medical Center, Dallas, Texas, USA.
5Department of Paediatrics & Child Health, The Aga Khan University, Karachi, Pakistan.
6Department of Urology, University of Alabama at Birmingham, Birmingham, Alabama, USA.
7Peter O’Donnell Jr. Brain Institute,
8Eugene McDermott Center for Human Growth and Development, and
9Howard Hughes Medical Institute, University of Texas Southwestern Medical Center, Dallas, Texas, USA.
Address correspondence to: Ralph J. DeBerardinis, Eugene McDermott Center for Human Growth and Development, University of Texas Southwestern Medical Center, 5323 Harry Hines Blvd., Dallas, Texas 75390, USA. Phone: 214.648.2587; Email: ralph.deberardinis@utsouthwestern.edu.
Find articles by Gu, W. in: PubMed | Google Scholar
1Children’s Medical Center Research Institute,
2Quantitative Biomedical Research Center, Peter O’Donnell Jr. School of Public Health,
3Department of Physiology, and
4Department of Pathology, University of Texas Southwestern Medical Center, Dallas, Texas, USA.
5Department of Paediatrics & Child Health, The Aga Khan University, Karachi, Pakistan.
6Department of Urology, University of Alabama at Birmingham, Birmingham, Alabama, USA.
7Peter O’Donnell Jr. Brain Institute,
8Eugene McDermott Center for Human Growth and Development, and
9Howard Hughes Medical Institute, University of Texas Southwestern Medical Center, Dallas, Texas, USA.
Address correspondence to: Ralph J. DeBerardinis, Eugene McDermott Center for Human Growth and Development, University of Texas Southwestern Medical Center, 5323 Harry Hines Blvd., Dallas, Texas 75390, USA. Phone: 214.648.2587; Email: ralph.deberardinis@utsouthwestern.edu.
Find articles by
Wang, X.
in:
PubMed
|
Google Scholar
|

1Children’s Medical Center Research Institute,
2Quantitative Biomedical Research Center, Peter O’Donnell Jr. School of Public Health,
3Department of Physiology, and
4Department of Pathology, University of Texas Southwestern Medical Center, Dallas, Texas, USA.
5Department of Paediatrics & Child Health, The Aga Khan University, Karachi, Pakistan.
6Department of Urology, University of Alabama at Birmingham, Birmingham, Alabama, USA.
7Peter O’Donnell Jr. Brain Institute,
8Eugene McDermott Center for Human Growth and Development, and
9Howard Hughes Medical Institute, University of Texas Southwestern Medical Center, Dallas, Texas, USA.
Address correspondence to: Ralph J. DeBerardinis, Eugene McDermott Center for Human Growth and Development, University of Texas Southwestern Medical Center, 5323 Harry Hines Blvd., Dallas, Texas 75390, USA. Phone: 214.648.2587; Email: ralph.deberardinis@utsouthwestern.edu.
Find articles by Solmonson, A. in: PubMed | Google Scholar
1Children’s Medical Center Research Institute,
2Quantitative Biomedical Research Center, Peter O’Donnell Jr. School of Public Health,
3Department of Physiology, and
4Department of Pathology, University of Texas Southwestern Medical Center, Dallas, Texas, USA.
5Department of Paediatrics & Child Health, The Aga Khan University, Karachi, Pakistan.
6Department of Urology, University of Alabama at Birmingham, Birmingham, Alabama, USA.
7Peter O’Donnell Jr. Brain Institute,
8Eugene McDermott Center for Human Growth and Development, and
9Howard Hughes Medical Institute, University of Texas Southwestern Medical Center, Dallas, Texas, USA.
Address correspondence to: Ralph J. DeBerardinis, Eugene McDermott Center for Human Growth and Development, University of Texas Southwestern Medical Center, 5323 Harry Hines Blvd., Dallas, Texas 75390, USA. Phone: 214.648.2587; Email: ralph.deberardinis@utsouthwestern.edu.
Find articles by Cai, L. in: PubMed | Google Scholar
1Children’s Medical Center Research Institute,
2Quantitative Biomedical Research Center, Peter O’Donnell Jr. School of Public Health,
3Department of Physiology, and
4Department of Pathology, University of Texas Southwestern Medical Center, Dallas, Texas, USA.
5Department of Paediatrics & Child Health, The Aga Khan University, Karachi, Pakistan.
6Department of Urology, University of Alabama at Birmingham, Birmingham, Alabama, USA.
7Peter O’Donnell Jr. Brain Institute,
8Eugene McDermott Center for Human Growth and Development, and
9Howard Hughes Medical Institute, University of Texas Southwestern Medical Center, Dallas, Texas, USA.
Address correspondence to: Ralph J. DeBerardinis, Eugene McDermott Center for Human Growth and Development, University of Texas Southwestern Medical Center, 5323 Harry Hines Blvd., Dallas, Texas 75390, USA. Phone: 214.648.2587; Email: ralph.deberardinis@utsouthwestern.edu.
Find articles by Xiao, Y. in: PubMed | Google Scholar
1Children’s Medical Center Research Institute,
2Quantitative Biomedical Research Center, Peter O’Donnell Jr. School of Public Health,
3Department of Physiology, and
4Department of Pathology, University of Texas Southwestern Medical Center, Dallas, Texas, USA.
5Department of Paediatrics & Child Health, The Aga Khan University, Karachi, Pakistan.
6Department of Urology, University of Alabama at Birmingham, Birmingham, Alabama, USA.
7Peter O’Donnell Jr. Brain Institute,
8Eugene McDermott Center for Human Growth and Development, and
9Howard Hughes Medical Institute, University of Texas Southwestern Medical Center, Dallas, Texas, USA.
Address correspondence to: Ralph J. DeBerardinis, Eugene McDermott Center for Human Growth and Development, University of Texas Southwestern Medical Center, 5323 Harry Hines Blvd., Dallas, Texas 75390, USA. Phone: 214.648.2587; Email: ralph.deberardinis@utsouthwestern.edu.
Find articles by Tasdogan, A. in: PubMed | Google Scholar
1Children’s Medical Center Research Institute,
2Quantitative Biomedical Research Center, Peter O’Donnell Jr. School of Public Health,
3Department of Physiology, and
4Department of Pathology, University of Texas Southwestern Medical Center, Dallas, Texas, USA.
5Department of Paediatrics & Child Health, The Aga Khan University, Karachi, Pakistan.
6Department of Urology, University of Alabama at Birmingham, Birmingham, Alabama, USA.
7Peter O’Donnell Jr. Brain Institute,
8Eugene McDermott Center for Human Growth and Development, and
9Howard Hughes Medical Institute, University of Texas Southwestern Medical Center, Dallas, Texas, USA.
Address correspondence to: Ralph J. DeBerardinis, Eugene McDermott Center for Human Growth and Development, University of Texas Southwestern Medical Center, 5323 Harry Hines Blvd., Dallas, Texas 75390, USA. Phone: 214.648.2587; Email: ralph.deberardinis@utsouthwestern.edu.
Find articles by Franklin, J. in: PubMed | Google Scholar
1Children’s Medical Center Research Institute,
2Quantitative Biomedical Research Center, Peter O’Donnell Jr. School of Public Health,
3Department of Physiology, and
4Department of Pathology, University of Texas Southwestern Medical Center, Dallas, Texas, USA.
5Department of Paediatrics & Child Health, The Aga Khan University, Karachi, Pakistan.
6Department of Urology, University of Alabama at Birmingham, Birmingham, Alabama, USA.
7Peter O’Donnell Jr. Brain Institute,
8Eugene McDermott Center for Human Growth and Development, and
9Howard Hughes Medical Institute, University of Texas Southwestern Medical Center, Dallas, Texas, USA.
Address correspondence to: Ralph J. DeBerardinis, Eugene McDermott Center for Human Growth and Development, University of Texas Southwestern Medical Center, 5323 Harry Hines Blvd., Dallas, Texas 75390, USA. Phone: 214.648.2587; Email: ralph.deberardinis@utsouthwestern.edu.
Find articles by Zhang, Y. in: PubMed | Google Scholar
1Children’s Medical Center Research Institute,
2Quantitative Biomedical Research Center, Peter O’Donnell Jr. School of Public Health,
3Department of Physiology, and
4Department of Pathology, University of Texas Southwestern Medical Center, Dallas, Texas, USA.
5Department of Paediatrics & Child Health, The Aga Khan University, Karachi, Pakistan.
6Department of Urology, University of Alabama at Birmingham, Birmingham, Alabama, USA.
7Peter O’Donnell Jr. Brain Institute,
8Eugene McDermott Center for Human Growth and Development, and
9Howard Hughes Medical Institute, University of Texas Southwestern Medical Center, Dallas, Texas, USA.
Address correspondence to: Ralph J. DeBerardinis, Eugene McDermott Center for Human Growth and Development, University of Texas Southwestern Medical Center, 5323 Harry Hines Blvd., Dallas, Texas 75390, USA. Phone: 214.648.2587; Email: ralph.deberardinis@utsouthwestern.edu.
Find articles by Zhang, H. in: PubMed | Google Scholar
1Children’s Medical Center Research Institute,
2Quantitative Biomedical Research Center, Peter O’Donnell Jr. School of Public Health,
3Department of Physiology, and
4Department of Pathology, University of Texas Southwestern Medical Center, Dallas, Texas, USA.
5Department of Paediatrics & Child Health, The Aga Khan University, Karachi, Pakistan.
6Department of Urology, University of Alabama at Birmingham, Birmingham, Alabama, USA.
7Peter O’Donnell Jr. Brain Institute,
8Eugene McDermott Center for Human Growth and Development, and
9Howard Hughes Medical Institute, University of Texas Southwestern Medical Center, Dallas, Texas, USA.
Address correspondence to: Ralph J. DeBerardinis, Eugene McDermott Center for Human Growth and Development, University of Texas Southwestern Medical Center, 5323 Harry Hines Blvd., Dallas, Texas 75390, USA. Phone: 214.648.2587; Email: ralph.deberardinis@utsouthwestern.edu.
Find articles by Westfall, A. in: PubMed | Google Scholar
1Children’s Medical Center Research Institute,
2Quantitative Biomedical Research Center, Peter O’Donnell Jr. School of Public Health,
3Department of Physiology, and
4Department of Pathology, University of Texas Southwestern Medical Center, Dallas, Texas, USA.
5Department of Paediatrics & Child Health, The Aga Khan University, Karachi, Pakistan.
6Department of Urology, University of Alabama at Birmingham, Birmingham, Alabama, USA.
7Peter O’Donnell Jr. Brain Institute,
8Eugene McDermott Center for Human Growth and Development, and
9Howard Hughes Medical Institute, University of Texas Southwestern Medical Center, Dallas, Texas, USA.
Address correspondence to: Ralph J. DeBerardinis, Eugene McDermott Center for Human Growth and Development, University of Texas Southwestern Medical Center, 5323 Harry Hines Blvd., Dallas, Texas 75390, USA. Phone: 214.648.2587; Email: ralph.deberardinis@utsouthwestern.edu.
Find articles by
Rowe, A.
in:
PubMed
|
Google Scholar
|
1Children’s Medical Center Research Institute,
2Quantitative Biomedical Research Center, Peter O’Donnell Jr. School of Public Health,
3Department of Physiology, and
4Department of Pathology, University of Texas Southwestern Medical Center, Dallas, Texas, USA.
5Department of Paediatrics & Child Health, The Aga Khan University, Karachi, Pakistan.
6Department of Urology, University of Alabama at Birmingham, Birmingham, Alabama, USA.
7Peter O’Donnell Jr. Brain Institute,
8Eugene McDermott Center for Human Growth and Development, and
9Howard Hughes Medical Institute, University of Texas Southwestern Medical Center, Dallas, Texas, USA.
Address correspondence to: Ralph J. DeBerardinis, Eugene McDermott Center for Human Growth and Development, University of Texas Southwestern Medical Center, 5323 Harry Hines Blvd., Dallas, Texas 75390, USA. Phone: 214.648.2587; Email: ralph.deberardinis@utsouthwestern.edu.
Find articles by Trivedi, H. in: PubMed | Google Scholar
1Children’s Medical Center Research Institute,
2Quantitative Biomedical Research Center, Peter O’Donnell Jr. School of Public Health,
3Department of Physiology, and
4Department of Pathology, University of Texas Southwestern Medical Center, Dallas, Texas, USA.
5Department of Paediatrics & Child Health, The Aga Khan University, Karachi, Pakistan.
6Department of Urology, University of Alabama at Birmingham, Birmingham, Alabama, USA.
7Peter O’Donnell Jr. Brain Institute,
8Eugene McDermott Center for Human Growth and Development, and
9Howard Hughes Medical Institute, University of Texas Southwestern Medical Center, Dallas, Texas, USA.
Address correspondence to: Ralph J. DeBerardinis, Eugene McDermott Center for Human Growth and Development, University of Texas Southwestern Medical Center, 5323 Harry Hines Blvd., Dallas, Texas 75390, USA. Phone: 214.648.2587; Email: ralph.deberardinis@utsouthwestern.edu.
Find articles by Faubert, B. in: PubMed | Google Scholar
1Children’s Medical Center Research Institute,
2Quantitative Biomedical Research Center, Peter O’Donnell Jr. School of Public Health,
3Department of Physiology, and
4Department of Pathology, University of Texas Southwestern Medical Center, Dallas, Texas, USA.
5Department of Paediatrics & Child Health, The Aga Khan University, Karachi, Pakistan.
6Department of Urology, University of Alabama at Birmingham, Birmingham, Alabama, USA.
7Peter O’Donnell Jr. Brain Institute,
8Eugene McDermott Center for Human Growth and Development, and
9Howard Hughes Medical Institute, University of Texas Southwestern Medical Center, Dallas, Texas, USA.
Address correspondence to: Ralph J. DeBerardinis, Eugene McDermott Center for Human Growth and Development, University of Texas Southwestern Medical Center, 5323 Harry Hines Blvd., Dallas, Texas 75390, USA. Phone: 214.648.2587; Email: ralph.deberardinis@utsouthwestern.edu.
Find articles by Wu, Z. in: PubMed | Google Scholar
1Children’s Medical Center Research Institute,
2Quantitative Biomedical Research Center, Peter O’Donnell Jr. School of Public Health,
3Department of Physiology, and
4Department of Pathology, University of Texas Southwestern Medical Center, Dallas, Texas, USA.
5Department of Paediatrics & Child Health, The Aga Khan University, Karachi, Pakistan.
6Department of Urology, University of Alabama at Birmingham, Birmingham, Alabama, USA.
7Peter O’Donnell Jr. Brain Institute,
8Eugene McDermott Center for Human Growth and Development, and
9Howard Hughes Medical Institute, University of Texas Southwestern Medical Center, Dallas, Texas, USA.
Address correspondence to: Ralph J. DeBerardinis, Eugene McDermott Center for Human Growth and Development, University of Texas Southwestern Medical Center, 5323 Harry Hines Blvd., Dallas, Texas 75390, USA. Phone: 214.648.2587; Email: ralph.deberardinis@utsouthwestern.edu.
Find articles by
Sudderth, J.
in:
PubMed
|
Google Scholar
|
1Children’s Medical Center Research Institute,
2Quantitative Biomedical Research Center, Peter O’Donnell Jr. School of Public Health,
3Department of Physiology, and
4Department of Pathology, University of Texas Southwestern Medical Center, Dallas, Texas, USA.
5Department of Paediatrics & Child Health, The Aga Khan University, Karachi, Pakistan.
6Department of Urology, University of Alabama at Birmingham, Birmingham, Alabama, USA.
7Peter O’Donnell Jr. Brain Institute,
8Eugene McDermott Center for Human Growth and Development, and
9Howard Hughes Medical Institute, University of Texas Southwestern Medical Center, Dallas, Texas, USA.
Address correspondence to: Ralph J. DeBerardinis, Eugene McDermott Center for Human Growth and Development, University of Texas Southwestern Medical Center, 5323 Harry Hines Blvd., Dallas, Texas 75390, USA. Phone: 214.648.2587; Email: ralph.deberardinis@utsouthwestern.edu.
Find articles by Zacharias, L. in: PubMed | Google Scholar
1Children’s Medical Center Research Institute,
2Quantitative Biomedical Research Center, Peter O’Donnell Jr. School of Public Health,
3Department of Physiology, and
4Department of Pathology, University of Texas Southwestern Medical Center, Dallas, Texas, USA.
5Department of Paediatrics & Child Health, The Aga Khan University, Karachi, Pakistan.
6Department of Urology, University of Alabama at Birmingham, Birmingham, Alabama, USA.
7Peter O’Donnell Jr. Brain Institute,
8Eugene McDermott Center for Human Growth and Development, and
9Howard Hughes Medical Institute, University of Texas Southwestern Medical Center, Dallas, Texas, USA.
Address correspondence to: Ralph J. DeBerardinis, Eugene McDermott Center for Human Growth and Development, University of Texas Southwestern Medical Center, 5323 Harry Hines Blvd., Dallas, Texas 75390, USA. Phone: 214.648.2587; Email: ralph.deberardinis@utsouthwestern.edu.
Find articles by Afroze, B. in: PubMed | Google Scholar
1Children’s Medical Center Research Institute,
2Quantitative Biomedical Research Center, Peter O’Donnell Jr. School of Public Health,
3Department of Physiology, and
4Department of Pathology, University of Texas Southwestern Medical Center, Dallas, Texas, USA.
5Department of Paediatrics & Child Health, The Aga Khan University, Karachi, Pakistan.
6Department of Urology, University of Alabama at Birmingham, Birmingham, Alabama, USA.
7Peter O’Donnell Jr. Brain Institute,
8Eugene McDermott Center for Human Growth and Development, and
9Howard Hughes Medical Institute, University of Texas Southwestern Medical Center, Dallas, Texas, USA.
Address correspondence to: Ralph J. DeBerardinis, Eugene McDermott Center for Human Growth and Development, University of Texas Southwestern Medical Center, 5323 Harry Hines Blvd., Dallas, Texas 75390, USA. Phone: 214.648.2587; Email: ralph.deberardinis@utsouthwestern.edu.
Find articles by Bezprozvanny, I. in: PubMed | Google Scholar
1Children’s Medical Center Research Institute,
2Quantitative Biomedical Research Center, Peter O’Donnell Jr. School of Public Health,
3Department of Physiology, and
4Department of Pathology, University of Texas Southwestern Medical Center, Dallas, Texas, USA.
5Department of Paediatrics & Child Health, The Aga Khan University, Karachi, Pakistan.
6Department of Urology, University of Alabama at Birmingham, Birmingham, Alabama, USA.
7Peter O’Donnell Jr. Brain Institute,
8Eugene McDermott Center for Human Growth and Development, and
9Howard Hughes Medical Institute, University of Texas Southwestern Medical Center, Dallas, Texas, USA.
Address correspondence to: Ralph J. DeBerardinis, Eugene McDermott Center for Human Growth and Development, University of Texas Southwestern Medical Center, 5323 Harry Hines Blvd., Dallas, Texas 75390, USA. Phone: 214.648.2587; Email: ralph.deberardinis@utsouthwestern.edu.
Find articles by Sudarshan, S. in: PubMed | Google Scholar
1Children’s Medical Center Research Institute,
2Quantitative Biomedical Research Center, Peter O’Donnell Jr. School of Public Health,
3Department of Physiology, and
4Department of Pathology, University of Texas Southwestern Medical Center, Dallas, Texas, USA.
5Department of Paediatrics & Child Health, The Aga Khan University, Karachi, Pakistan.
6Department of Urology, University of Alabama at Birmingham, Birmingham, Alabama, USA.
7Peter O’Donnell Jr. Brain Institute,
8Eugene McDermott Center for Human Growth and Development, and
9Howard Hughes Medical Institute, University of Texas Southwestern Medical Center, Dallas, Texas, USA.
Address correspondence to: Ralph J. DeBerardinis, Eugene McDermott Center for Human Growth and Development, University of Texas Southwestern Medical Center, 5323 Harry Hines Blvd., Dallas, Texas 75390, USA. Phone: 214.648.2587; Email: ralph.deberardinis@utsouthwestern.edu.
Find articles by Cai, F. in: PubMed | Google Scholar
1Children’s Medical Center Research Institute,
2Quantitative Biomedical Research Center, Peter O’Donnell Jr. School of Public Health,
3Department of Physiology, and
4Department of Pathology, University of Texas Southwestern Medical Center, Dallas, Texas, USA.
5Department of Paediatrics & Child Health, The Aga Khan University, Karachi, Pakistan.
6Department of Urology, University of Alabama at Birmingham, Birmingham, Alabama, USA.
7Peter O’Donnell Jr. Brain Institute,
8Eugene McDermott Center for Human Growth and Development, and
9Howard Hughes Medical Institute, University of Texas Southwestern Medical Center, Dallas, Texas, USA.
Address correspondence to: Ralph J. DeBerardinis, Eugene McDermott Center for Human Growth and Development, University of Texas Southwestern Medical Center, 5323 Harry Hines Blvd., Dallas, Texas 75390, USA. Phone: 214.648.2587; Email: ralph.deberardinis@utsouthwestern.edu.
Find articles by McBrayer, S. in: PubMed | Google Scholar
1Children’s Medical Center Research Institute,
2Quantitative Biomedical Research Center, Peter O’Donnell Jr. School of Public Health,
3Department of Physiology, and
4Department of Pathology, University of Texas Southwestern Medical Center, Dallas, Texas, USA.
5Department of Paediatrics & Child Health, The Aga Khan University, Karachi, Pakistan.
6Department of Urology, University of Alabama at Birmingham, Birmingham, Alabama, USA.
7Peter O’Donnell Jr. Brain Institute,
8Eugene McDermott Center for Human Growth and Development, and
9Howard Hughes Medical Institute, University of Texas Southwestern Medical Center, Dallas, Texas, USA.
Address correspondence to: Ralph J. DeBerardinis, Eugene McDermott Center for Human Growth and Development, University of Texas Southwestern Medical Center, 5323 Harry Hines Blvd., Dallas, Texas 75390, USA. Phone: 214.648.2587; Email: ralph.deberardinis@utsouthwestern.edu.
Find articles by Mathews, T. in: PubMed | Google Scholar
1Children’s Medical Center Research Institute,
2Quantitative Biomedical Research Center, Peter O’Donnell Jr. School of Public Health,
3Department of Physiology, and
4Department of Pathology, University of Texas Southwestern Medical Center, Dallas, Texas, USA.
5Department of Paediatrics & Child Health, The Aga Khan University, Karachi, Pakistan.
6Department of Urology, University of Alabama at Birmingham, Birmingham, Alabama, USA.
7Peter O’Donnell Jr. Brain Institute,
8Eugene McDermott Center for Human Growth and Development, and
9Howard Hughes Medical Institute, University of Texas Southwestern Medical Center, Dallas, Texas, USA.
Address correspondence to: Ralph J. DeBerardinis, Eugene McDermott Center for Human Growth and Development, University of Texas Southwestern Medical Center, 5323 Harry Hines Blvd., Dallas, Texas 75390, USA. Phone: 214.648.2587; Email: ralph.deberardinis@utsouthwestern.edu.
Find articles by DeBerardinis, R. in: PubMed | Google Scholar
Published March 17, 2026 - More info
J Clin Invest. 2026;136(9):e197010. https://doi.org/10.1172/JCI197010.
© 2026 Gu et al. This work is licensed under the Creative Commons Attribution 4.0 International License. To view a copy of this license, visit http://creativecommons.org/licenses/by/4.0/.
Received: June 20, 2025; Accepted: March 5, 2026

-
Results
Genomic and metabolic analysis of patients with L-2HGA. We identified a homozygous loss-of-function variant in L2HGDH (c.829C>T; p.Arg277Ter) in 2 siblings diagnosed with L-2HGA in Pakistan (Figure 1A, patients 1 and 2). We confirmed that both siblings inherited 1 pathogenic variant from each heterozygous carrier parent, consistent with the known autosomal recessive inheritance of this disease (2). Metabolomic profiling of plasma revealed elevated 2HG levels in the patients relative to their parents and control subjects (Figure 1B). Metabolite differential analysis demonstrated that 2HG was by far the most statistically significantly altered metabolite in the plasma of the L-2HGA patients (Figure 1C). We also performed metabolomics in fibroblast cultures from both siblings and observed marked 2HG accumulation compared with fibroblasts from 29 controls (Figure 1D and Supplemental Figure 1A; supplemental material available online with this article; https://doi.org/10.1172/JCI197010DS1). We then quantified the levels of both 2HG enantiomers in fibroblasts from the patients and controls; this confirmed elevated L-2HG in the patients’ cells, with no accumulation of D-2HG, as expected (Figure 1E and Supplemental Figure 1B).
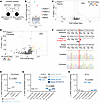 Figure 1
An isogenic, patient-derived iPSC system to study L2HGDH deficiency. (A) L2HGDH genotypes of 2 L-2HGA patients and their parents. (B) Relative 2HG abundance in plasma from L-2HGA patients, parents, and unrelated subjects. (C) Volcano plot of plasma metabolites comparing patient 1 to unrelated subjects (n = 427; sibling excluded). A linear mixed-effects model was used to account for repeated measures per individual, with subject ID as a random effect. P values were adjusted for multiple testing (Benjamini-Hochberg), with statistical significance thresholds of adjusted P < 0.01 and fold change > 2 or < 0.5. (D) Volcano plot of fibroblast metabolites comparing patient 1 to 29 unrelated lines (sibling excluded), each profiled in quadruplicate. A mixed-effects model was used as in C, with cell line as the random effect. (E) L-2HG concentrations in neonatal control, adult control, and patient fibroblasts. (F) Alignment showing the pathogenic L2HGDH variant (c.829C>T, red) and edits (blue) introduced by the ssODN repair template. Electropherograms show unedited and biallelically corrected iPSC alleles. (G and H) L-2HG levels in PSCs (G) and NPCs (H) from control and patient lines with unedited or corrected L2HGDH alleles. In G, “hPSC” denotes human pluripotent stem cells and is used to collectively refer to the H9 human embryonic stem cell line and the patient-derived human iPSC lines. For B, E, G, and H, data are shown as box-and-whisker plots with jittered points (n = 4 biological replicates for E, G, and H); boxes represent the 25th–75th percentile, horizontal lines indicate medians, and whiskers extend to 1.5× the interquartile range. Significance was determined by 1-way ANOVA with Tukey’s HSD test.
CRISPR/Cas9-mediated correction of L2HGDH mutation. To model L-2HGA in culture and explore the molecular basis of neuronal dysfunction, we generated induced pluripotent stem cells (iPSCs; Supplemental Figure 1C) from patient fibroblasts using the reprogramming factors OCT4, KLF4, SOX2, and c-MYC introduced via a nonreplicating Sendai virus (24). Eight clonal cell lines were derived from the reprogrammed fibroblasts for each donor, and 2 of these lines from each donor were further expanded and characterized. We then applied CRISPR/Cas9-mediated genome editing to correct the c.829C>T mutation in patient-derived iPSCs using a single-stranded oligodeoxynucleotide (ssODN) repair template (Figure 1F and Supplemental Figure 1D). Sanger sequencing confirmed correction of L2HGDH in patient-derived iPSC clones, demonstrating precise incorporation of blocking mutations (in blue in Figure 1F) to prevent Cas9 recutting (25). In subsequent experiments, “corrected” clones are ones in which L2HGDH was edited to the WT sequence, and “unedited” clones are ones that were subjected to the editing workflow but did not become edited (Supplemental Figure 1D). We measured L-2HG concentrations in pluripotent stem cells from control subjects and from corrected and unedited iPSCs from both patients (Figure 1G). Unedited iPSCs retained high L-2HG levels, but edited iPSCs had L-2HG levels comparable to control hPSCs. Consistent with autosomal recessive inheritance of L-2HGA, monoallelic homology-directed recombination reduced intracellular L-2HG to levels comparable to biallelically corrected iPSCs (Figure 1G). We then differentiated these iPSCs into NPCs (Supplemental Figure 1C) according to a well-established dual-SMAD inhibition neural specification protocol (26) and found that unedited NPCs from both patients had high L-2HG levels but corrected NPCs had low L-2HG levels comparable to NPCs from controls (Figure 1H). D-2HG levels were comparable in all these cell lines (Supplemental Figure 1E).
L2HGDH-mutant NPCs are hyperproliferative with enhanced self-renewal capacity and impaired differentiation to neurons. Unedited NPCs were highly proliferative, exceeding the proliferation rates of corrected NPCs and control H9 NPCs (Figure 2A). We generated cortical spheroids from H9, unedited, and corrected NPCs because these 3D models of differentiation can be used to study disease processes that impact the brain (27). After 30 days of differentiation, spheroids derived from unedited NPCs were much larger than those from corrected and control NPCs (Figure 2B). Quantification of spheroid surface area confirmed the increased size of unedited relative to corrected spheroids, whereas no difference was detected between corrected and control spheroids (Figure 2C). Next, to evaluate NPC self-renewal capacity, we cultured single NPCs and measured their ability to form colonies (28). Stereoscopic and phase-contrast imaging revealed enhanced colony formation in unedited NPCs compared with corrected cells (Figure 2D). Quantification of sphere-forming frequency demonstrated a large increase in the proportion of sphere-forming cells in unedited NPCs relative to corrected lines (Figure 2E).
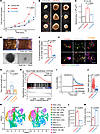 Figure 2
L-2HG accumulation enhances NPC proliferation and self-renewal while inhibiting neuronal differentiation. (A) Growth curves of NPCs derived from H9 control, unedited, and corrected iPSCs. (B) Stereoscopic images of cortical spheroids at day 30 of differentiation. Scale bar: 1,000 μm. (C) Quantification of spheroid surface area at day 30. (D) Images of colonies formed from single NPCs. Scale bars: 2 mm (top), 100 μm (bottom). (E) Frequency of colony formation in single NPCs. (F) Immunostaining for MAP2 and β-III-tubulin in unedited, corrected, and corrected + 30 μM octyl-L-2HG (o-L-2HG) neurons at day 14. DAPI marks nuclei. Scale bar: 100 μm. (G) Quantification of neurite length from images. (H) GSEA plot showing enrichment of the REACTOME_NEURONAL_SYSTEM gene set in corrected versus unedited neurons. (I) Fura-2 ratio recordings of Ca2+ dynamics during 45 mM KCl application in neurons differentiated for 47 days (unedited: n = 29; corrected: n = 24). (J) Quantification of PAX6 signal intensity normalized to DAPI in unedited and corrected neurons. (K) UMAP of single-cell transcriptomes from day 45 cortical spheroids (unedited and corrected; 12,660 cells each). Annotated populations include progenitors (prog.), precursors (prec.), neurons (n.), astrocyte (astro.) lineage, radial (rad.) glia, intermediate (inter.) progenitors, excitatory (excit.) neurons, inhibitory (inhib.) neurons, interneurons, and oligodendrocyte progenitor cells (OPC). (L and M) Proportions of immature neurons (L) and excitatory neurons (M) among annotated populations. For A, C, E, G, J, L, and M, data are shown as mean ± SEM. Significance was determined by 2-way ANOVA for A, 1-way ANOVA with Tukey’s HSD test for C (n = 10 H9, n = 15 unedited, n = 10 corrected) and G (n = 96 unedited, n = 86 corrected, n = 108 corrected + o-L-2HG), and unpaired 2-tailed Student’s t test for E (n = 8), J (n = 679 unedited, n = 430 corrected), and L and M (n = 3 each).
Next, we investigated the effects of L2HGDH mutation on neuronal differentiation by subjecting patient-derived NPCs to a well-described neuronal differentiation protocol (Supplemental Figure 1C) (29). This approach generates a majority of VGLUT1+ neurons, which are presumed to be glutamatergic forebrain neurons (26). We immunostained day 14 2D neuronal cultures with MAP2 (Cell Signaling Technology, 8707S) and β-III-tubulin (BioLegend, 801202), markers of mature neurons. Morphologically, the corrected cells displayed extensive neurite outgrowth, characteristic of neurons generated in this assay, whereas neurite formation was blunted in the unedited cells (Figure 2, F and G). Supplementing corrected NPCs with a membrane-permeable L-2HG ester (30 μM octyl-L-2HG) (10) completely reversed the effect of L2HGDH correction on total neurite length (Figure 2, F and G), indicating an L-2HG–dependent defect in neurite growth in the unedited cells.
RNA-seq was performed to further characterize the molecular differences between unedited and corrected cells. GSEA indicated enrichment of the REACTOME_NEURONAL_SYSTEM gene set in corrected compared with unedited neurons after 14 days of differentiation (Figure 2H); this was the highest scoring of all 3,917 gene sets by GSEA (Supplemental Figure 2A and Supplemental Table 1). To assess neuronal excitability, functional calcium imaging was performed in neuronal cultures following KCl stimulation (30). This assay revealed essentially no response in most unedited NPC-derived neurons, but prominent intracellular calcium increases in the corrected cells, indicative of improved neuronal activity (Figure 2I). Consistent with a delayed exit from the progenitor state, unedited neurons retained much higher levels of PAX6, a well-established marker of NPCs, compared with their corrected counterparts after 14 days of neuronal differentiation (Figure 2J).
To further resolve cell-type composition during neuronal differentiation in 3D, we performed scRNA-seq on day 45 cortical spheroids derived from unedited and corrected human iPSCs (hiPSCs). UMAP embedding revealed differences in cellular composition between conditions (Figure 2K). Unedited spheroids exhibited an increased proportion of immature, uncommitted neurons and a corresponding reduction in specified excitatory neurons relative to corrected spheroids (Figure 2, L and M), consistent with a block in neuronal specification.
Together, these findings highlight the impact of L2HGDH mutation and L-2HG accumulation on NPC proliferation, self-renewal, and neuronal differentiation. Our data demonstrate that CRISPR/Cas9-mediated correction of L2HGDH restores neuronal differentiation and function, suggesting the potential of this isogenic model to uncover the molecular mechanism by which L-2HG excess disrupts neuronal development.
Depleting L-2HG enhances neuronal differentiation in L2HGDH-deficient NPCs. We next sought to test whether the defect in neuronal differentiation in L2HGDH-deficient NPCs could be reversed pharmacologically. We identified the predominant nutrient source of L-2HG by performing parallel stable isotope tracing experiments in medium containing [U-13C]glucose and unlabeled glutamine, or [U-13C]glutamine and unlabeled glucose. [U-13C]glucose is predicted to give rise to αKG and L-2HG m+2, while [U-13C]glutamine is predicted to give rise to αKG and L-2HG m+5 (Figure 3A; complete set of labeling data in Supplemental Tables 2 and 3). These isotope tracing experiments used a mass spectrometry approach that does not discriminate between L- and D-2HG, but note that L-2HG accounts for most of the total 2HG pool in L2HGDH-deficient cells (Figure 1H and Supplemental Figure 1E). In all cell lines examined, the abundance of 13C-labeled 2HG from glutamine exceeded the abundance from glucose, as expected if glutamine is the dominant source of αKG (Figure 3B). Unedited patient-derived NPCs cultured with [U-13C]glutamine had much more 13C-2HG than these same NPCs cultured in [U-13C]glucose or control NPCs cultured in [U-13C]glutamine (Figure 3B).
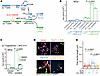 Figure 3
Suppressing L-2HG synthesis improves neurite formation in L2HGDH-deficient NPCs. (A) Schematic of 13C-labeling routes to L-2HG from [U-13C]glucose (blue) or [U-13C]glutamine (green) in NPCs. Glc, glucose; Pyr, pyruvate; Ac-CoA, acetyl-CoA; OAA, oxaloacetate; Cit, citrate; Gln, glutamine; GLS, glutaminase; GLSi, glutaminase inhibitor (CB-839); Glu, glutamate. (B) Ion counts of 13C-labeled 2HG isotopologues in NPCs derived from H9, control hiPSC, and patients 1 and 2 after 4 hours of labeling with [U-13C]glucose or [U-13C]glutamine. (C) Ion counts of 13C-labeled 2HG isotopologues in control hiPSC-derived and patient 1 NPCs cultured in [U-13C]glutamine and treated with DMSO or 1 μM CB-839 (GLSi) for 4 hours. (D) Immunofluorescence for MAP2 and β-III-tubulin in patient 1 NPCs after 14 days of neuronal differentiation, treated with DMSO, 30 μM octyl-L-2HG (o-L-2HG), 1 μM CB-839 (GLSi), or both. DAPI marks nuclei. Scale bar: 100 μm. (E) Quantification of total neurite length from cells in D, measured with the SNT plug-in in ImageJ. For B and C, ion counts were normalized to total ion current. Data were non-normally distributed (Shapiro-Wilk test), so statistical significance was assessed by Kruskal-Wallis test with Dunn’s post hoc correction (n = 4 per group). Significance was determined by 1-way ANOVA with Tukey’s HSD test for E (n = 90 for DMSO + DMSO, n = 116 for DMSO + o-L-2HG, n = 89 for GLSi + DMSO, n = 101 for GLSi + o-L-2HG). Data are shown as mean ± 1 SEM.
Given that glutaminase inhibition has been shown to reduce 2HG production and proliferation in IDH1-mutant glioma cells (31), we next investigated the effects of blocking glutamine metabolism by treating unedited NPCs with the glutaminase inhibitor (GLSi) CB-839 or DMSO. GLS inhibition reduced 13C-labeled L-2HG (m+5) derived from [U-13C]glutamine, indicating that GLS is required for glutamine-derived 2HG production in both control and L2HGDH-deficient NPCs in culture (Figure 3C). Consistent with inhibition of glutamine catabolism, treating unedited NPCs with CB-839 increased intracellular glutamine levels (Supplemental Figure 2B). Thus, the metabolic and functional effects of CB-839 in this system are unlikely to result from glutamine depletion, which can alter transcriptional programs (32).
To estimate the share of glutamine utilization resulting in L-2HG formation, we quantified total and labeled intra- and extracellular L-2HG after 4 hours of culture in medium containing [U-13C]glutamine and compared these values to net glutamine consumption. Unedited L2HGDH-deficient NPCs converted 0.46% ± 0.04% of consumed glutamine carbon to L-2HG during this interval, with similar abundances of L-2HG recovered from the intra- and extracellular space (Supplemental Figure 2C). Over the same period in the same cells, 16.85% ± 1.75% of consumed glutamine carbon appeared as secreted glutamate (Supplemental Figure 2D), indicating that production of L-2HG is a minor fate of glutamine carbon under these conditions. NPCs from both patients also displayed extensive labeling of TCA cycle intermediates. Labeling in citrate revealed similar m+4 and m+5 labeling, resulting from oxidation and reductive carboxylation of αKG, respectively (Supplemental Figure 2E).
Next, we evaluated whether CB-839 could enhance neuronal differentiation in L2HGDH-deficient NPCs. Immunofluorescence staining for the neuronal markers MAP2 and β-III-tubulin at day 14 of differentiation revealed approximately a doubling of total neurite length in unedited NPCs from patient 1 (Figure 3, D and E). This effect was completely reversed by supplementing the medium with 30 μM octyl-L-2HG (Figure 3, D and E). Octyl-L-2HG had no suppressive effect on neurite length in unedited cells treated with DMSO, where the intracellular L-2HG concentration is already high (Figure 3E). These results show that targeting cellular metabolism to reduce L-2HG levels can restore neuronal differentiation in L2HGDH-deficient NPCs.
Increased MYC expression in L2HGDH-deficient NPCs and cortical spheroids. To broadly assess the molecular consequences of L2HGDH deficiency in NPCs and better understand the defect in neuronal differentiation, we conducted bulk RNA-seq in control, unedited, and corrected NPCs. Unbiased GSEA (33) identified the upregulation of MYC target genes in unedited NPCs (normalized enrichment score = –5.30) (Figure 4A). Among the 3,494 gene sets examined, 2 MYC target gene sets ranked within the top 10 and 4 ranked within the top 30 in unedited NPCs (Supplemental Figure 3A and Supplemental Table 4). RNA-seq also revealed a marked increase in MYC mRNA levels in unedited patient NPCs compared with both corrected NPCs and control H9 NPCs (Figure 4B). Immunoblot analysis of nuclear lysates revealed elevated c-MYC in unedited NPCs relative to corrected NPCs, supporting the transcriptional data (Figure 4C). Because these cells were generated with nonintegrating Sendai vectors, and Sendai clearance was verified by RT-PCR before downstream differentiation (Supplemental Figure 3B), persistent ectopic MYC from the reprogramming procedure does not explain elevated MYC in the NPCs.
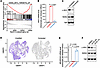 Figure 4
Increased MYC expression in L2HGDH-deficient NPCs and cortical spheroids. (A) GSEA mountain plot showing enrichment of DANG_MYC_TARGETS_UP gene set in unedited versus corrected patient 1 NPCs. (B) Quantification of MYC mRNA in control H9 NPCs, unedited patient 1 NPCs, and corrected patient 1 NPCs. mRNA levels were obtained from RNA-seq of biological triplicates and expressed as transcripts per kilobase million (TPM). (C) Immunoblot analysis of nuclear c-MYC and Neurogenin-2 in unedited and corrected patient 1 NPCs. TBP was used as a loading control for nuclear lysates. (D) UMAP heatmaps displaying MYC expression in scRNA-seq of unedited and corrected day 45 cortical spheroids. Color intensity (purple) indicates MYC transcript levels in individual cells. (E) Quantification of NEUROG2 mRNA in control H9 NPCs, unedited patient 1 NPCs, and corrected patient 1 NPCs. mRNA levels were obtained from RNA-seq of biological triplicates and expressed as TPM. (F) Immunoblot analysis of nuclear c-MYC and Neurogenin-2 in patient 1 NPCs treated with DMSO or 1 μM CB-839 (GLSi) for 4 or 7 days. TBP served as a loading control for nuclear lysates. Significance was determined based on log-transformed TPM values using 1-way ANOVA followed by Tukey’s HSD test for B and E. Data are shown as mean ± 1 SEM of 3 biological replicates.
We also evaluated MYC expression in day 45 cortical spheroids and observed increased MYC transcript levels in unedited spheroids relative to corrected spheroids, visualized by UMAP-based expression heatmaps (Figure 4D). MYC was upregulated in essentially all cell types in unedited spheroids, indicating widespread overexpression (Supplemental Figure 3C). Elevated MYC was observed in neurogenic radial glia, with marked upregulation in cycling intermediate progenitors and cycling gliogenic radial glia. This elevated expression persisted through both neuronal and glial lineages, including late neurogenic precursors, immature neurons, and gliogenic progenitors, suggesting that L-2HG–associated dysregulation of MYC occurs early in lineage commitment and is sustained across multiple descendant cell types. These data confirm that MYC overexpression extends beyond 2D NPC cultures to more complex 3D models of neurodevelopment.
We also evaluated MYCN given its overlap with MYC in neural progenitors (34). In 2D NPC cultures, MYCN transcript abundance showed only a modest increase in unedited cells relative to corrected cells (Supplemental Figure 3D), much smaller than the >12-fold induction observed for MYC (Figure 4B). Notably, MYCN levels in unedited L2HGDH-deficient NPCs remained lower than those in control H9 NPCs (Supplemental Figure 3D). In day 45 cortical spheroids, MYCN expression displayed the opposite pattern from MYC: several progenitor populations, including neurogenic radial glia, cycling gliogenic radial glia, and cycling intermediate progenitors, exhibited higher MYCN expression in corrected spheroids than in unedited spheroids (Supplemental Figure 3E). These findings indicate that MYCN is not the primary driver of altered proliferation and differentiation in L2HGDH-deficient NPCs and that MYC is selectively and disproportionately dysregulated by L-2HG.
Interestingly, we observed a concurrent decrease in Neurogenin-2, a key regulator of neuronal differentiation (35), in unedited cells (Figure 4E). To determine if pharmacological suppression of L-2HG production could mitigate MYC overexpression and restore NEUROG2 (the gene encoding Neurogenin-2) expression, we treated unedited NPCs with CB-839 (GLSi) for 4 or 7 days. The drug reduced nuclear c-MYC levels in a time-dependent manner, accompanied by an increase in Neurogenin-2 expression (Figure 4F).
To validate the increased c-MYC levels in NPCs obtained from the embryonic mouse brain, we used a previously described L2hgdh-knockout mouse model (36). We dissected the dorsal telencephalon of WT and L2hgdh–/– E15.5 mouse embryos and cultured neurospheres ex vivo to obtain NPCs. To test whether L2HGDH deficiency impacts neuronal differentiation in this system, WT and L2hgdh–/– NPCs were differentiated into neurons for 3 weeks, fixed, and immunostained for MAP2 and β-III-tubulin. Quantification of neurite outgrowth revealed that L2hgdh–/– neurons exhibited shorter neurites than their WT counterparts (Supplemental Figure 3F). We then performed immunoblot analysis of nuclear c-MYC in WT and L2hgdh–/– NPCs. Consistent with human NPC data, L2hgdh–/– NPCs exhibited a modest increase in c-MYC protein levels compared with WT NPCs (Supplemental Figure 3, G and H).
L2HGDH-deficient NPCs display enhanced activating histone methylation marks in MYC regulatory regions. Given the potentially broad roles of L-2HG and D-2HG in blocking epigenetic demethylases that use αKG as a cofactor, we compared several aspects of the epigenetic landscape between unedited and corrected NPCs. We did not observe an increase in global DNA methylation at cytosine residues (5mC; Figure 5A) or in global N6-methyladenosine in mRNA (m6A; Figure 5B) in NPCs with L-2HG accumulation. Rather, m6A methylation was somewhat higher in corrected NPCs compared with unedited NPCs. Thus, we did not observe global suppression of 5mC and m6A demethylation in these L2HGDH-deficient cells, despite 2HG’s ability to block TET DNA demethylases and the RNA demethylases ALKBH5 and FTO in other contexts (37, 38). We estimated the total (i.e., noncompartmentalized) intracellular concentration of L-2HG in L2HGDH-deficient NPCs to be 1,425 ± 75 μM (mean ± SEM). This concentration is several fold higher than the reported IC50 values for most histone lysine demethylases (KDMs) (39, 40) and somewhat below the reported IC50 for TET2 (41), which may explain why L-2HG accumulation apparently does not impact global DNA methylation in L2HGDH-deficient NPCs.
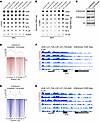 Figure 5
Increased activating histone methylation marks H3K4me2 and H3K4me3 at the MYC locus in L2HGDH-deficient NPCs. (A) DNA dot blot analysis of 5mC levels in NPCs, including control H9 NPCs, control iPSC-derived NPCs, unedited patient 1 NPCs, unedited patient 2 NPCs, corrected patient 1 NPCs, and corrected patient 2 NPCs. (B) m6A dot blot analysis of total RNA in NPCs, including control H9 NPCs, control iPSC-derived NPCs, unedited patient 1 NPCs, unedited patient 2 NPCs, corrected patient 1 NPCs, and corrected patient 2 NPCs. (C) Immunoblot analysis of activating histone markers H3K4me2 and H3K4me3 levels in unedited and corrected patient 1 NPCs. Histone H3 was used as a loading control for histone lysates. (D and E) ChIP-seq profiles of H3K4me2 (D) and H3K4me3 (E) in unedited and corrected patient 1 NPCs. ChIP-seq signals were plotted over center peaks (±5 kb from peak center) identified in corrected patient 1 NPCs. Sites were sorted by the ChIP-seq signal intensity from corrected patient 1 NPCs. (F and G) Representative ChIP-seq tracks showing H3K4me2 (F) and H3K4me3 (G) enrichment at the MYC locus in unedited and corrected patient 1 NPCs.
We next examined histone methylation, focusing on marks associated with active transcription because of the observation that MYC expression is enhanced in L2HGDH-deficient NPCs. Methylation of histone H3, lysine residue 4 (H3K4) is associated with gene activation in development (42). Immunoblot analysis revealed reduced dimethylated and trimethylated H3K4 (H3K4me2 and H3K4me3) in corrected NPCs compared with unedited cells (Figure 5C). To characterize the genomic distribution of these marks, we performed ChIP-seq for H3K4me2 and H3K4me3. Aggregated ChIP-seq signals plotted over peak centers (±5 kb) demonstrated globally increased enrichment of both H3K4me2 and H3K4me3 in unedited NPCs relative to corrected NPCs (Figure 5, D and E). This widespread elevation suggests that L2HGDH deficiency contributes to broad epigenetic reprogramming in NPCs via changes in H3K4 methylation. Unbiased differential binding analysis of H3K4me2 and H3K4me3 ChIP-seq data further confirmed that both marks were prominently increased at MYC regulatory regions and ranked among the most hypermethylated sites in unedited NPCs compared with corrected NPCs (Supplemental Figure 4A and Supplemental Tables 5 and 6). Focusing on the MYC locus, representative ChIP-seq tracks highlighted pronounced enrichment of H3K4me2 and H3K4me3 in unedited NPCs compared with corrected cells (Figure 5, F and G). When all enriched genomic regions were mapped to their associated genes, unbiased Kyoto Encyclopedia of Genes and Genomes overrepresentation analysis identified “cell cycle” as the top enriched pathway for both activating H3K4 methylation marks in unedited NPCs (Supplemental Figure 4, B and C, and Supplemental Tables 7 and 8), aligning with the hyperproliferative phenotype observed in these cells.
KDM5 inhibition recapitulates the effects of L-2HG on H3K4 methylation and neuronal differentiation. KDM5 family enzymes are the primary demethylases responsible for removing H3K4 methylation (43) and are greatly inhibited by L-2HG (10). Given that L2HGDH-deficient NPCs exhibit increased H3K4me2 and H3K4me3 levels, we sought to determine whether pharmacological inhibition of KDM5 would mimic the effects of L-2HG accumulation and impair neuronal differentiation. To test this, we treated corrected patient 1 NPCs with the selective KDM5 inhibitor C70 (44) (25 μM) for 14 days. Immunoblot analysis confirmed that KDM5 inhibition increased H3K4me2 and H3K4me3 levels compared with DMSO-treated controls, supporting KDM5’s role in H3K4 demethylation in these cells (Supplemental Figure 4D). ChIP-seq analysis further revealed that KDM5 inhibition resulted in a genome-wide increase in H3K4me2 and H3K4me3 levels (Supplemental Figure 4, E and F). Representative ChIP-seq tracks confirmed that C70-treated NPCs exhibited higher H3K4me2 and H3K4me3 deposition at the MYC promoter compared with DMSO-treated controls (Supplemental Figure 4, G and H).
Given that L-2HG–mediated MYC overexpression is associated with impaired neuronal differentiation, we next examined whether KDM5 inhibition influenced MYC. qPCR analysis revealed a moderate increase in MYC mRNA abundance in C70-treated NPCs (Supplemental Figure 4I). Similarly, immunoblot analysis of nuclear lysates revealed that C70 treatment resulted in modestly increased c-MYC expression relative to DMSO-treated NPCs (Supplemental Figure 4J). Finally, to assess the functional impact of KDM5 inhibition on neuronal differentiation, we quantified neurite outgrowth following treatment. Consistent with the effects of L-2HG accumulation, C70-treated NPCs exhibited reduced neurite length compared with controls, indicating that KDM5 inhibition negatively impacts neuronal differentiation (Supplemental Figure 4K).
These findings indicate that inhibition of KDM5, like L-2HG accumulation, increases H3K4 methylation, increases MYC expression, and impairs neurite length. This supports the idea that L-2HG may exert its effects, at least in part, through inhibition of KDM5 demethylases.
L2HGDH-deficient NPCs exhibit genome-wide gains of repressive histone methylation that spare the MYC locus. To assess whether L2HGDH deficiency also affects repressive chromatin, we performed ChIP-seq for H3K9me3 and H3K27me3 in unedited and corrected NPCs. Both marks were globally increased in L2HGDH-deficient cells (Supplemental Figure 5, A and B). However, neither H3K9me3 nor H3K27me3 was elevated across the MYC locus (Supplemental Figure 5, C and D). These data indicate that L-2HG drives widespread accumulation of repressive histone methylation marks despite enhanced MYC expression.
c-MYC depletion restores neuronal differentiation in L2HGDH-deficient NPCs. Although correcting mutant L2HGDH alleles reduced H3K4 methylation at hundreds of genomic loci, the prominent effect on the MYC locus and the broad roles of MYC in cell proliferation and differentiation suggested that MYC expression could be sufficient to explain the effects of L2HGDH deficiency. We first ruled out the possibility that impaired neurite length was a nonspecific response to enhanced proliferation. Unedited NPCs were treated with the antimitotic agent nocodazole at a concentration that maintained NPC viability throughout the treatment duration (Supplemental Figure 6A). As expected, nocodazole suppressed NPC proliferation (Supplemental Figure 6B) but had no impact on the expression of c-MYC or Neurogenin-2 (Figure 6A). Similarly, neurite length was not enhanced by nocodazole (Figure 6B). This indicates that cell cycle modulation is insufficient to restore neuronal differentiation in L2HGDH-deficient NPCs.
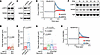 Figure 6
c-MYC depletion restores neuronal differentiation in L2HGDH-deficient NPCs. (A) Immunoblot of nuclear c-MYC and Neurogenin-2 (NGN2) in unedited patient 1 NPCs treated with DMSO or 20 μM nocodazole (Noc) for 7 days. TBP was used as a loading control. (B) Quantification of neurite lengths in patient 1 NPCs treated with DMSO or 20 μM Noc at the NPC stage and throughout 14 day neuronal differentiation. (C) Immunoblot of nuclear c-MYC and Neurogenin-2 in patient 1 NPCs transduced with lentivirus expressing control shRNA (shSCR) or shMYC. (D) Quantification of neurite lengths in patient 1 NPCs transduced with shSCR or shMYC. The dashed line denotes the mean neurite length in corrected neurons. (E) Representative recordings of intracellular Ca2+ dynamics in neurons transduced with shSCR (n = 29) or shMYC (n = 24), captured every 10 seconds using Fura-2 ratio imaging during 45 mM KCl application. Neurons were differentiated for 47 days. (F) Immunoblot of nuclear c-MYC and Neurogenin-2 in patient 1 NPCs treated with DMSO or 50 μM EN4 for the indicated durations. (G) Quantification of neurite lengths in patient 1 NPCs treated with DMSO, EN4 throughout differentiation, EN4 at the NPC stage and throughout differentiation, or EN4 only at the NPC stage. The dashed line indicates the corrected neuron mean. (H) Representative Ca2+ recordings in neurons treated with DMSO (n = 28) or 50 μM EN4 (n = 26), acquired as in E. For B, D, and G, neurite lengths were measured using the SNT plug-in in ImageJ. Data are shown as mean ± 1 SEM. Significance was determined by unpaired 2-tailed Student’s t test for B and D or 1-way ANOVA with Tukey’s HSD test for G.
Next, we used lentiviral shRNA to suppress MYC expression. Immunoblot analysis confirmed reduced c-MYC in NPCs transduced with MYC-targeting shRNA (shMYC) lentivirus compared with a scrambled control RNA (shSCR; Figure 6C). This reduction was accompanied by an increase in Neurogenin-2. Quantification of neurite outgrowth showed that shMYC doubled the average total neurite length in unedited NPCs compared with shSCR controls (Figure 6D). To evaluate whether c-MYC depletion also enhanced functional neuronal properties, we performed calcium imaging on neurons transduced with shMYC. Compared with neurons transduced with shSCR, c-MYC–depleted neurons exhibited markedly increased calcium influx in response to KCl stimulation, indicating enhanced excitability (Figure 6E). This functional improvement mirrors the calcium response observed in corrected neurons (Figure 2I), further supporting the role of c-MYC downregulation in rescuing neuronal function.
To pharmacologically inhibit c-MYC, we assessed small-molecule compounds for acceptable on-target activity and tolerability in NPCs. MYCi975 (45) caused marked cytotoxicity in human NPCs (Supplemental Figure 6C), precluding mechanistic assays at nonlethal doses. 10074-G5 (46), a c-MYC/MAX interaction inhibitor, was better tolerated but did not reduce nuclear c-MYC by immunoblot at the doses tested (Supplemental Figure 6, C and D). We also evaluated EN4, which targets cysteine 171 of c-MYC within an intrinsically disordered region, reducing c-MYC and MAX thermal stability and inhibiting MYC transcriptional activity (47). EN4 reduced c-MYC protein abundance at tolerable doses (Figure 6F and Supplemental Figure 6C). Suppression of c-MYC abundance was time dependent and correlated with increased Neurogenin-2 expression (Figure 6F). Quantification of neurite outgrowth in NPCs subjected to EN4 demonstrated that continuous EN4 treatment during both the NPC and neuronal differentiation stages enhanced total neurite length, nearly to the same degree as correcting the L2HGDH allele (Figure 6G). In contrast, EN4 treatment limited to the NPC stage had no effect compared with controls, indicating that sustained inhibition of c-MYC is necessary to reverse differentiation defects in this model (Figure 6G). To assess functional improvement, we measured neuronal calcium responses using Fura-2 ratio imaging. EN4-treated neurons exhibited enhanced intracellular calcium influx in response to KCl stimulation compared with DMSO-treated controls (Figure 6H), indicating that pharmacologic suppression of c-MYC not only improves neuronal morphology but also restores neuronal function in L2HGDH-deficient cells.
Because MYC can activate L2HGDH transcription in MYC-amplified cancers (48), we also tested whether MYC suppression alters expression of either L2HGDH or D2HGDH. In unedited NPCs, shMYC had no effect on L2HGDH mRNA, but modestly reduced D2HGDH mRNA (Supplemental Figure 6, E and F). Thus, in this context, c-MYC inhibition does not modulate L2HGDH expression.


Copyright © 2026 American Society for Clinical Investigation
ISSN: 0021-9738 (print), 1558-8238 (online)