
Advertisement
Research ArticleImmunologyInflammationNeuroscience
Open Access |  10.1172/JCI196112
Aging-dependent microglial heterogeneity worsens outcomes in models of traumatic brain injury
Zhichao Lu,1,2 Yi Shuai,3 Chenxing Wang,1,2 Zongheng Liu,4 Ziheng Wang,5,6 Qianqian Liu,1,2 Rui Jiang,1,2 Jue Zhu,1,2 Yongqi Zhu,1,2 Weiquan Liao,1,2 Xingjia Zhu,1,2 Jingwei Zhao,7 Kaibin Shi,8,9 Wei Shi,1,2 and Peipei Gong1,2
1Department of Neurosurgery, Research Center of Clinical Medicine, Affiliated Hospital of Nantong University, Medical School of Nantong University, Nantong, China.
2Neuro-Microscopy and Minimally Invasive Translational Medicine Innovation Center, Affiliated Hospital of Nantong University, Nantong, China.
3Faculty of Medicine, The Chinese University of Hong Kong, Shatin, Hong Kong Special Administrative Region, China.
4Department of Neurosurgery, Zhejiang Provincial Hospital of Chinese Medicine, The First Affiliated Hospital of Zhejiang Chinese Medical University, Hangzhou, China.
5MOE Frontier Science Centre for Precision Oncology, University of Macau, Macau Special Administrative Region, China.
6School of Public Health and Preventive Medicine, Monash University, Melbourne, Victoria, Australia.
7Department of General Surgery, Xinhua Hospital Affiliated to Shanghai Jiao Tong University School of Medicine, Shanghai, China.
8Department of Neurology, China National Clinical Research Center for Neurological Diseases, Beijing Tiantan Hospital, Capital Medical University, Beijing, China.
9Chinese Institute for Immunology, Chinese Institutes for Medical Research, Beijing, China.
Address correspondence to: Peipei Gong or Wei Shi, Department of Neurosurgery, Research Center of Clinical Medicine, Affiliated Hospital of Nantong University, Medical School of Nantong University, No. 20 Xisi Road, Chongchuan District, Nantong 226001, China. Email: ntgpp@ntu.edu.cn (PG); fysw@ntu.edu.cn (WS). Or to: Kaibin Shi, Department of Neurology, China National Clinical Research Center for Neurological Diseases, Beijing Tiantan Hospital, Capital Medical University, No. 6 Tiantan Xili, Dongcheng District, Beijing 100050, China. Email: kshi@cimrbj.ac.cn.
Authorship note: Z Lu, YS, CW, and Z Liu contributed equally to this work.
Find articles by Lu, Z. in: PubMed | Google Scholar
1Department of Neurosurgery, Research Center of Clinical Medicine, Affiliated Hospital of Nantong University, Medical School of Nantong University, Nantong, China.
2Neuro-Microscopy and Minimally Invasive Translational Medicine Innovation Center, Affiliated Hospital of Nantong University, Nantong, China.
3Faculty of Medicine, The Chinese University of Hong Kong, Shatin, Hong Kong Special Administrative Region, China.
4Department of Neurosurgery, Zhejiang Provincial Hospital of Chinese Medicine, The First Affiliated Hospital of Zhejiang Chinese Medical University, Hangzhou, China.
5MOE Frontier Science Centre for Precision Oncology, University of Macau, Macau Special Administrative Region, China.
6School of Public Health and Preventive Medicine, Monash University, Melbourne, Victoria, Australia.
7Department of General Surgery, Xinhua Hospital Affiliated to Shanghai Jiao Tong University School of Medicine, Shanghai, China.
8Department of Neurology, China National Clinical Research Center for Neurological Diseases, Beijing Tiantan Hospital, Capital Medical University, Beijing, China.
9Chinese Institute for Immunology, Chinese Institutes for Medical Research, Beijing, China.
Address correspondence to: Peipei Gong or Wei Shi, Department of Neurosurgery, Research Center of Clinical Medicine, Affiliated Hospital of Nantong University, Medical School of Nantong University, No. 20 Xisi Road, Chongchuan District, Nantong 226001, China. Email: ntgpp@ntu.edu.cn (PG); fysw@ntu.edu.cn (WS). Or to: Kaibin Shi, Department of Neurology, China National Clinical Research Center for Neurological Diseases, Beijing Tiantan Hospital, Capital Medical University, No. 6 Tiantan Xili, Dongcheng District, Beijing 100050, China. Email: kshi@cimrbj.ac.cn.
Authorship note: Z Lu, YS, CW, and Z Liu contributed equally to this work.
Find articles by Shuai, Y. in: PubMed | Google Scholar
1Department of Neurosurgery, Research Center of Clinical Medicine, Affiliated Hospital of Nantong University, Medical School of Nantong University, Nantong, China.
2Neuro-Microscopy and Minimally Invasive Translational Medicine Innovation Center, Affiliated Hospital of Nantong University, Nantong, China.
3Faculty of Medicine, The Chinese University of Hong Kong, Shatin, Hong Kong Special Administrative Region, China.
4Department of Neurosurgery, Zhejiang Provincial Hospital of Chinese Medicine, The First Affiliated Hospital of Zhejiang Chinese Medical University, Hangzhou, China.
5MOE Frontier Science Centre for Precision Oncology, University of Macau, Macau Special Administrative Region, China.
6School of Public Health and Preventive Medicine, Monash University, Melbourne, Victoria, Australia.
7Department of General Surgery, Xinhua Hospital Affiliated to Shanghai Jiao Tong University School of Medicine, Shanghai, China.
8Department of Neurology, China National Clinical Research Center for Neurological Diseases, Beijing Tiantan Hospital, Capital Medical University, Beijing, China.
9Chinese Institute for Immunology, Chinese Institutes for Medical Research, Beijing, China.
Address correspondence to: Peipei Gong or Wei Shi, Department of Neurosurgery, Research Center of Clinical Medicine, Affiliated Hospital of Nantong University, Medical School of Nantong University, No. 20 Xisi Road, Chongchuan District, Nantong 226001, China. Email: ntgpp@ntu.edu.cn (PG); fysw@ntu.edu.cn (WS). Or to: Kaibin Shi, Department of Neurology, China National Clinical Research Center for Neurological Diseases, Beijing Tiantan Hospital, Capital Medical University, No. 6 Tiantan Xili, Dongcheng District, Beijing 100050, China. Email: kshi@cimrbj.ac.cn.
Authorship note: Z Lu, YS, CW, and Z Liu contributed equally to this work.
Find articles by Wang, C. in: PubMed | Google Scholar
1Department of Neurosurgery, Research Center of Clinical Medicine, Affiliated Hospital of Nantong University, Medical School of Nantong University, Nantong, China.
2Neuro-Microscopy and Minimally Invasive Translational Medicine Innovation Center, Affiliated Hospital of Nantong University, Nantong, China.
3Faculty of Medicine, The Chinese University of Hong Kong, Shatin, Hong Kong Special Administrative Region, China.
4Department of Neurosurgery, Zhejiang Provincial Hospital of Chinese Medicine, The First Affiliated Hospital of Zhejiang Chinese Medical University, Hangzhou, China.
5MOE Frontier Science Centre for Precision Oncology, University of Macau, Macau Special Administrative Region, China.
6School of Public Health and Preventive Medicine, Monash University, Melbourne, Victoria, Australia.
7Department of General Surgery, Xinhua Hospital Affiliated to Shanghai Jiao Tong University School of Medicine, Shanghai, China.
8Department of Neurology, China National Clinical Research Center for Neurological Diseases, Beijing Tiantan Hospital, Capital Medical University, Beijing, China.
9Chinese Institute for Immunology, Chinese Institutes for Medical Research, Beijing, China.
Address correspondence to: Peipei Gong or Wei Shi, Department of Neurosurgery, Research Center of Clinical Medicine, Affiliated Hospital of Nantong University, Medical School of Nantong University, No. 20 Xisi Road, Chongchuan District, Nantong 226001, China. Email: ntgpp@ntu.edu.cn (PG); fysw@ntu.edu.cn (WS). Or to: Kaibin Shi, Department of Neurology, China National Clinical Research Center for Neurological Diseases, Beijing Tiantan Hospital, Capital Medical University, No. 6 Tiantan Xili, Dongcheng District, Beijing 100050, China. Email: kshi@cimrbj.ac.cn.
Authorship note: Z Lu, YS, CW, and Z Liu contributed equally to this work.
Find articles by Liu, Z. in: PubMed | Google Scholar
1Department of Neurosurgery, Research Center of Clinical Medicine, Affiliated Hospital of Nantong University, Medical School of Nantong University, Nantong, China.
2Neuro-Microscopy and Minimally Invasive Translational Medicine Innovation Center, Affiliated Hospital of Nantong University, Nantong, China.
3Faculty of Medicine, The Chinese University of Hong Kong, Shatin, Hong Kong Special Administrative Region, China.
4Department of Neurosurgery, Zhejiang Provincial Hospital of Chinese Medicine, The First Affiliated Hospital of Zhejiang Chinese Medical University, Hangzhou, China.
5MOE Frontier Science Centre for Precision Oncology, University of Macau, Macau Special Administrative Region, China.
6School of Public Health and Preventive Medicine, Monash University, Melbourne, Victoria, Australia.
7Department of General Surgery, Xinhua Hospital Affiliated to Shanghai Jiao Tong University School of Medicine, Shanghai, China.
8Department of Neurology, China National Clinical Research Center for Neurological Diseases, Beijing Tiantan Hospital, Capital Medical University, Beijing, China.
9Chinese Institute for Immunology, Chinese Institutes for Medical Research, Beijing, China.
Address correspondence to: Peipei Gong or Wei Shi, Department of Neurosurgery, Research Center of Clinical Medicine, Affiliated Hospital of Nantong University, Medical School of Nantong University, No. 20 Xisi Road, Chongchuan District, Nantong 226001, China. Email: ntgpp@ntu.edu.cn (PG); fysw@ntu.edu.cn (WS). Or to: Kaibin Shi, Department of Neurology, China National Clinical Research Center for Neurological Diseases, Beijing Tiantan Hospital, Capital Medical University, No. 6 Tiantan Xili, Dongcheng District, Beijing 100050, China. Email: kshi@cimrbj.ac.cn.
Authorship note: Z Lu, YS, CW, and Z Liu contributed equally to this work.
Find articles by
Wang, Z.
in:
PubMed
|
Google Scholar
|

1Department of Neurosurgery, Research Center of Clinical Medicine, Affiliated Hospital of Nantong University, Medical School of Nantong University, Nantong, China.
2Neuro-Microscopy and Minimally Invasive Translational Medicine Innovation Center, Affiliated Hospital of Nantong University, Nantong, China.
3Faculty of Medicine, The Chinese University of Hong Kong, Shatin, Hong Kong Special Administrative Region, China.
4Department of Neurosurgery, Zhejiang Provincial Hospital of Chinese Medicine, The First Affiliated Hospital of Zhejiang Chinese Medical University, Hangzhou, China.
5MOE Frontier Science Centre for Precision Oncology, University of Macau, Macau Special Administrative Region, China.
6School of Public Health and Preventive Medicine, Monash University, Melbourne, Victoria, Australia.
7Department of General Surgery, Xinhua Hospital Affiliated to Shanghai Jiao Tong University School of Medicine, Shanghai, China.
8Department of Neurology, China National Clinical Research Center for Neurological Diseases, Beijing Tiantan Hospital, Capital Medical University, Beijing, China.
9Chinese Institute for Immunology, Chinese Institutes for Medical Research, Beijing, China.
Address correspondence to: Peipei Gong or Wei Shi, Department of Neurosurgery, Research Center of Clinical Medicine, Affiliated Hospital of Nantong University, Medical School of Nantong University, No. 20 Xisi Road, Chongchuan District, Nantong 226001, China. Email: ntgpp@ntu.edu.cn (PG); fysw@ntu.edu.cn (WS). Or to: Kaibin Shi, Department of Neurology, China National Clinical Research Center for Neurological Diseases, Beijing Tiantan Hospital, Capital Medical University, No. 6 Tiantan Xili, Dongcheng District, Beijing 100050, China. Email: kshi@cimrbj.ac.cn.
Authorship note: Z Lu, YS, CW, and Z Liu contributed equally to this work.
Find articles by Liu, Q. in: PubMed | Google Scholar
1Department of Neurosurgery, Research Center of Clinical Medicine, Affiliated Hospital of Nantong University, Medical School of Nantong University, Nantong, China.
2Neuro-Microscopy and Minimally Invasive Translational Medicine Innovation Center, Affiliated Hospital of Nantong University, Nantong, China.
3Faculty of Medicine, The Chinese University of Hong Kong, Shatin, Hong Kong Special Administrative Region, China.
4Department of Neurosurgery, Zhejiang Provincial Hospital of Chinese Medicine, The First Affiliated Hospital of Zhejiang Chinese Medical University, Hangzhou, China.
5MOE Frontier Science Centre for Precision Oncology, University of Macau, Macau Special Administrative Region, China.
6School of Public Health and Preventive Medicine, Monash University, Melbourne, Victoria, Australia.
7Department of General Surgery, Xinhua Hospital Affiliated to Shanghai Jiao Tong University School of Medicine, Shanghai, China.
8Department of Neurology, China National Clinical Research Center for Neurological Diseases, Beijing Tiantan Hospital, Capital Medical University, Beijing, China.
9Chinese Institute for Immunology, Chinese Institutes for Medical Research, Beijing, China.
Address correspondence to: Peipei Gong or Wei Shi, Department of Neurosurgery, Research Center of Clinical Medicine, Affiliated Hospital of Nantong University, Medical School of Nantong University, No. 20 Xisi Road, Chongchuan District, Nantong 226001, China. Email: ntgpp@ntu.edu.cn (PG); fysw@ntu.edu.cn (WS). Or to: Kaibin Shi, Department of Neurology, China National Clinical Research Center for Neurological Diseases, Beijing Tiantan Hospital, Capital Medical University, No. 6 Tiantan Xili, Dongcheng District, Beijing 100050, China. Email: kshi@cimrbj.ac.cn.
Authorship note: Z Lu, YS, CW, and Z Liu contributed equally to this work.
Find articles by Jiang, R. in: PubMed | Google Scholar
1Department of Neurosurgery, Research Center of Clinical Medicine, Affiliated Hospital of Nantong University, Medical School of Nantong University, Nantong, China.
2Neuro-Microscopy and Minimally Invasive Translational Medicine Innovation Center, Affiliated Hospital of Nantong University, Nantong, China.
3Faculty of Medicine, The Chinese University of Hong Kong, Shatin, Hong Kong Special Administrative Region, China.
4Department of Neurosurgery, Zhejiang Provincial Hospital of Chinese Medicine, The First Affiliated Hospital of Zhejiang Chinese Medical University, Hangzhou, China.
5MOE Frontier Science Centre for Precision Oncology, University of Macau, Macau Special Administrative Region, China.
6School of Public Health and Preventive Medicine, Monash University, Melbourne, Victoria, Australia.
7Department of General Surgery, Xinhua Hospital Affiliated to Shanghai Jiao Tong University School of Medicine, Shanghai, China.
8Department of Neurology, China National Clinical Research Center for Neurological Diseases, Beijing Tiantan Hospital, Capital Medical University, Beijing, China.
9Chinese Institute for Immunology, Chinese Institutes for Medical Research, Beijing, China.
Address correspondence to: Peipei Gong or Wei Shi, Department of Neurosurgery, Research Center of Clinical Medicine, Affiliated Hospital of Nantong University, Medical School of Nantong University, No. 20 Xisi Road, Chongchuan District, Nantong 226001, China. Email: ntgpp@ntu.edu.cn (PG); fysw@ntu.edu.cn (WS). Or to: Kaibin Shi, Department of Neurology, China National Clinical Research Center for Neurological Diseases, Beijing Tiantan Hospital, Capital Medical University, No. 6 Tiantan Xili, Dongcheng District, Beijing 100050, China. Email: kshi@cimrbj.ac.cn.
Authorship note: Z Lu, YS, CW, and Z Liu contributed equally to this work.
Find articles by Zhu, J. in: PubMed | Google Scholar
1Department of Neurosurgery, Research Center of Clinical Medicine, Affiliated Hospital of Nantong University, Medical School of Nantong University, Nantong, China.
2Neuro-Microscopy and Minimally Invasive Translational Medicine Innovation Center, Affiliated Hospital of Nantong University, Nantong, China.
3Faculty of Medicine, The Chinese University of Hong Kong, Shatin, Hong Kong Special Administrative Region, China.
4Department of Neurosurgery, Zhejiang Provincial Hospital of Chinese Medicine, The First Affiliated Hospital of Zhejiang Chinese Medical University, Hangzhou, China.
5MOE Frontier Science Centre for Precision Oncology, University of Macau, Macau Special Administrative Region, China.
6School of Public Health and Preventive Medicine, Monash University, Melbourne, Victoria, Australia.
7Department of General Surgery, Xinhua Hospital Affiliated to Shanghai Jiao Tong University School of Medicine, Shanghai, China.
8Department of Neurology, China National Clinical Research Center for Neurological Diseases, Beijing Tiantan Hospital, Capital Medical University, Beijing, China.
9Chinese Institute for Immunology, Chinese Institutes for Medical Research, Beijing, China.
Address correspondence to: Peipei Gong or Wei Shi, Department of Neurosurgery, Research Center of Clinical Medicine, Affiliated Hospital of Nantong University, Medical School of Nantong University, No. 20 Xisi Road, Chongchuan District, Nantong 226001, China. Email: ntgpp@ntu.edu.cn (PG); fysw@ntu.edu.cn (WS). Or to: Kaibin Shi, Department of Neurology, China National Clinical Research Center for Neurological Diseases, Beijing Tiantan Hospital, Capital Medical University, No. 6 Tiantan Xili, Dongcheng District, Beijing 100050, China. Email: kshi@cimrbj.ac.cn.
Authorship note: Z Lu, YS, CW, and Z Liu contributed equally to this work.
Find articles by Zhu, Y. in: PubMed | Google Scholar
1Department of Neurosurgery, Research Center of Clinical Medicine, Affiliated Hospital of Nantong University, Medical School of Nantong University, Nantong, China.
2Neuro-Microscopy and Minimally Invasive Translational Medicine Innovation Center, Affiliated Hospital of Nantong University, Nantong, China.
3Faculty of Medicine, The Chinese University of Hong Kong, Shatin, Hong Kong Special Administrative Region, China.
4Department of Neurosurgery, Zhejiang Provincial Hospital of Chinese Medicine, The First Affiliated Hospital of Zhejiang Chinese Medical University, Hangzhou, China.
5MOE Frontier Science Centre for Precision Oncology, University of Macau, Macau Special Administrative Region, China.
6School of Public Health and Preventive Medicine, Monash University, Melbourne, Victoria, Australia.
7Department of General Surgery, Xinhua Hospital Affiliated to Shanghai Jiao Tong University School of Medicine, Shanghai, China.
8Department of Neurology, China National Clinical Research Center for Neurological Diseases, Beijing Tiantan Hospital, Capital Medical University, Beijing, China.
9Chinese Institute for Immunology, Chinese Institutes for Medical Research, Beijing, China.
Address correspondence to: Peipei Gong or Wei Shi, Department of Neurosurgery, Research Center of Clinical Medicine, Affiliated Hospital of Nantong University, Medical School of Nantong University, No. 20 Xisi Road, Chongchuan District, Nantong 226001, China. Email: ntgpp@ntu.edu.cn (PG); fysw@ntu.edu.cn (WS). Or to: Kaibin Shi, Department of Neurology, China National Clinical Research Center for Neurological Diseases, Beijing Tiantan Hospital, Capital Medical University, No. 6 Tiantan Xili, Dongcheng District, Beijing 100050, China. Email: kshi@cimrbj.ac.cn.
Authorship note: Z Lu, YS, CW, and Z Liu contributed equally to this work.
Find articles by Liao, W. in: PubMed | Google Scholar
1Department of Neurosurgery, Research Center of Clinical Medicine, Affiliated Hospital of Nantong University, Medical School of Nantong University, Nantong, China.
2Neuro-Microscopy and Minimally Invasive Translational Medicine Innovation Center, Affiliated Hospital of Nantong University, Nantong, China.
3Faculty of Medicine, The Chinese University of Hong Kong, Shatin, Hong Kong Special Administrative Region, China.
4Department of Neurosurgery, Zhejiang Provincial Hospital of Chinese Medicine, The First Affiliated Hospital of Zhejiang Chinese Medical University, Hangzhou, China.
5MOE Frontier Science Centre for Precision Oncology, University of Macau, Macau Special Administrative Region, China.
6School of Public Health and Preventive Medicine, Monash University, Melbourne, Victoria, Australia.
7Department of General Surgery, Xinhua Hospital Affiliated to Shanghai Jiao Tong University School of Medicine, Shanghai, China.
8Department of Neurology, China National Clinical Research Center for Neurological Diseases, Beijing Tiantan Hospital, Capital Medical University, Beijing, China.
9Chinese Institute for Immunology, Chinese Institutes for Medical Research, Beijing, China.
Address correspondence to: Peipei Gong or Wei Shi, Department of Neurosurgery, Research Center of Clinical Medicine, Affiliated Hospital of Nantong University, Medical School of Nantong University, No. 20 Xisi Road, Chongchuan District, Nantong 226001, China. Email: ntgpp@ntu.edu.cn (PG); fysw@ntu.edu.cn (WS). Or to: Kaibin Shi, Department of Neurology, China National Clinical Research Center for Neurological Diseases, Beijing Tiantan Hospital, Capital Medical University, No. 6 Tiantan Xili, Dongcheng District, Beijing 100050, China. Email: kshi@cimrbj.ac.cn.
Authorship note: Z Lu, YS, CW, and Z Liu contributed equally to this work.
Find articles by Zhu, X. in: PubMed | Google Scholar
1Department of Neurosurgery, Research Center of Clinical Medicine, Affiliated Hospital of Nantong University, Medical School of Nantong University, Nantong, China.
2Neuro-Microscopy and Minimally Invasive Translational Medicine Innovation Center, Affiliated Hospital of Nantong University, Nantong, China.
3Faculty of Medicine, The Chinese University of Hong Kong, Shatin, Hong Kong Special Administrative Region, China.
4Department of Neurosurgery, Zhejiang Provincial Hospital of Chinese Medicine, The First Affiliated Hospital of Zhejiang Chinese Medical University, Hangzhou, China.
5MOE Frontier Science Centre for Precision Oncology, University of Macau, Macau Special Administrative Region, China.
6School of Public Health and Preventive Medicine, Monash University, Melbourne, Victoria, Australia.
7Department of General Surgery, Xinhua Hospital Affiliated to Shanghai Jiao Tong University School of Medicine, Shanghai, China.
8Department of Neurology, China National Clinical Research Center for Neurological Diseases, Beijing Tiantan Hospital, Capital Medical University, Beijing, China.
9Chinese Institute for Immunology, Chinese Institutes for Medical Research, Beijing, China.
Address correspondence to: Peipei Gong or Wei Shi, Department of Neurosurgery, Research Center of Clinical Medicine, Affiliated Hospital of Nantong University, Medical School of Nantong University, No. 20 Xisi Road, Chongchuan District, Nantong 226001, China. Email: ntgpp@ntu.edu.cn (PG); fysw@ntu.edu.cn (WS). Or to: Kaibin Shi, Department of Neurology, China National Clinical Research Center for Neurological Diseases, Beijing Tiantan Hospital, Capital Medical University, No. 6 Tiantan Xili, Dongcheng District, Beijing 100050, China. Email: kshi@cimrbj.ac.cn.
Authorship note: Z Lu, YS, CW, and Z Liu contributed equally to this work.
Find articles by Zhao, J. in: PubMed | Google Scholar
1Department of Neurosurgery, Research Center of Clinical Medicine, Affiliated Hospital of Nantong University, Medical School of Nantong University, Nantong, China.
2Neuro-Microscopy and Minimally Invasive Translational Medicine Innovation Center, Affiliated Hospital of Nantong University, Nantong, China.
3Faculty of Medicine, The Chinese University of Hong Kong, Shatin, Hong Kong Special Administrative Region, China.
4Department of Neurosurgery, Zhejiang Provincial Hospital of Chinese Medicine, The First Affiliated Hospital of Zhejiang Chinese Medical University, Hangzhou, China.
5MOE Frontier Science Centre for Precision Oncology, University of Macau, Macau Special Administrative Region, China.
6School of Public Health and Preventive Medicine, Monash University, Melbourne, Victoria, Australia.
7Department of General Surgery, Xinhua Hospital Affiliated to Shanghai Jiao Tong University School of Medicine, Shanghai, China.
8Department of Neurology, China National Clinical Research Center for Neurological Diseases, Beijing Tiantan Hospital, Capital Medical University, Beijing, China.
9Chinese Institute for Immunology, Chinese Institutes for Medical Research, Beijing, China.
Address correspondence to: Peipei Gong or Wei Shi, Department of Neurosurgery, Research Center of Clinical Medicine, Affiliated Hospital of Nantong University, Medical School of Nantong University, No. 20 Xisi Road, Chongchuan District, Nantong 226001, China. Email: ntgpp@ntu.edu.cn (PG); fysw@ntu.edu.cn (WS). Or to: Kaibin Shi, Department of Neurology, China National Clinical Research Center for Neurological Diseases, Beijing Tiantan Hospital, Capital Medical University, No. 6 Tiantan Xili, Dongcheng District, Beijing 100050, China. Email: kshi@cimrbj.ac.cn.
Authorship note: Z Lu, YS, CW, and Z Liu contributed equally to this work.
Find articles by Shi, K. in: PubMed | Google Scholar
1Department of Neurosurgery, Research Center of Clinical Medicine, Affiliated Hospital of Nantong University, Medical School of Nantong University, Nantong, China.
2Neuro-Microscopy and Minimally Invasive Translational Medicine Innovation Center, Affiliated Hospital of Nantong University, Nantong, China.
3Faculty of Medicine, The Chinese University of Hong Kong, Shatin, Hong Kong Special Administrative Region, China.
4Department of Neurosurgery, Zhejiang Provincial Hospital of Chinese Medicine, The First Affiliated Hospital of Zhejiang Chinese Medical University, Hangzhou, China.
5MOE Frontier Science Centre for Precision Oncology, University of Macau, Macau Special Administrative Region, China.
6School of Public Health and Preventive Medicine, Monash University, Melbourne, Victoria, Australia.
7Department of General Surgery, Xinhua Hospital Affiliated to Shanghai Jiao Tong University School of Medicine, Shanghai, China.
8Department of Neurology, China National Clinical Research Center for Neurological Diseases, Beijing Tiantan Hospital, Capital Medical University, Beijing, China.
9Chinese Institute for Immunology, Chinese Institutes for Medical Research, Beijing, China.
Address correspondence to: Peipei Gong or Wei Shi, Department of Neurosurgery, Research Center of Clinical Medicine, Affiliated Hospital of Nantong University, Medical School of Nantong University, No. 20 Xisi Road, Chongchuan District, Nantong 226001, China. Email: ntgpp@ntu.edu.cn (PG); fysw@ntu.edu.cn (WS). Or to: Kaibin Shi, Department of Neurology, China National Clinical Research Center for Neurological Diseases, Beijing Tiantan Hospital, Capital Medical University, No. 6 Tiantan Xili, Dongcheng District, Beijing 100050, China. Email: kshi@cimrbj.ac.cn.
Authorship note: Z Lu, YS, CW, and Z Liu contributed equally to this work.
Find articles by Shi, W. in: PubMed | Google Scholar
1Department of Neurosurgery, Research Center of Clinical Medicine, Affiliated Hospital of Nantong University, Medical School of Nantong University, Nantong, China.
2Neuro-Microscopy and Minimally Invasive Translational Medicine Innovation Center, Affiliated Hospital of Nantong University, Nantong, China.
3Faculty of Medicine, The Chinese University of Hong Kong, Shatin, Hong Kong Special Administrative Region, China.
4Department of Neurosurgery, Zhejiang Provincial Hospital of Chinese Medicine, The First Affiliated Hospital of Zhejiang Chinese Medical University, Hangzhou, China.
5MOE Frontier Science Centre for Precision Oncology, University of Macau, Macau Special Administrative Region, China.
6School of Public Health and Preventive Medicine, Monash University, Melbourne, Victoria, Australia.
7Department of General Surgery, Xinhua Hospital Affiliated to Shanghai Jiao Tong University School of Medicine, Shanghai, China.
8Department of Neurology, China National Clinical Research Center for Neurological Diseases, Beijing Tiantan Hospital, Capital Medical University, Beijing, China.
9Chinese Institute for Immunology, Chinese Institutes for Medical Research, Beijing, China.
Address correspondence to: Peipei Gong or Wei Shi, Department of Neurosurgery, Research Center of Clinical Medicine, Affiliated Hospital of Nantong University, Medical School of Nantong University, No. 20 Xisi Road, Chongchuan District, Nantong 226001, China. Email: ntgpp@ntu.edu.cn (PG); fysw@ntu.edu.cn (WS). Or to: Kaibin Shi, Department of Neurology, China National Clinical Research Center for Neurological Diseases, Beijing Tiantan Hospital, Capital Medical University, No. 6 Tiantan Xili, Dongcheng District, Beijing 100050, China. Email: kshi@cimrbj.ac.cn.
Authorship note: Z Lu, YS, CW, and Z Liu contributed equally to this work.
Find articles by Gong, P. in: PubMed | Google Scholar
Published April 2, 2026 - More info
J Clin Invest. 2026;136(12):e196112. https://doi.org/10.1172/JCI196112.
© 2026 Lu et al. This work is licensed under the Creative Commons Attribution 4.0 International License. To view a copy of this license, visit http://creativecommons.org/licenses/by/4.0/.
Received: May 28, 2025; Accepted: March 19, 2026

Related article:
Abstract
Traumatic brain injury (TBI) disproportionately kills and disables older adults, yet the biology driving this vulnerability remains unresolved. In this issue of the JCI, Lu et al. combined single-cell transcriptomics, metabolomics, and chromatin profiling in mice, validated in human TBI tissue, to define an age-dependent microglial dichotomy. They report that an NLRP3+/IL-1β–linked state dominates the aged brain, while a Lysozyme+/Lyz2+ state predominates in the young. Microglia-targeted perturbation of NLRP3 and ELF1 each shifted the balance and improved survival in mouse models of TBI, and the repurposed drug Imeglimin improved outcomes in these models, confirming that this pathway is druggable. By connecting NLRP3 inflammasome dominance, ELF1-driven transcription, and glycolytic reprogramming to the loss of a protective Lyz2+ response, this work converts age from a clinical risk factor to a set of druggable microglial targets.
Authors
Josh M. Morganti, Adam D. Bachstetter

-
Results
Microglia responses are more severe in aged TBI patients and mice. Aged patients with TBI often show poorer recovery and higher mortality than younger individuals, which may be mediated by exaggerated neuroinflammation in aged patients. To comprehensively characterize how aging affects brain inflammatory response after TBI, we used a droplet-based scRNA-seq technique to isolate cells from the injured hemisphere of aged and young mice at 72 hours after TBI modeling, which was designed to observe transcriptome alterations during the acute phase (Figure 1A). We performed unsupervised clustering and cell-type annotation based on classical gene markers. As shown in the UMAP plot, 12 distinct cell types were identified, including oligodendrocytes (19,721), microglia (61,707), macrophages (5,688), fibroblasts (3,239), astrocytes (2,735), epithelial cells (8,267), endothelial cells (27,796), neurons (1,824), T cells (2,661), B cells (1,183), granulocytes (2,384), and monocytes (2,139) (Figure 1, B and D, and Supplemental Table 1; supplemental material available online with this article; https://doi.org/10.1172/JCI196112DS1). Consistent with previous findings, we also identified the presence of circulating immune cells, such as macrophages, monocytes, neutrophils, and T and B cells, in the brain after TBI (19, 20).
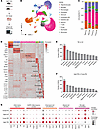 Figure 1
Aging enhances microglia responses after TBI. (A) The injured cerebral hemispheres of aged TBI mice (18 months old) and young TBI mice (4 months old) were collected, dissociated, and subjected to single-cell sequencing at day 3 after TBI. n = 3/group. (B) UMAP plot shows different cell types in the brain, distinguished by different colors. (C) Proportional stack plots show the percentage of different cell types in the brains from young sham-operated control group (Young-Ctrl), aged sham-operated control group (Aged-Ctrl), young TBI group (Young-TBI), and aged TBI group (Aged-TBI), distinguished by different colors. (D) Top 10 gene markers for each cell type; characteristic markers are labeled. (E) Number of DEGs between TBI groups and control groups (adjusted P < 0.05). Microglia showed the highest number of DEGs (759 genes). (F) Number of DEGs between Aged-TBI and Young-TBI groups (adjusted P < 0.05). Microglia showed the highest number of DEGs (594 genes). (G) Expression levels of selected genes in microglia and genes selected from the enriched GO terms in the set of DEGs under different conditions. The size of the dots corresponds to the proportion of cells in each condition, and the color indicates the average expression level. The schematic was generated using BioRender.
In aged mice, significant microglia proliferation was observed following TBI, whereas this phenomenon was not prominent in young mice (Figure 1C and Supplemental Figure 1, A and B). Orthogonal validation via flow cytometry confirmed the findings from scRNA-seq. Specifically, TBI led to a significant increase in microglial abundance, with aged microglia showing a more pronounced expansion compared with their younger counterparts (Supplemental Figure 1, C and D).
TBI induced extensive differential gene regulation, with microglia populations showing the most pronounced changes (Figure 1E). Notably, aged microglia exhibited the highest number of differentially expressed genes (DEGs) compared with their younger counterparts after TBI, highlighting distinct age-specific transcriptional remodeling in microglia after injury (Figure 1F). The signature of aged microglia after TBI was associated with a proinflammatory phenotype, including genes involved in inflammatory responses (e.g., Tnf, Nod2, Il6, and Tlr4), NLRP3 inflammasome complex–related genes (e.g., Nlrp3, Il1b, and Casp1), genes involved in cellular chemotaxis and adhesion (Fn1, Ccl5, Icam1, and Itga7), and myeloid cell activation–related genes (Cd68, Nos2, and H2-Aa). However, genes related to microglia homeostasis (Havcr2, Mef2c, Il4, and Tgf1) were downregulated in microglia from aged TBI mice (Figure 1G).
To translate these preclinical findings to a clinical context, we obtained injured brain tissue samples from 13 young and 22 aged patients with TBI who underwent surgery and examined the proportion of microglia. Consistent with the insights obtained from murine models, aged TBI patients exhibited a more robust microglial response compared with young patients (Supplemental Figure 1, E and F). RT-qPCR of patients’ microglia revealed the distinct age-specific cytokine expression profiles. Proinflammatory cytokines IL1B, IL6, and TNF were significantly upregulated in microglia from aged patients, whereas the transcripts of antiinflammatory cytokines IL4, IL10, and TGFB1 were upregulated in microglia from young patients (Supplemental Figure 1G).
NLPR3+ microglia orchestrate detrimental outcomes in aged TBI. To decipher how aging affects the transcriptional profile of microglia after TBI, we clustered microglia from different samples and observed substantial heterogeneity among microglia after TBI. The UMAP plot shows 5 states consisting of Nlrp3+ (Nlrp3+Il1b+Casp1+), Lyz2+ (Lyz2+Cst7+Spp1+), Ccl5+ (Ccl5+Cxcl10+), Nav2+ (Nav2+Runx1+), and H2-Eb1+ (H2-Eb1+H2-Ab1+) microglia after TBI (Figure 2, A–C). For instance, H2-Eb1+ microglia exhibit high expression of MHC-II molecules, representing a population of microglia that may have antigen-presenting capacity. We identified clusters that may represent features of the inflammatory response (Nlrp3+) and specific chemotaxis (Ccl5+). Some subsets of our data show partial concordance with previously published reports; characteristic genes of Lyz2+ microglia, such as Cst7 and Spp1, are widely identified in stage 2 DAMs (15, 21), and the sensitivity of Lyz2+ microglia to IL-4 suggests its important role in limiting neuroinflammation (Figure 2D). In summary, our microglial atlas not only captures known microglia subpopulation features, but also reveals potentially uncharacterized microglia subpopulations.
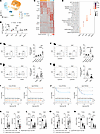 Figure 2
NLRP3+ microglia worsen the prognosis of TBI in aged mice. (A) UMAP plot shows the different microglia subpopulations, distinguished by different colors. n = 3/group. (B) Bar plots show the changes in the proportion of each microglial subset in young and aged mice before and after TBI. n = 3/group. (C) Gene expression heatmap (top 50 expressed) in microglia subpopulations. (D) Functional annotation of different microglia subpopulations. (E and F) Representative flow cytometry results and bar plots show the proportions of NLRP3+ and Lysozyme+ microglia in aged and young mice at 3 days before and after TBI. n = 6/group. (G and H) Representative flow cytometry results show the proportions of NLRP3+ and Lysozyme+ microglia in aged and young patients with TBI. Young, n = 13; aged, n = 22. (I) Survival curves of aged and young mice after AAV-Cx3cr1-Cre KO of Nlrp3 in microglia after TBI (start: nAAV-Cx3cr1-Cre-Sham = 12, nAAV-Cx3cr1-Cre-TBI = 20, and nAAV-Cx3cr1-TBI = 20). (J) Survival curves of aged and young mice after AAV-Cx3cr1-Cre KO of Lyz2 in microglia after TBI (start: nAAV-Cx3cr1-Cre-Sham = 12, nAAV-Cx3cr1-Cre-TBI = 20, and nAAV-Cx3cr1-TBI = 20). (K) mNSSs after 45 days of TBI under different conditions related to I. Young: nAAV-Cx3cr1-Cre-Sham = 12, nAAV-Cx3cr1-Cre-TBI = 19, and nAAV-Cx3cr1-TBI = 18. Aged: nAAV-Cx3cr1-Cre-Sham = 12, nAAV-Cx3cr1-Cre-TBI = 19, and nAAV-Cx3cr1-TBI = 14. (L) Rotarod test after 45 days of TBI under different conditions related to I. The number of animals in each group is consistent with K. (M) mNSSs after 45 days of TBI under different conditions related to J. Young: nAAV-Cx3cr1-Cre-Sham = 12, nAAV-Cx3cr1-Cre-TBI = 14, nAAV-Cx3cr1-TBI = 19. Aged: nAAV-Cx3cr1-Cre-Sham = 12, nAAV-Cx3cr1-Cre-TBI = 11, nAAV-Cx3cr1-TBI = 16. (N) Rotarod test after 45 days of TBI under different conditions related to J. The number of animals in each group is consistent with M. Data are presented as mean ± SEM. *P < 0.05, **P < 0.01, ***P < 0.001, ****P < 0.001. Statistical analyses were performed using unpaired 2-tailed Student’s t test (G and H), 2-way ANOVA followed by Tukey’s post hoc test (E, F, and K–N), and Kaplan-Meier survival analysis (I and J). The schematic was generated using BioRender.
The Nlrp3+ cluster representing neuroinflammatory responses was upregulated in aged microglia after TBI, while the Lyz2+ cluster representing tissue repair and myeloid homeostasis showed enhanced enrichment in young microglia (Figure 2B). To determine the representativeness of the markers for each microglia cluster suggested by scRNA-seq, we used the cluster 0–specific marker NLRP3 and the cluster 1–specific marker Lysozyme (the protein encoded by the Lyz2 gene) to label different clusters of microglia. The proportion of NLRP3+ microglia infiltrating the injured area was higher in aged TBI mice, whereas the opposite was true for Lysozyme+ microglia (Figure 2, E and F, and Supplemental Figure 2). To extend this finding to a broader spectrum of brain injury states, we validated it in mice models of repetitive mild TBI (rmTBI). In rmTBI mice, our findings still hold, with aged mice characterized by enhanced NLRP3+ microglia responses, whereas young microglia exhibited increased Lysozyme+ phenotype after brain injury (Supplemental Figure 3, A–D). Flow cytometry and representative immunofluorescence results of different ages of patients with TBI corroborated the insights generated from TBI mice that aged microglia responses after TBI were dominated by the NLRP3+ cluster, whereas young microglia responses were dominated by the Lysozyme+ cluster (Figure 2, G and H, Supplemental Figure 4, and Supplemental Figure 5).
To investigate the effect of different microglia subpopulations on the prognosis of patients with TBI, we used the AAV-Cx3cr1-Cre virus to knock out microglial Nlrp3 in Nlrp3fl/fl mice after TBI. Through Ai9 reporter mice, we confirmed the specificity of this microglia-targeting strategy (Supplemental Figure 6, A–E). Flow cytometry confirmed the specific deletion of NLRP3 in microglia (Supplemental Figure 7, A and B). After Nlrp3 KO in microglia, TBI mice exhibited lower mortality and better neurological recovery (lower modified Neurological Severity Score [mNSS] and prolonged latency to fall from the rotarod test) (Figure 2, I, K, and L). Furthermore, we explored the efficacy of MCC950, a selective inhibitor of NLRP3. MCC950 administration reduced mortality and NLRP3+ microglia responses in the acute-phase aged TBI mice (Supplemental Figure 8, A–D). Suppression of neuroinflammation after MCC950 treatment significantly improved neurological recovery in aged TBI mice (Supplemental Figure 8E). Interestingly, we also found that MCC950 prevented the brain infiltration of circulating lymphocytes after TBI by suppressing the transcription of lymphocyte chemotactic factor in microglia (Supplemental Figure 8, F–I).
In contrast, after Lyz2 KO in microglial, both aged and young TBI mice exhibited higher mortality and worse neurologic prognosis (higher mNSSs and shorter latency to fall from the rotarod tests) (Figure 2, J, M, and N, and Supplemental Figure 7C). Together, these findings suggest that the age-specific signature of enhanced NLRP3+ microglial responses coupled with impaired Lysozyme+ microglial function may contribute to the poorer prognosis of aged mice following TBI.
Metabolic reprogramming underlies proinflammatory phenotype of NLRP3+ microglia. To unravel the mechanisms underlying the enhanced proinflammatory response of aged microglia, we performed gene set variation analysis (GSVA) comparing NLRP3+ and Lysozyme+ microglia. GSVA indicated that NLRP3+ microglia upregulate inflammation-related signaling pathways (Figure 3A). Notably, NLRP3+ microglia may increase their dependence on glycolysis, while the energy metabolism of young microglia may be dependent on the TCA cycle and OXPHOS. This observation was validated by analyzing the expression of genes associated with these target metabolic pathways by AddModuleScore (Figure 3, B and C). Subsequently, we detected real-time changes in extracellular acidification rate (ECAR) and oxygen consumption rate (OCR) in NLRP3+ microglia and Lysozyme+ microglia by Seahorse. We observed aging-induced increases in ECAR and decreases in OCR, representing the enhancement of cellular glycolysis along with the weakening of TCA, which was consistent with our scRNA-seq analysis (Figure 3, D and E).
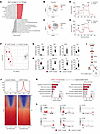 Figure 3
Enhanced aging-induced glycolysis induces the generation of NLRP3+ microglia. (A) GVSA enrichment of differential biological functions between Nlrp3+ and Lyz2+ microglia. (B and C) Gene score feature plots in microglia using representative genes involved in glycolysis and the TCA cycle. (D) Line plot shows the ECAR of NLRP3+ and Lysozyme+ microglia sorted from TBI mice. n = 3/group. (E) Line plot shows the OCR of NLRP3+ and Lysozyme+ microglia sorted from TBI mice. n = 3/group. (F) Distribution of untargeted metabolomics of NLRP3+ and Lysozyme+ microglia in principal component analysis PCA space. n = 6/group. (G and H) Bar plots show the relative abundance of metabolites related to energy metabolism and the TCA cycle in NLRP3+ and Lysozyme+ microglia. n = 6/group. (I) NLRP3+ microglia from aged TBI mice show significantly higher 13C-labeling efficiency in glyceraldehyde-3-phosphate (G3P), pyruvate, and lactate compared with Lysozyme+ microglia from young TBI mice. n = 4/group. (J) Density heatmap of differential open chromatin regions in NLRP3+ and Lysozyme+ microglia. n = 3/group. (K) GO (left) and KEGG (right) enrichment of genes associated with higher chromatin accessibility in NLRP3+ microglia compared with Lysozyme+ microglia. (L) Integrative Genomics Viewer plots show chromatin accessibility of Cdkn1a (p16), Cdkm2a (p21), Nlrp3, Casp1, Il1b, and Il18 in NLRP3+ and Lysozyme+ microglia. Data are presented as mean ± SEM. *P < 0.05, **P < 0.01, ***P < 0.001, ****P < 0.001. Statistical analyses were performed using unpaired 2-tailed Student’s t test (G and H).
Microglial function is closely related to the metabolic state (16). To further characterize age-related metabolic differences in microglia after TBI, we purified microglia from aged and young TBI mice via FACS and performed untargeted metabolomics analysis. Aging drove distinct metabolic remodeling in microglia, with NLRP3+ microglia separating from Lysozyme+ microglia along principal component 1, which accounted for 88.6% of the variance (Figure 3F). We observed that NADH and FADH2 equivalents for ATP generation by the electron transport chain were significantly decreased in NLRP3+ microglia (Figure 3G). For this reason, we explored the metabolites associated with TCA activity in microglia. Notably, we detected a decrease in most TCA intermediates in NLRP3+ microglia, including acetyl-CoA, α-ketoglutarate, citrate, and malate (Figure 3H).
To directly validate the glycolytic flux in microglial subsets, we performed U-13C6-glucose metabolic tracing experiments and analyzed the isotope labeling patterns of glycolytic intermediates. After incubating sorted microglia with U-13C6-glucose for 60 minutes, NLRP3+ microglia from aged TBI mice showed significantly higher ¹³C-labeling efficiency in glyceraldehyde-3-phosphate, pyruvate, and lactate compared with Lysozyme+ microglia from young TBI mice (Figure 3I). Collectively, these data suggested that metabolic reprogramming in aging-associated NLRP3+ microglia strongly favors glycolytic dependence.
Previous studies have suggested that metabolic reprogramming of microglia may be associated with altered chromatin accessibility (17, 22). We hypothesized that the glycolytic preference of NLRP3+ microglia drives the acquisition of proinflammatory chromatin features. To test this, we performed ATAC-seq on NLRP3+ microglia versus Lysozyme+ microglia to reveal the link between metabolic reprogramming and the inflammatory chromatin landscape and observed increased chromatin accessibility in NLRP3+ microglia (Figure 3J). Functional enrichment analysis revealed that regions of increased accessibility in the chromatin of NLRP3+ microglia were associated with upregulation of inflammatory responses and inflammation-related signaling pathways (Figure 3K). Importantly, compared with Lysozyme+ microglia, NLRP3+ microglia acquired specific peaks in genes associated with cellular senescence (Cdkn1a and Cdkn2a) and the NLRP3 inflammasome complex (Nlrp3, Casp1, Il1b, and Il18) (Figure 3L). RT-qPCR further confirmed that NLRP3+ microglia enhanced transcription of senescence-associated secretory phenotype markers, including Cdkn1a, Cdkn2a, Il1b, and Il18 (Supplemental Figure 9A). Overall, our data connect energy metabolism rewiring with altered chromatin accessibility, explaining how aging upregulates the proportion of NLRP3+ microglia after TBI.
ELF1 governs the transcriptional features of age-associated NLRP3+ microglia formation. We found that aging-induced impairment of energy metabolism may regulate the inflammatory state of microglia across different age groups by modulating chromatin accessibility. We next sought to identify the intracellular regulators that drive the generation of NLRP3+ microglia and employed the SCENIC algorithm to dissect the key molecular mechanisms. We observed that a wide range of inflammatory response–associated transcriptional regulators (TFs) were involved in the development of NLRP3+ microglia. Specifically, genes related to the NF-κB signaling pathway (Rela and Relb), the MAPK signaling pathway (Fos and Jun), and the JAK/STAT signaling pathway (Stat1 and Stat3) were found to be implicated in the formation of NLRP3+ microglia (Figure 4A).
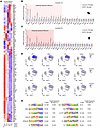 Figure 4
Inflammation-related TFs are associated with the formation of NLRP3+ microglia. (A) SCENIC heatmap of TF-regulated microglia subpopulations based on scRNA-seq. (B) Bar plots show the qPCR results of 29 alternative TFs in NLRP3+ and Lysozyme+ microglia sorted from TBI mice. n = 6/group. (C) qPCR analysis of 29 alternative TFs in NLRP3+ and Lysozyme+ microglia sorted from patients with TBI. nNLRP3+ = 11, nLysozyme+ = 9. (D) Feature plots show the expression of 12 differential TFs coregulated in human and mouse NLRP3+ microglia in different subpopulations of microglia. (E) Tables illustrating the ATAC-seq motif enrichment analysis for NLRP3+ microglia. Data are presented as mean ± SEM. Statistical analyses were performed using unpaired 2-tailed Student’s t test (B and C). The schematic was generated using BioRender.
To further characterize NLRP3+ microglia, we validated 29 human homologs of SCENIC-identified differentially expressed TFs in mouse and human NLRP3+ microglia. Twelve TFs (ELF1, NFKB2, REL, CEBPB, RELA, FLI1, NFKB1, STAT3, JUN, JUNB, FOSB, and FOS) were concordantly upregulated in both species, emerging as potential regulators of NLRP3+ microglial formation (Figure 4, B and C). Feature plots confirmed these TFs were barely expressed in Lysozyme+ microglia (Figure 4D). Next, we performed motif enrichment of these selected TFs using ATAC-seq. The results showed that these TFs, which are known to play a key role in mediating the inflammatory cascade response, were enriched in NLRP3+ microglia (Figure 4E).
To identify the TFs that mainly drive human NLRP3+ microglia formation, we infected a preconstructed Cas9-GFP human microglia cell line (HMC3) with sgRNAs targeting each TF. These cells were mixed with normal HMC3 cells and cocultured with needle scratch–injured SH-SY5Y neurons (Figure 5A). We quantified the live GFP+/GFP– microglia ratio and verified genome editing efficiency using ITGAM-specific sequences (Figure 5, B and C). We identified 8 TFs (ELF1, NFKB2, RELA, FLI1, NFKB1, JUN, JUNB, and FOSB) that significantly promote NLRP3+ microglia formation; ELF1 ablation exhibited the strongest inhibitory effects on NLRP3+ microglia generation and IL-1β secretion (Figure 5, D–F, and Supplemental Figure 11, A and B). Notably, ablation of ELF1 in microglia had little effect on the microglial viability (Figure 5, G and H). In Cas9+ HMC3 monocultures, 3 distinct ELF1-targeting sgRNAs reduced NLRP3+ microglia formation, ruling out off-target effects (Supplemental Figure 10, A and B).
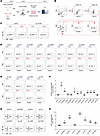 Figure 5
ELF1 predominantly regulates the formation of NLRP3+ microglia. (A) Microglia expressing Cas9-GFP were admixed with normal microglia at a certain ratio, and flow cytometry (FC) was performed after 2 days of cocultivation with broken neurons using sgRNA-induced ablation of the target gene. (B) Flow cytometry strategy for detecting NLPR3+ microglia in GFP– (Cas9–) and GFP+ (Cas9+) microglia. (C) Gene editing efficiency of sgRNAs was assayed using sg-ITGAM. (D–F) Changes in the proportion of NLRP3+ microglia after ablation of 12 alternative TFs. n = 3/group. (G and H) Changes in the proportion of GFP–/GFP+ microglia indicating the cell survival ratio of GFP+ microglia after ablation of 8 alternative TFs. n = 3/group. Data are presented as mean ± SEM. *P < 0.05, **P < 0.01. Statistical analyses were performed using unpaired 2-tailed Student’s t test (F and H). The schematic was generated using BioRender.
To clarify the specific role of ELF1 in NLRP3+ microglia formation, we established a THP-1-Cas9-GFP cell line and ELF1 KO. While ELF1 ablation attenuated TBI-induced IL-1β secretion in THP-1 cells, the effect was weaker than in the HMC3 cell line. Quantitative comparison further confirmed that ELF1 plays a far more prominent role in regulating inflammation in microglia than peripheral myeloid cells (Supplemental Figure 11, C–H).
Ablation of Elf1 reverses aging-related microglia dysfunction and improves the outcome of TBI mice. To further investigate ELF1’s in vivo regulation of microglial inflammatory responses, we crossed Elf1fl/fl mice with Cx3cr1creERT2 mice (Cre-only) and constructed Elf1fl/fl Cx3xr1CreERT2 (cKO) mice to selectively ablate Elf1 expression in CX3CR1+ cells. To rule out a potential effect of Elf1 deletion on brain development, Elf1 was deleted only after tamoxifen administration. Specifically, tamoxifen induced ablation of Elf1 in cells expressing Cx3cr1, including microglia and peripheral myeloid cells. Notably, bone marrow–derived peripheral myeloid cells were continuously replenished by newborn CX3CR1+ cells, leading to almost complete renewal of the initial Elf1-KO macrophage population within 30 days. In contrast, microglia underwent self-renewal and retained lifelong Elf1 ablation (Supplemental Figure 12A).
To verify the efficiency of removing microglial Elf1, on day 35 after tamoxifen administration, we used FACS to isolate microglia (CD45intCD11b+TMEM119+), other brain cells (CD45–CD11b–), and circulation myeloid cells (CD45+CD11b+). As expected, quantitative analysis of Elf1 mRNA in these FACS-isolated microglia showed that Elf1 was virtually eliminated in microglia, whereas Elf1 expression was unaffected in macrophages and other brain cells (Supplemental Figure 12, B and C).
To confirm the protective functions of Elf1-cKO after TBI, we performed bulk RNA-seq and compared the differences between purified microglia 3 days after TBI (Figure 6A). Ablation of Elf1 induced upregulation of antiinflammation-related genes such as Arg1, Tgfb1, Lyz2, and Sall1 in microglia, while inflammation-related genes such as Tnf, Ccl2, Nlrp3, Il1b, and Casp1 were downregulated (Figure 6, B and C). In addition, ablation of Elf1 mediated the downregulation of the inflammatory, MAPK, and NF-κB signaling pathways in aged and young microglia (Figure 6, D and E) and downregulated the proportion of NLRP3+ microglia and upregulated the proportion of Lysozyme+ microglia after TBI (Supplemental Figure 12, D–G).
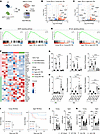 Figure 6
In vivo ablation of ELF1 improves the survival and neurological recovery of mice after TBI. (A) Brain tissues from WT and cKO mice 3 days after TBI were collected, and transcriptome sequencing was performed after FACS enrichment of microglia. (B) Volcano plot of microglia DEGs between Young-TBI mice and Young-cKO-TBI mice. n = 3/group. (C) Volcano plot of microglia DEGs between Young-TBI mice and Young-cKO-TBI mice. n = 3/group. (D) GSEA of DEGs in the MAPK signaling pathway between Young-TBI mice and Young-cKO-TBI mice. n = 3/group. (E) GSEA of DEGs in the NF-κB signaling pathway between Young-TBI and Young-cKO-TBI mice. n = 3/group. (F) Proinflammatory and antiinflammatory expression profiles of different groups of microglia. Each column represents 1 sample. Data are expressed as z scores representing the mean and SD normalized expression levels for each gene (row). (G and H) qPCR detection of pro- and antiinflammatory cytokines in different groups of microglia. n = 6/group. (I) Survival curves of 4 different mice conditions within 45 days of TBI (left, young group; right, aged group; start: nWT+Sham = 12, nWT+Sham = 20, nCre+TBI = 20, and ncKO+TBI = 20). (J and K) mNSS and rotarod test of 4 different mice conditions after 45 days of TBI (young group, nWT+Sham = 12, nWT+Sham =18, nCre+TBI = 17, and ncKO+TBI = 19; aged group, nWT+Sham = 12, nWT+Sham = 13, nCre+TBI = 12, and ncKO+TBI = 17). Data are presented as mean ± SEM. *P < 0.05, **P < 0.01, ***P < 0.001, ****P < 0.0001. Statistical analyses were performed using 2-way ANOVA followed by Tukey’s post hoc test (G, H, J, and K) and Kaplan-Meier survival analysis (I). The schematic was generated using BioRender.
To further characterize the inflammatory signature of Elf1-deficient microglia, we compared our TBI-induced DEG dataset with pro- and antiinflammatory markers from the NCBI Gene Expression Omnibus public database (GSE69607). This analysis revealed that Elf1-ablated microglia exhibited a distinct inflammatory profile after TBI, with reduced proinflammatory gene expression and elevated antiinflammatory gene expression (Figure 6F). RT-qPCR confirmed the proinflammatory markers (Il1b, Il6, and Tnf) were downregulated and antiinflammatory markers (Il4, Il10, and Tgfb1) were upregulated in cKO-TBI compared with WT and Cre controls (Figure 6, G and H). Modulation of the inflammatory response brought about significant improvements in survival and behavioral performance, as evidenced by a significant decrease in mortality in aged TBI mice, a decrease in mNSS, and a prolongation of the latency to fall from the rotarod test (Figure 6, I–K).
Targeting ELF1 with Imeglimin confers neuroprotection in TBI. Currently, there are no commercially available ELF1 inhibitors. Therefore, we performed a structure-based high-throughput virtual screening of 8,561 compounds approved by the FDA or already in clinical use for potential ELF1 inhibitors. After successive standard and high-precision docking analyses, the 200 compounds with the highest docking scores were selected. After comprehensively analyzing the molecular weight, lipid solubility, and affinity to protein components in the blood-brain barrier of the 200 compounds, we screened the 10 compounds most likely to cross the blood-brain barrier for subsequent experiments (Figure 7, A and B).
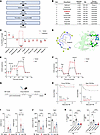 Figure 7
Imeglimin treatment promotes recovery in mice with TBI. (A) High-throughput virtual screening was performed on 8,561 potential ELF1 inhibitor compounds approved by the FDA or already in clinical use. 200 compounds with the highest docking scores were screened after sequential SP and XP docking analysis. Finally, 10 compounds were screened out of all 200 compounds with the highest potential to cross the blood-brain barrier (BBB). (B) Docking scores, molecular weights, and clinical information for the 10 compounds selected. (C) Ratio of NLRP3+ microglia after Imeglimin treatment (HMC3). n = 3/group. (D) Chemical structure of Imeglimin and in silico docking to the active pocket of the human ELF1 protein. (E and F) ECAR and OCR of Imeglimin-treated microglia cell line (HMC3) and vector controls. n = 3/group. (G) Flow chart of Imeglimin in vivo treatment of mice with TBI. (H) Survival curves of Imeglimin-treated mice versus vector control mice after 45 days of TBI (left, young group; right, aged group; start: nSham = 12, nVector+Sham = 20, and nIme+TBI = 20). (I and J) mNSS (I) and rotarod test (J) between Imeglimin-treated and vector control mice after 45 days of TBI (young group, nSham = 12, nVector+TBI = 17, and nIme+TBI = 18; aged group, nSham = 12, nVector+TBI = 13, and nIme+TBI = 19). (K) Concentrations of IL-1β and IL-6 in the cerebrospinal fluid of Imeglimin-treated and vector control mice after 45 days of TBI (nYoung-vector = 17, nAged-vector = 13, nYoung-Ime = 18, and nAged+Ime = 19). Data are presented as mean ± SEM. *P < 0.05, **P < 0.01, ****P < 0.0001. Statistical analyses were performed using unpaired 2-tailed Student’s t test (C), 2-way ANOVA followed by Tukey’s post hoc test (I–K), and Kaplan-Meier survival analysis (H). The schematic was generated using BioRender.
Among all 10 alternative compounds, Imeglimin, a newly marketed antidiabetic agent with a good safety profile (23), showed the strongest inhibitory effect on NLRP3+ microglia formation (Figure 7C and Supplemental Figure 13, A–D). Molecular docking showed that Imeglimin binds to the ATP pocket of the ELF1 protein through 3 hydrogen bonds (formed with Val286, Gln283, and Lys279; Figure 7D). Imeglimin modulated mitochondrial dysfunction of microglia and improved the aerobic respiration of microglia, as indicated by decreased ECAR and increased OCR (Figure 7, E and F). Based on a study of Imeglimin in ischemic brain injury, we determined the in vivo therapeutic concentration of Imeglimin to be 135 μg/kg/day (24). After in vivo treatment at a concentration of 135 μg/kg for 7 days, Imeglimin increased the survival rate of mice with TBI within 45 days (Figure 7, G and H) and decreased the proportion of NLRP3+ microglia in the brain after injury (upregulated the proportion of Lysosome+ microglia) (Supplemental Figure 14, A–D). Imeglimin improved the neurological recovery and decreased the concentrations of proinflammatory cytokines IL-6 and IL-1β in the cerebrospinal fluid of mice after TBI (Figure 7, I–K). Interestingly, Imeglimin treatment reduced lymphocyte burden in the brains of mice with TBI and decreased the transcription of senescence-related markers Cdkn1a and Cdkn2a in microglia (Supplemental Figure 15, A–D).
To better understand how Imeglimin functions by blocking ELF1 rather than off-target effects, we constructed 3 HMC3 cell lines (WT, ELF1-KO, and ELF1-KO with Imeglimin treatment) and performed in vitro TBI modeling (Supplemental Figure 16A). Administration of Imeglimin in ELF1-KO microglia did not continue to reduce the proportion of NLRP3+ microglia and did not improve ECAR and OCR in ELF1-KO microglia (Supplemental Figure 16, B, E, and F). To further analyze this, we constructed 3 HMC3 cell lines (WT, ELF1-overexpressing [ELF1-OE], and ELF1-OE with Imeglimin treatment) (Supplemental Figure 16C). The proportion of NLRP3+ microglia was significantly elevated after ELF1 overexpression, whereas Imeglimin reversed this result and achieved a significant improvement even compared with WT control. Administration of Imeglimin in the ELF1-OE group significantly restored microglial aerobic respiration with improved ECAR and OCR (Supplemental Figure 16, D, G, and H). The results of the in vivo experiments corroborated the findings from the in vitro experiments. That is, after Elf1 KO, Imeglimin could not further reduce the proportion of NLRP3+ microglia in the brain after TBI (Supplemental Figure 16, I and J). The above findings suggest that Imeglimin exerts its pharmacological effects mainly through blocking ELF1 rather than off-target effects.
Regarding the safety of Imeglimin treatment, we found that it did not cause a decrease in blood glucose of sham mice, and the rise in blood glucose after TBI was suppressed by Imeglimin treatment (Supplemental Figure 17A). Except for blood glucose, Imeglimin treatment did not cause blood pressure fluctuations in TBI mice (Supplemental Figure 17, B and C). Histologic sections of each major organ did not indicate obviously toxicological effects (Supplemental Figure 17D).


Copyright © 2026 American Society for Clinical Investigation
ISSN: 0021-9738 (print), 1558-8238 (online)