
Advertisement
Research ArticleHematologyImmunologyOncology
Open Access |  10.1172/JCI194631
IFN-γ–driven skewing towards Th1 over Th17 differentiation underlies CRS and neutropenia in CAR-T therapy
Payal Goala,1,2 Yongliang Zhang,3 Nolan Beatty,1,2 Allan Pavy,4 Shannon McSain,1 Cooper Sailer,1 Muhammad Junaid Tariq,4,5 Showkat Hamid,4,6 Eduardo Cortes Gomez,7 Jianmin Wang,7 Duna Massillon,1 Maxwell Ilecki,4 Justin C. Boucher,8 Constanza Savid-Frontera,8 Sae Bom Lee,2,8 Hiroshi Kotani,9 Meredith L. Stone,4 Michael D. Jain,6 and Marco L. Davila1,4
1Department of Immunology, Roswell Park Comprehensive Cancer Center, Buffalo, New York, USA.
2Cancer Biology PhD Program, University of South Florida, Tampa, Florida, USA.
3Iovance Biotherapeutics, San Carlos, California, USA.
4Department of Medicine, Roswell Park Comprehensive Cancer Center, Buffalo, New York, USA.
5University of Florida College of Medicine, Division of Hematology-Oncology, Gainesville, Florida, USA.
6Department of Blood and Marrow Transplant and Cellular Immunotherapy, H. Lee Moffitt Cancer Center & Research Institute, Tampa, Florida, USA.
7Department of Biostatistics and Bioinformatics, Roswell Park Comprehensive Cancer Center, Buffalo, New York, USA.
8Department of Immunology, H. Lee Moffitt Cancer Center & Research Institute, Tampa, Florida, USA.
9Division of Innovative Cancer Control Research, Cancer Research Institute of Kanazawa University, Kanazawa, Japan.
Address correspondence to: Marco L. Davila, Roswell Park Comprehensive Cancer Center,Elm and Carlton Sts.,Buffalo, NY 14203, USA. Phone: 716.845.1300; Email:Marco.Davila@RoswellPark.org.
Find articles by Goala, P. in: PubMed | Google Scholar
1Department of Immunology, Roswell Park Comprehensive Cancer Center, Buffalo, New York, USA.
2Cancer Biology PhD Program, University of South Florida, Tampa, Florida, USA.
3Iovance Biotherapeutics, San Carlos, California, USA.
4Department of Medicine, Roswell Park Comprehensive Cancer Center, Buffalo, New York, USA.
5University of Florida College of Medicine, Division of Hematology-Oncology, Gainesville, Florida, USA.
6Department of Blood and Marrow Transplant and Cellular Immunotherapy, H. Lee Moffitt Cancer Center & Research Institute, Tampa, Florida, USA.
7Department of Biostatistics and Bioinformatics, Roswell Park Comprehensive Cancer Center, Buffalo, New York, USA.
8Department of Immunology, H. Lee Moffitt Cancer Center & Research Institute, Tampa, Florida, USA.
9Division of Innovative Cancer Control Research, Cancer Research Institute of Kanazawa University, Kanazawa, Japan.
Address correspondence to: Marco L. Davila, Roswell Park Comprehensive Cancer Center,Elm and Carlton Sts.,Buffalo, NY 14203, USA. Phone: 716.845.1300; Email:Marco.Davila@RoswellPark.org.
Find articles by Zhang, Y. in: PubMed | Google Scholar
1Department of Immunology, Roswell Park Comprehensive Cancer Center, Buffalo, New York, USA.
2Cancer Biology PhD Program, University of South Florida, Tampa, Florida, USA.
3Iovance Biotherapeutics, San Carlos, California, USA.
4Department of Medicine, Roswell Park Comprehensive Cancer Center, Buffalo, New York, USA.
5University of Florida College of Medicine, Division of Hematology-Oncology, Gainesville, Florida, USA.
6Department of Blood and Marrow Transplant and Cellular Immunotherapy, H. Lee Moffitt Cancer Center & Research Institute, Tampa, Florida, USA.
7Department of Biostatistics and Bioinformatics, Roswell Park Comprehensive Cancer Center, Buffalo, New York, USA.
8Department of Immunology, H. Lee Moffitt Cancer Center & Research Institute, Tampa, Florida, USA.
9Division of Innovative Cancer Control Research, Cancer Research Institute of Kanazawa University, Kanazawa, Japan.
Address correspondence to: Marco L. Davila, Roswell Park Comprehensive Cancer Center,Elm and Carlton Sts.,Buffalo, NY 14203, USA. Phone: 716.845.1300; Email:Marco.Davila@RoswellPark.org.
Find articles by Beatty, N. in: PubMed | Google Scholar
1Department of Immunology, Roswell Park Comprehensive Cancer Center, Buffalo, New York, USA.
2Cancer Biology PhD Program, University of South Florida, Tampa, Florida, USA.
3Iovance Biotherapeutics, San Carlos, California, USA.
4Department of Medicine, Roswell Park Comprehensive Cancer Center, Buffalo, New York, USA.
5University of Florida College of Medicine, Division of Hematology-Oncology, Gainesville, Florida, USA.
6Department of Blood and Marrow Transplant and Cellular Immunotherapy, H. Lee Moffitt Cancer Center & Research Institute, Tampa, Florida, USA.
7Department of Biostatistics and Bioinformatics, Roswell Park Comprehensive Cancer Center, Buffalo, New York, USA.
8Department of Immunology, H. Lee Moffitt Cancer Center & Research Institute, Tampa, Florida, USA.
9Division of Innovative Cancer Control Research, Cancer Research Institute of Kanazawa University, Kanazawa, Japan.
Address correspondence to: Marco L. Davila, Roswell Park Comprehensive Cancer Center,Elm and Carlton Sts.,Buffalo, NY 14203, USA. Phone: 716.845.1300; Email:Marco.Davila@RoswellPark.org.
Find articles by Pavy, A. in: PubMed | Google Scholar
1Department of Immunology, Roswell Park Comprehensive Cancer Center, Buffalo, New York, USA.
2Cancer Biology PhD Program, University of South Florida, Tampa, Florida, USA.
3Iovance Biotherapeutics, San Carlos, California, USA.
4Department of Medicine, Roswell Park Comprehensive Cancer Center, Buffalo, New York, USA.
5University of Florida College of Medicine, Division of Hematology-Oncology, Gainesville, Florida, USA.
6Department of Blood and Marrow Transplant and Cellular Immunotherapy, H. Lee Moffitt Cancer Center & Research Institute, Tampa, Florida, USA.
7Department of Biostatistics and Bioinformatics, Roswell Park Comprehensive Cancer Center, Buffalo, New York, USA.
8Department of Immunology, H. Lee Moffitt Cancer Center & Research Institute, Tampa, Florida, USA.
9Division of Innovative Cancer Control Research, Cancer Research Institute of Kanazawa University, Kanazawa, Japan.
Address correspondence to: Marco L. Davila, Roswell Park Comprehensive Cancer Center,Elm and Carlton Sts.,Buffalo, NY 14203, USA. Phone: 716.845.1300; Email:Marco.Davila@RoswellPark.org.
Find articles by McSain, S. in: PubMed | Google Scholar
1Department of Immunology, Roswell Park Comprehensive Cancer Center, Buffalo, New York, USA.
2Cancer Biology PhD Program, University of South Florida, Tampa, Florida, USA.
3Iovance Biotherapeutics, San Carlos, California, USA.
4Department of Medicine, Roswell Park Comprehensive Cancer Center, Buffalo, New York, USA.
5University of Florida College of Medicine, Division of Hematology-Oncology, Gainesville, Florida, USA.
6Department of Blood and Marrow Transplant and Cellular Immunotherapy, H. Lee Moffitt Cancer Center & Research Institute, Tampa, Florida, USA.
7Department of Biostatistics and Bioinformatics, Roswell Park Comprehensive Cancer Center, Buffalo, New York, USA.
8Department of Immunology, H. Lee Moffitt Cancer Center & Research Institute, Tampa, Florida, USA.
9Division of Innovative Cancer Control Research, Cancer Research Institute of Kanazawa University, Kanazawa, Japan.
Address correspondence to: Marco L. Davila, Roswell Park Comprehensive Cancer Center,Elm and Carlton Sts.,Buffalo, NY 14203, USA. Phone: 716.845.1300; Email:Marco.Davila@RoswellPark.org.
Find articles by Sailer, C. in: PubMed | Google Scholar
1Department of Immunology, Roswell Park Comprehensive Cancer Center, Buffalo, New York, USA.
2Cancer Biology PhD Program, University of South Florida, Tampa, Florida, USA.
3Iovance Biotherapeutics, San Carlos, California, USA.
4Department of Medicine, Roswell Park Comprehensive Cancer Center, Buffalo, New York, USA.
5University of Florida College of Medicine, Division of Hematology-Oncology, Gainesville, Florida, USA.
6Department of Blood and Marrow Transplant and Cellular Immunotherapy, H. Lee Moffitt Cancer Center & Research Institute, Tampa, Florida, USA.
7Department of Biostatistics and Bioinformatics, Roswell Park Comprehensive Cancer Center, Buffalo, New York, USA.
8Department of Immunology, H. Lee Moffitt Cancer Center & Research Institute, Tampa, Florida, USA.
9Division of Innovative Cancer Control Research, Cancer Research Institute of Kanazawa University, Kanazawa, Japan.
Address correspondence to: Marco L. Davila, Roswell Park Comprehensive Cancer Center,Elm and Carlton Sts.,Buffalo, NY 14203, USA. Phone: 716.845.1300; Email:Marco.Davila@RoswellPark.org.
Find articles by Tariq, M. in: PubMed | Google Scholar
1Department of Immunology, Roswell Park Comprehensive Cancer Center, Buffalo, New York, USA.
2Cancer Biology PhD Program, University of South Florida, Tampa, Florida, USA.
3Iovance Biotherapeutics, San Carlos, California, USA.
4Department of Medicine, Roswell Park Comprehensive Cancer Center, Buffalo, New York, USA.
5University of Florida College of Medicine, Division of Hematology-Oncology, Gainesville, Florida, USA.
6Department of Blood and Marrow Transplant and Cellular Immunotherapy, H. Lee Moffitt Cancer Center & Research Institute, Tampa, Florida, USA.
7Department of Biostatistics and Bioinformatics, Roswell Park Comprehensive Cancer Center, Buffalo, New York, USA.
8Department of Immunology, H. Lee Moffitt Cancer Center & Research Institute, Tampa, Florida, USA.
9Division of Innovative Cancer Control Research, Cancer Research Institute of Kanazawa University, Kanazawa, Japan.
Address correspondence to: Marco L. Davila, Roswell Park Comprehensive Cancer Center,Elm and Carlton Sts.,Buffalo, NY 14203, USA. Phone: 716.845.1300; Email:Marco.Davila@RoswellPark.org.
Find articles by Hamid, S. in: PubMed | Google Scholar
1Department of Immunology, Roswell Park Comprehensive Cancer Center, Buffalo, New York, USA.
2Cancer Biology PhD Program, University of South Florida, Tampa, Florida, USA.
3Iovance Biotherapeutics, San Carlos, California, USA.
4Department of Medicine, Roswell Park Comprehensive Cancer Center, Buffalo, New York, USA.
5University of Florida College of Medicine, Division of Hematology-Oncology, Gainesville, Florida, USA.
6Department of Blood and Marrow Transplant and Cellular Immunotherapy, H. Lee Moffitt Cancer Center & Research Institute, Tampa, Florida, USA.
7Department of Biostatistics and Bioinformatics, Roswell Park Comprehensive Cancer Center, Buffalo, New York, USA.
8Department of Immunology, H. Lee Moffitt Cancer Center & Research Institute, Tampa, Florida, USA.
9Division of Innovative Cancer Control Research, Cancer Research Institute of Kanazawa University, Kanazawa, Japan.
Address correspondence to: Marco L. Davila, Roswell Park Comprehensive Cancer Center,Elm and Carlton Sts.,Buffalo, NY 14203, USA. Phone: 716.845.1300; Email:Marco.Davila@RoswellPark.org.
Find articles by Cortes Gomez, E. in: PubMed | Google Scholar
1Department of Immunology, Roswell Park Comprehensive Cancer Center, Buffalo, New York, USA.
2Cancer Biology PhD Program, University of South Florida, Tampa, Florida, USA.
3Iovance Biotherapeutics, San Carlos, California, USA.
4Department of Medicine, Roswell Park Comprehensive Cancer Center, Buffalo, New York, USA.
5University of Florida College of Medicine, Division of Hematology-Oncology, Gainesville, Florida, USA.
6Department of Blood and Marrow Transplant and Cellular Immunotherapy, H. Lee Moffitt Cancer Center & Research Institute, Tampa, Florida, USA.
7Department of Biostatistics and Bioinformatics, Roswell Park Comprehensive Cancer Center, Buffalo, New York, USA.
8Department of Immunology, H. Lee Moffitt Cancer Center & Research Institute, Tampa, Florida, USA.
9Division of Innovative Cancer Control Research, Cancer Research Institute of Kanazawa University, Kanazawa, Japan.
Address correspondence to: Marco L. Davila, Roswell Park Comprehensive Cancer Center,Elm and Carlton Sts.,Buffalo, NY 14203, USA. Phone: 716.845.1300; Email:Marco.Davila@RoswellPark.org.
Find articles by
Wang, J.
in:
PubMed
|
Google Scholar
|

1Department of Immunology, Roswell Park Comprehensive Cancer Center, Buffalo, New York, USA.
2Cancer Biology PhD Program, University of South Florida, Tampa, Florida, USA.
3Iovance Biotherapeutics, San Carlos, California, USA.
4Department of Medicine, Roswell Park Comprehensive Cancer Center, Buffalo, New York, USA.
5University of Florida College of Medicine, Division of Hematology-Oncology, Gainesville, Florida, USA.
6Department of Blood and Marrow Transplant and Cellular Immunotherapy, H. Lee Moffitt Cancer Center & Research Institute, Tampa, Florida, USA.
7Department of Biostatistics and Bioinformatics, Roswell Park Comprehensive Cancer Center, Buffalo, New York, USA.
8Department of Immunology, H. Lee Moffitt Cancer Center & Research Institute, Tampa, Florida, USA.
9Division of Innovative Cancer Control Research, Cancer Research Institute of Kanazawa University, Kanazawa, Japan.
Address correspondence to: Marco L. Davila, Roswell Park Comprehensive Cancer Center,Elm and Carlton Sts.,Buffalo, NY 14203, USA. Phone: 716.845.1300; Email:Marco.Davila@RoswellPark.org.
Find articles by Massillon, D. in: PubMed | Google Scholar
1Department of Immunology, Roswell Park Comprehensive Cancer Center, Buffalo, New York, USA.
2Cancer Biology PhD Program, University of South Florida, Tampa, Florida, USA.
3Iovance Biotherapeutics, San Carlos, California, USA.
4Department of Medicine, Roswell Park Comprehensive Cancer Center, Buffalo, New York, USA.
5University of Florida College of Medicine, Division of Hematology-Oncology, Gainesville, Florida, USA.
6Department of Blood and Marrow Transplant and Cellular Immunotherapy, H. Lee Moffitt Cancer Center & Research Institute, Tampa, Florida, USA.
7Department of Biostatistics and Bioinformatics, Roswell Park Comprehensive Cancer Center, Buffalo, New York, USA.
8Department of Immunology, H. Lee Moffitt Cancer Center & Research Institute, Tampa, Florida, USA.
9Division of Innovative Cancer Control Research, Cancer Research Institute of Kanazawa University, Kanazawa, Japan.
Address correspondence to: Marco L. Davila, Roswell Park Comprehensive Cancer Center,Elm and Carlton Sts.,Buffalo, NY 14203, USA. Phone: 716.845.1300; Email:Marco.Davila@RoswellPark.org.
Find articles by Ilecki, M. in: PubMed | Google Scholar
1Department of Immunology, Roswell Park Comprehensive Cancer Center, Buffalo, New York, USA.
2Cancer Biology PhD Program, University of South Florida, Tampa, Florida, USA.
3Iovance Biotherapeutics, San Carlos, California, USA.
4Department of Medicine, Roswell Park Comprehensive Cancer Center, Buffalo, New York, USA.
5University of Florida College of Medicine, Division of Hematology-Oncology, Gainesville, Florida, USA.
6Department of Blood and Marrow Transplant and Cellular Immunotherapy, H. Lee Moffitt Cancer Center & Research Institute, Tampa, Florida, USA.
7Department of Biostatistics and Bioinformatics, Roswell Park Comprehensive Cancer Center, Buffalo, New York, USA.
8Department of Immunology, H. Lee Moffitt Cancer Center & Research Institute, Tampa, Florida, USA.
9Division of Innovative Cancer Control Research, Cancer Research Institute of Kanazawa University, Kanazawa, Japan.
Address correspondence to: Marco L. Davila, Roswell Park Comprehensive Cancer Center,Elm and Carlton Sts.,Buffalo, NY 14203, USA. Phone: 716.845.1300; Email:Marco.Davila@RoswellPark.org.
Find articles by Boucher, J. in: PubMed | Google Scholar
1Department of Immunology, Roswell Park Comprehensive Cancer Center, Buffalo, New York, USA.
2Cancer Biology PhD Program, University of South Florida, Tampa, Florida, USA.
3Iovance Biotherapeutics, San Carlos, California, USA.
4Department of Medicine, Roswell Park Comprehensive Cancer Center, Buffalo, New York, USA.
5University of Florida College of Medicine, Division of Hematology-Oncology, Gainesville, Florida, USA.
6Department of Blood and Marrow Transplant and Cellular Immunotherapy, H. Lee Moffitt Cancer Center & Research Institute, Tampa, Florida, USA.
7Department of Biostatistics and Bioinformatics, Roswell Park Comprehensive Cancer Center, Buffalo, New York, USA.
8Department of Immunology, H. Lee Moffitt Cancer Center & Research Institute, Tampa, Florida, USA.
9Division of Innovative Cancer Control Research, Cancer Research Institute of Kanazawa University, Kanazawa, Japan.
Address correspondence to: Marco L. Davila, Roswell Park Comprehensive Cancer Center,Elm and Carlton Sts.,Buffalo, NY 14203, USA. Phone: 716.845.1300; Email:Marco.Davila@RoswellPark.org.
Find articles by Savid-Frontera, C. in: PubMed | Google Scholar
1Department of Immunology, Roswell Park Comprehensive Cancer Center, Buffalo, New York, USA.
2Cancer Biology PhD Program, University of South Florida, Tampa, Florida, USA.
3Iovance Biotherapeutics, San Carlos, California, USA.
4Department of Medicine, Roswell Park Comprehensive Cancer Center, Buffalo, New York, USA.
5University of Florida College of Medicine, Division of Hematology-Oncology, Gainesville, Florida, USA.
6Department of Blood and Marrow Transplant and Cellular Immunotherapy, H. Lee Moffitt Cancer Center & Research Institute, Tampa, Florida, USA.
7Department of Biostatistics and Bioinformatics, Roswell Park Comprehensive Cancer Center, Buffalo, New York, USA.
8Department of Immunology, H. Lee Moffitt Cancer Center & Research Institute, Tampa, Florida, USA.
9Division of Innovative Cancer Control Research, Cancer Research Institute of Kanazawa University, Kanazawa, Japan.
Address correspondence to: Marco L. Davila, Roswell Park Comprehensive Cancer Center,Elm and Carlton Sts.,Buffalo, NY 14203, USA. Phone: 716.845.1300; Email:Marco.Davila@RoswellPark.org.
Find articles by Lee, S. in: PubMed | Google Scholar
1Department of Immunology, Roswell Park Comprehensive Cancer Center, Buffalo, New York, USA.
2Cancer Biology PhD Program, University of South Florida, Tampa, Florida, USA.
3Iovance Biotherapeutics, San Carlos, California, USA.
4Department of Medicine, Roswell Park Comprehensive Cancer Center, Buffalo, New York, USA.
5University of Florida College of Medicine, Division of Hematology-Oncology, Gainesville, Florida, USA.
6Department of Blood and Marrow Transplant and Cellular Immunotherapy, H. Lee Moffitt Cancer Center & Research Institute, Tampa, Florida, USA.
7Department of Biostatistics and Bioinformatics, Roswell Park Comprehensive Cancer Center, Buffalo, New York, USA.
8Department of Immunology, H. Lee Moffitt Cancer Center & Research Institute, Tampa, Florida, USA.
9Division of Innovative Cancer Control Research, Cancer Research Institute of Kanazawa University, Kanazawa, Japan.
Address correspondence to: Marco L. Davila, Roswell Park Comprehensive Cancer Center,Elm and Carlton Sts.,Buffalo, NY 14203, USA. Phone: 716.845.1300; Email:Marco.Davila@RoswellPark.org.
Find articles by Kotani, H. in: PubMed | Google Scholar
1Department of Immunology, Roswell Park Comprehensive Cancer Center, Buffalo, New York, USA.
2Cancer Biology PhD Program, University of South Florida, Tampa, Florida, USA.
3Iovance Biotherapeutics, San Carlos, California, USA.
4Department of Medicine, Roswell Park Comprehensive Cancer Center, Buffalo, New York, USA.
5University of Florida College of Medicine, Division of Hematology-Oncology, Gainesville, Florida, USA.
6Department of Blood and Marrow Transplant and Cellular Immunotherapy, H. Lee Moffitt Cancer Center & Research Institute, Tampa, Florida, USA.
7Department of Biostatistics and Bioinformatics, Roswell Park Comprehensive Cancer Center, Buffalo, New York, USA.
8Department of Immunology, H. Lee Moffitt Cancer Center & Research Institute, Tampa, Florida, USA.
9Division of Innovative Cancer Control Research, Cancer Research Institute of Kanazawa University, Kanazawa, Japan.
Address correspondence to: Marco L. Davila, Roswell Park Comprehensive Cancer Center,Elm and Carlton Sts.,Buffalo, NY 14203, USA. Phone: 716.845.1300; Email:Marco.Davila@RoswellPark.org.
Find articles by Stone, M. in: PubMed | Google Scholar
1Department of Immunology, Roswell Park Comprehensive Cancer Center, Buffalo, New York, USA.
2Cancer Biology PhD Program, University of South Florida, Tampa, Florida, USA.
3Iovance Biotherapeutics, San Carlos, California, USA.
4Department of Medicine, Roswell Park Comprehensive Cancer Center, Buffalo, New York, USA.
5University of Florida College of Medicine, Division of Hematology-Oncology, Gainesville, Florida, USA.
6Department of Blood and Marrow Transplant and Cellular Immunotherapy, H. Lee Moffitt Cancer Center & Research Institute, Tampa, Florida, USA.
7Department of Biostatistics and Bioinformatics, Roswell Park Comprehensive Cancer Center, Buffalo, New York, USA.
8Department of Immunology, H. Lee Moffitt Cancer Center & Research Institute, Tampa, Florida, USA.
9Division of Innovative Cancer Control Research, Cancer Research Institute of Kanazawa University, Kanazawa, Japan.
Address correspondence to: Marco L. Davila, Roswell Park Comprehensive Cancer Center,Elm and Carlton Sts.,Buffalo, NY 14203, USA. Phone: 716.845.1300; Email:Marco.Davila@RoswellPark.org.
Find articles by Jain, M. in: PubMed | Google Scholar
1Department of Immunology, Roswell Park Comprehensive Cancer Center, Buffalo, New York, USA.
2Cancer Biology PhD Program, University of South Florida, Tampa, Florida, USA.
3Iovance Biotherapeutics, San Carlos, California, USA.
4Department of Medicine, Roswell Park Comprehensive Cancer Center, Buffalo, New York, USA.
5University of Florida College of Medicine, Division of Hematology-Oncology, Gainesville, Florida, USA.
6Department of Blood and Marrow Transplant and Cellular Immunotherapy, H. Lee Moffitt Cancer Center & Research Institute, Tampa, Florida, USA.
7Department of Biostatistics and Bioinformatics, Roswell Park Comprehensive Cancer Center, Buffalo, New York, USA.
8Department of Immunology, H. Lee Moffitt Cancer Center & Research Institute, Tampa, Florida, USA.
9Division of Innovative Cancer Control Research, Cancer Research Institute of Kanazawa University, Kanazawa, Japan.
Address correspondence to: Marco L. Davila, Roswell Park Comprehensive Cancer Center,Elm and Carlton Sts.,Buffalo, NY 14203, USA. Phone: 716.845.1300; Email:Marco.Davila@RoswellPark.org.
Find articles by Davila, M. in: PubMed | Google Scholar
Published October 30, 2025 - More info
J Clin Invest. 2026;136(1):e194631. https://doi.org/10.1172/JCI194631.
© 2025 Goala, et al. This work is licensed under the Creative Commons Attribution 4.0 International License. To view a copy of this license, visit http://creativecommons.org/licenses/by/4.0/.
Received: April 25, 2025; Accepted: October 10, 2025

Related article:
Abstract
Chimeric antigen receptor T cell (CAR-T) therapy has transformed the treatment of hematologic malignancies, yet, severe inflammatory toxicities continue to limit its broader use. In this issue of the JCI, Goala et al. uncovered a mechanistic link between IFN-γ–driven inflammation and disrupted neutrophil homeostasis, revealing that cytokine release syndrome (CRS) and immune cell–associated hematologic toxicity (ICAHT) stem from a shared biological pathway. Using IL-2Ra–deficient mice and patient samples, they showed that IFN-γ suppressed IL-17A and granulocyte colony-stimulating factor (G-CSF), disrupting granulopoiesis and neutrophil survival. Strikingly, IFN-γ blockade eased both CRS and neutropenia without diminishing CAR-T efficacy, suggesting a path toward safer, better-tolerated cell therapies.
Authors
Stefanie R. Bailey, Marcela V. Maus

-
Results
IL-2Ra KO mice recapitulate CRS following CAR-T administration. Two important factors affecting the severity of CRS in patients after CAR-T therapy are the extent of CAR-T proliferation and the release of proinflammatory cytokines (3). We hypothesized that knockout of IL-2Ra can model the proinflammatory environment during CRS due to the relationship between Treg depletion and systemic release of proinflammatory cytokines, which was shown by Gogishvili et al. (19). We inoculated IL-2Ra knockout (KO) mice as well as C57BL/6J control mice with the syngeneic malignant B cell line, Em-ALL (20). A week after tumor engraftment, IL-2Ra KO and C57BL/6J mice were administered cyclophosphamide and a day later CD1928z CAR-T cells that were derived using WT Thy 1.1 mice (that express IL-2Ra) (Figure 1A). WT CAR-T expansion was confirmed in IL-2Ra KO mice by the presence of GFP+ CAR-T cells in spleen and lymph node. The extent of WT CAR-T infiltration was significantly higher in IL-2Ra KO mice compared with WT and this correlated with greater B cell (B220+) aplasia (Figure 1, B and C). Enhanced WT CAR-T expansion was also observed in peripheral blood of IL-2Ra KO compared with WT mice, which led to improved efficacy in B cell killing (Figure 1, D and E). IL-2Ra KO mice treated with WT CAR-T displayed poor survival of less than 35 days (P < 0.0001) compared with C57BL/6J mice that survived more than 100 days (Figure 1F). Laboratory analysis demonstrated that these deaths were due to CRS and not progressive cancer. We identified infiltration of leukocytes and histiocytes in the H & E–stained sections of splenic red pulp, lymph node, liver, and lung tissues (Figure 1G). Evaluation of serum cytokines at week 1 after WT CAR-T administration in IL-2Ra KO mice confirmed the significant elevation of proinflammatory cytokines IL-6, TNF-α and IFN-γ (Figure 1, H, J, and L). There were no notable differences in serum cytokines of WT CAR-T treated C57BL/6J WT mice (Figure 1, I, K, and M).
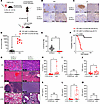 Figure 1
IL-2Ra KO mice recapitulate CRS following CAR-T administration. (A) Schematic representation of IL-2Ra knockout (KO) or C57BL/6J mice inoculated with 1 to 2 Million (M) Em-ALL cells followed by 300 mg/kg cyclophosphamide (CycloP) and 1 to 2 M CD1928z GFP WT CAR-T infusion. Data is pooled from 2 independently performed experiments. (B) Histopathology sections of Spleen (SPL) at 100× (black scale bar: 200 mm) and (C) Lymph node (LN) at 400× (black scale bar: 100 mm) a week after WT CAR-T infiltration in IL-2Ra KO vs control (C57BL/6J) mice. The panel to the left shows B220+ cells (brown) and panel to the right shows WT CAR-T cells (brown). (D) The percentage of CD3+ and (E) the percentage of CD19+ cells in peripheral blood (PBL) were compared between a subset of IL-2Ra KO (n = 6) and C57BL/6J (n = 14) mice at week 1 after WT CAR-T administration. (F) Kaplan-Meier overall survival curves of IL-2Ra KO vs C57BL/6J mice treated with CD1928z WT CAR-T cells. (G) H&E-stained sections of (Top to Bottom) SPL, LN (at 400×; black scale bar: 100 mm), Liver and lung (at 100×; black scale bar: 200 mm) from IL-2Ra KO and C57BL/6J mice at week 1 after WT CAR-T infusion. Arrows shown in LN and lung sections in E represent a mixed leukocyte infiltration including large histiocytic cells. Week 1 serum cytokine analysis of IL-6 (H and I), TNF-α (J and K) and IFN-γ (L and M) in WT CAR-T–treated IL-2Ra KO and C57BL/6J mice, respectively. In I, K, and M, cytokines were measured for 7 C57BL/6J mice, while in (H, J, and L), cytokines were measured for all IL-2Ra KO mice that had samples for both pre and postcytokines, as paired values from each mouse. Error bars represent standard error of mean (SEM). *P < 0.05, **P < 0.01, and ***P < 0.001. P values for cytokine bar plots (D, E, and H–M) were generated using a paired t test. P values for Kaplan-Meier survival curve F was generated using Log-rank (Mantel-Cox) test.
Reversal of CRS phenotype in IL-2Ra KO mice via IL-6R-blockade, IFN-γ blockade, and Treg adoptive transfer. While lymphodepletion followed by WT CAR-T treatment best reflects clinical practice, it also confounds the role of CAR-T on the endogenous immune landscape. Therefore, we treated IL-2Ra KO and C57BL/6J mice with WT CAR-T cells only, i.e., without any tumors or lymphodepleting agent cyclophosphamide (Figure 2A). A significant elevation of CRS associated proinflammatory cytokines IL-6 (P = 0.003), TNF-α (P = 0.041) and IFN-γ (P = 0.027) were observed in IL-2Ra KO mice after 4 weeks of WT CAR-T treatment (Figure 2, B–D). Compared with Figure 1, lack of tumors could influence the levels of tumor-associated inflammatory cytokines such as IFN-γ. To validate CAR-T–associated CRS, IL-2Ra KO mice were treated with either anti–IL-6R monoclonal antibody (mAb) or anti–IFN-γ mAb, which are equivalents for Tocilizumab and Emapalumab, respectively. Tocilizumab is used to manage CRS in a clinical setting, whereas Emapalumab has recently been shown to mitigate CRS also (21). Both anti–IL-6R and anti–IFN-γ mAbs were administered twice every week, followed by weekly collection of peripheral blood for complete blood profiling and serum analysis until endpoint. Compared with WT CAR-T–only treatment, we report baseline restoration of cytokines TNF-α, whereas IL-6 and IFN-γ levels remained high in IL-2Ra KO mice after treatment with anti–IL-6R mAb (Figure 2, E–G). Treatment with anti–IFN-γ mAb (Figure 2, H–J) reduced IL-6 and TNF-α, but we again noted an increase in IFN-γ. We note that anti–IL-6R mAb treatment can be a confounding factor in the measurement of IL-6 (Figure 2E), (22, 23). However, since IL-6 is a key component of CRS assessment, we measured it. Similarly, increase in IFN-γ (Figure 2J) following treatment with anti–IFN-γ mAb can be a consequence of target-mediated drug disposition (TMDD) (24–26). To evaluate this, we measured CXCL9, which is induced by IFN-γ and is an established marker for functional measurement of IFN-γ neutralization (24–26).While WT CAR-T treatment showed a significant increase in CXCL9 (P = 0.007), administration of anti–IFN-γ mAb led to a significant inhibition of CXCL9 (P < 0.0001), thereby confirming the abatement of IFN-γ signaling (Supplemental Figure 1, A–D; supplemental material available online with this article; https://doi.org/10.1172/JCI194631DS1). A 6-week survival analysis of IL-2Ra KO mice (Figure 2A) treated with WT CAR-T showed a significant decrease in survival compared with anti-IL-6R mAb (P = 0.022) and anti–IFN-γ mAb (P = 0.0001) groups (Figure 2K).
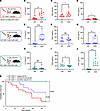 Figure 2
Mitigating CRS in IL-2Ra KO mice. (A) Schematic representation of 51 IL-2Ra KO mice treated with 2M WT CAR-T followed by administration of either Isotype IgG or 12.5 mg/kg (i.p.) of anti-IL-6R mAb or anti-IFN-γ mAb on a twice weekly basis. Data is pooled from 2 independently performed experiments. (B–J) Serum analysis in pre versus week 4 after WT CAR-T treated mice of cytokines IL-6 (B, E, and H), TNF-α (C, F, and I) and IFN-γ (D, G, and J). Pre and postcytokines are paired values taken from each mouse alive at week 4 for each cohort (n = 10 for WT CAR-T + Isotype, n = 12 for CAR-T + anti-IL-6R mAb and n = 10 for WT CAR-T + anti-IFN-γ mAb). (K) The impact of CRS management in IL-2Ra KO mice was determined by measuring Kaplan-Meier overall survival. Error bars represent SEM. *P < 0.05, **P < 0.01, and ***P < 0.001. P values for cytokine bar plots (B–J) were generated using paired t test. P values for Kaplan-Meier survival curve (K) was generated using Log-rank (Mantel-Cox) test.
IL-2Rα KO mice have dysfunctional Tregs and we hypothesized that CRS in IL-2Ra KO mice after CAR-T therapy could in part be due to this deficiency. Clinical studies have similarly shown that reduced Treg frequency accounted for higher rate of CAR-T–associated ICANS (27) and CRS (14, 15). IL-2Ra KO mice were treated with WT CAR-T alone (Group 1), or in combination with adoptively transferred low dose Tregs (0.25 M; Group 2), or high dose Tregs (1 M; Group 3) infused prior to WT CAR-T (Supplemental Figure 2A). Lower Treg dosing was better at improving survival of mice (WT CAR-T+0.25M Tregs versus WT CAR-T alone: P = 0.056) compared with higher Tregs (WT CAR-T+1M Tregs versus WT CAR-T alone: P = 0.265) (Supplemental Figure 2B). Compared with WT CAR-T alone (Supplemental Figure 2, C–E), low and high dose Tregs reduced IL-6, TNF-α and IFN-γ to baseline (Supplemental Figure 2, F–K). We believe poor survival of mice with high dose Tregs can be due to the reported effect of lymphopenia-induced cell death (28).
IL-2Ra KO mice show cooccurrence of CRS and neutropenia following CAR-T infusion. Higher incidence of cytopenias are reported in patients who develop CRS (6, 9). Longitudinal analysis of IL-2Ra KO mice compared with C57BL/6J mice, after WT CAR-T treatment (Figure 3A), showed elevation of IL-6 (P = 0.03), TNF-α (P = 0.008) and IFN-γ (P = 0.001) (Figure 3, B–D), while complete blood profiling showed significant decline in neutrophils (P = 0.007) and red blood cells (Figure 3, E and F). However, a consistent pattern of thrombocytopenia could not be confirmed in IL-2Ra KO mice (Figure 3G). Neither neutropenia, anemia, nor thrombocytopenia were observed in C57BL/6J mice. To determine the extent of CAR-T–associated neutropenia, we compared neutrophil levels of IL-2Ra KO mice treated with WT CAR-T alone, or lymphodepletion alone, or in combination (Supplemental Figure 3A). Both WT CAR-T alone and lymphodepletion alone led to a drop in neutrophils within one week; however, lymphodepletion alone showed a rapid recovery in neutrophils within 5 weeks and WT CAR-T alone had prolonged neutropenia (P = 0.004) (Supplemental Figure 3B). Lymphodepletion followed by WT CAR-T similarly showed poor recovery in neutrophils (P = 0.047).
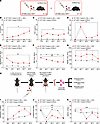 Figure 3
Evaluating cooccurrence of CRS and Neutropenia in IL-2Ra KO mice. (A) Schematic representation of IL-2Ra KO and WT mice treated with 2M WT CAR-T (i.v.) cells. Data are pooled from 2 independently performed experiments. (B–D) Time course analysis of cytokines IL-6 (B), TNF-α (C) and IFN-γ (D) in post WT CAR-T treated IL-2Ra KO and WT mice. IL-2Ra KO pre and postcytokines are paired values taken from each mouse alive until week 4 (n = 10). WT paired cytokine values represent a subset of live mice until week 4 (n = 7). (E–G) Time course of neutrophil concentration (K/mL) (E), red blood cell (RBC) concentration (M/mL) (F) and platelet concentration (K/mL) (G) in the peripheral blood from IL-2Ra KO and C57BL/6J mice using complete blood profiling (CBC). Pre and post levels from CBC are paired values taken from each mouse alive until week 4 per cohort (n = 8 for IL-2Ra KO and n = 8 for C57BL/6J). (H) Schematic of IL-2Ra KO and C57BL/6J mice treated with WT CAR-T cells sacrificed periodically followed by kit-based isolation of neutrophils from bone marrow (BM). Cell turnover of the purified neutrophils was analyzed for apoptosis using Annexin V, and proliferation using BrDU. Neutrophil maturation rate was analyzed using BMMC. Data are pooled from 2 independently performed experiments. I–J. Time point comparison in IL-2Ra KO versus C57BL/6J mice of % Annexin V+ apoptotic cells as a frequency of neutrophils (kit-based purification) (I) and % Ly6G+CXCR2+ cells as a frequency of mature neutrophils (gated on BMMC as Live+Lineage-CD11b+Gr1+ckit-CXCR4- cells) (J). (K) IL-2Ra KO and C57BL/6J mice were injected with 2mg BrDU i.p. 48 hours prior to harvest, followed by staining for BrDU-labelled neutrophils. Line plot represents % BrDU+ cells as a frequency of live neutrophils (kit-based purification) at weeks 1 through 4. Error bars represent SEM. *P < 0.05, **P < 0.01, and ***P < 0.001. P values for line plots (B–G) were generated using paired t test. P values for line plots (I–K) were generated using unpaired t test.
Neutrophils are developed in the bone marrow following granulopoiesis (29, 30). Since neutrophils are short lived, a healthy pool of mature (CD11b+Ly6G+CXCR2+) neutrophils in the bone marrow is essential to maintain circulating neutrophils (31). Additionally, apoptotic neutrophils are homed back to the bone marrow for elimination (32). To determine the effect of WT CAR-T cells on neutrophil homeostasis, IL-2Ra KO and C57BL/6J mice injected with WT CAR-T cells were sacrificed on a weekly basis to harvest bone marrow mononuclear cells (BMMC) (Figure 3H). BMMCs collected from IL-2Ra KO and C57BL/6J mice per time point were used for isolating neutrophils stained with Annexin V (marker for apoptosis) as well as BrDU (marker for proliferation). The percentage of total mature neutrophils present in the bone marrow was also measured. IL-2Ra KO mice showed a significant increase in the rate of apoptosis (P < 0.0001) as indicated by an increase in Annexin V+ 7-AAD+ neutrophils, classified as late-stage apoptotic cells that peaked at week 3 after WT CAR-T (Figure 3I). There was no noticeable difference in apoptosis among neutrophils derived from WT CAR-T–treated C57BL/6J mice. Although a significant decrease in mature neutrophils was observed in both IL-2Ra KO and C57BL/6J mice (Figure 3J), only IL-2Ra KO mice had a significant increase in neutrophil apoptosis and reduced proliferation, confirmed by a decrease (P = 0.002) in BrDU+ neutrophils (Figure 3K).
IFN-γ blockade aids recovery of CRS and neutropenia following CAR-T treatment. Macrophages mediate CRS by releasing proinflammatory cytokines (33, 34). Blockade of IFN-γ inhibits macrophage activation caused during CRS ex-vivo (21, 35). Excess IFN-γ during inflammatory conditions has been shown to favor myelopoiesis over granulopoiesis (36, 37). However, the effect of IFN-γ blockade on neutropenia in the context of CAR-T–associated toxicity has not been characterized. Therefore, IL-2Ra KO mice administered with CAR-T cells were divided into 3 groups: Group 1 included mice treated with WT CAR-T, Group 2 included mice treated with CAR T cells derived from IFN-γ KO mice, and Group 3 mice were treated with WT CAR-T followed by anti–IFN-γ mAb (Figure 4A). Week 4 analysis measured CRS-associated cytokines (IL-6, TNF-α, and IFN-γ) and cytokines that regulate neutrophils (IL-17A and G-CSF). There were no observable differences between the activation (CD69 and Granzyme B) and exhaustion (PD1 and TIM3) status of IFN-γ KO CAR-T cells when compared with WT CAR-T (Supplemental Figure 4, A–E).
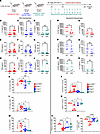 Figure 4
Effect of IFN-γ blockade on CRS and Neutrophils. (A) IL-2Ra KO mice treated with WT CAR-T (Group 1), or with IFN-γ KO CAR-T cells (Group 2) from IFN-γ KO mice or with anti-IFN-γ mAb (Group 3). Data are pooled from 2 independent experiments. (B–J) For CRS characterization, CRS-associated cytokines IL-6, TNF-α, and IFN-γ were analyzed in Group 1 (B, E, and H), Group 2 (C, F, and I), and Group 3 (D, G, and J), respectively. Pre and postcytokine levels are paired values taken from each mouse alive at week 4 per cohort (Group 1 n = 20, Group 2 n = 13, and Group 3 n = 12). (K–M) Flow cytometric analysis of macrophages used mice alive at week 4 from groups 1–3 (Group 1: n = 11; 2: n = 10; 3: n = 6). The frequency of (K) total macrophages (Live+CD45+CD11b+F4/80+), (L) iNOS+M1-like macrophages (Live+CD45+CD11b+F4/80+ CD11c-CD86+MHCII+iNOS+), and (M) Arginase1+M2-like macrophages (Live+CD45+CD11b+F4/80 CD11c-+CD206+Arginase1+) are represented as a percent of CD45+ cells. (N–S) For characterizing neutrophils, cytokines G-CSF (N, P, and R) and IL-17A (O, Q, and S) were evaluated in groups 1–3. Paired cytokine values for IL-17A and G-CSF are from 1 experiment (Group 1, n = 8, Group 2 n = 6, Group 3 n = 5). (T–V) Flow cytometry of neutrophil apoptosis and proliferation used a subset of mice alive at week 4 for Group 1 (n = 10 for apoptosis and n = 6 for proliferation), Group 2 (n = 6 for apoptosis and n = 3 for proliferation) and Group 3 (n = 3 for apoptosis and proliferation). Bar plots represent percentage of (T) neutrophil apoptosis (Annexin V+ cells as a frequency of purified neutrophils) and (U) neutrophil proliferation (BrDU+ cells as a frequency of purified live neutrophils). (V) % Ly6G+CXCR2+ mature neutrophils (gated on Live+Lineage-CD11b+Gr1+ckit-CXCR4- BMMCs) was measured in mice alive at week 4 (Group 1: n = 8; 2: n = 4; 3: n = 6). (W) Bar plots for % GMP cells used mice alive at week 4 gating on Live+ckit+Sca1-FcgR+CD34+ BMMCs in groups 1–3 (Group 1: n = 6; 2: n = 8; 3: n = 3). Error bars represent SEM. *P < 0.05, **P < 0.01, and ***P < 0.001. Statistics for cytokine bar plots (B–J and N–S) used paired t test; for K–M and T–W, used Tukey’s multiple comparison test (using 1-way ANOVA).
WT CAR-T–treated IL-2Ra KO mice (Group 1) reproduced elevation of IL-6 and TNF-α, but these cytokines were reduced in IFN-γ KO CAR-T and anti–IFN-γ mAb groups (Figure 4, B–G). The increase in IFN-γ after CAR-T treatment was observed again after IFN-γ mitigation, likely due to the TMDD effect in Group 3 and secretion of IFN-γ by other immune cells in Group 2 (Figure 4, H–J) (Supplemental Figure 5, A–G). Despite the presence of IFN-γ, lack of increase in CXCL9 (downstream marker of IFN-γ activity) in Groups 2 and 3 suggests functional inhibition of downstream IFN-γ activity (Supplemental Figure 5, H–J). Analysis of BMDMs corroborated the significance of IFN-γ blockade to alleviate CRS. WT CAR-T administration in Group 1 increased the total macrophage population (F4/80+CD11b+) (P = 0.024) (Figure 4K). These BMDMs (from Group 1) were distinctly polarized toward the M1-like phenotype (CD86+MHCII+iNOS+) (P = 0.004), where iNOS expression is associated with CRS (Figure 4L), as compared with the M2-like phenotype (CD206+Arginase1+) (Figure 4M). There was a significant reduction in M1-like macrophages with either mode of IFN-γ blockade (Figure 4L).
The elevation of cytokines in Group 1 coincided with a significant decline in cytokines associated with neutrophil survival, G-CSF (P = 0.019) (Figure 4N), and IL-17A (P = 0.030) (Figure 4O). IL-17A stimulates fibroblasts that release G-CSF to activate the transcription factors such as Gfi1 and CEBPa, crucial for granulopoiesis (38–43). IFN-γ inhibition supported a recovery of G-CSF and IL-17A levels to baseline in Group 2 (Figure 4, P and Q) and Group 3 (Figure 4, R and S). Endpoint analysis revealed a significant reduction in the percentage of bone marrow–derived apoptotic neutrophils (Figure 4T) with IFN-γ blockade in Group 2 and Group 3. This corresponded with a significant increase in neutrophil proliferation (Figure 4U) in Group 2 (P = 0.048) and Group 3 (P = 0.012). The inhibition of mature neutrophils (Figure 4V) in Group 1 (P < 0.0001) showed a significant recovery with IFN-γ mitigation (Group 2, P = 0.04, Group 3, P = 0.034). The increase in neutrophil apoptosis and poor neutrophil recovery in WT CAR-T–treated IL-2Ra KO mice prompted an investigation into the impact of cytokines on granulocyte-monocyte progenitors (GMP) or granulocyte progenitors (GP). GMP and GP cells were FACS sorted using lineage-depleted bone marrow cells of IL-2Ra KO mice 4 weeks after treatment with WT CAR-T cells or IFN-γ KO CAR-T cells. The sorted GMP/GP cells were cultured ex-vivo and their colony formation potential was measured (Supplemental Figure 6A). WT CAR-T–treated IL-2Ra KO mice had significantly dampened GMP/GP colony formation not observed in C57BL/6J mice or IL-2Ra KO mice treated with IFN-γ KO CAR-T cells (Supplemental Figure 6, B–D). Flow cytometric analysis of GMPs shown as percentage CD34+FcgR+ cells in bone marrow confirmed a significant drop in GMP population from WT CAR-T–treated IL-2Ra KO mice (Figure 4W, P < 0.0001), while deletion of IFN-γ in CAR T cells or IFN-γ blockade restored neutrophil progenitors to pre-CAR-T levels shown in Group 2 (P < 0.0001) and Group 3 (P = 0.0484).
IFN-γ Modulation of the Th1/Th17 Axis Drives CRS and Neutropenia. To delineate the influence of IFN-γ on Th1/Th17 balance and neutrophil homeostasis (Figure 5A), naive CD4+ CD62Lhi CD44low cells were isolated from C57BL/6J (B6) mice and confirmed to have no expression of the Th1 cytokine IFN-γ or the Th17 cytokine IL-17A (Supplemental Figure 7, A and B). Isolated naive CD4+ T cells were cultured with Th1- or Th17-inducing cytokines followed by coculture with WT CD1928z CAR-T cells or IFN-γ KO CD1928z CAR-T cells (Supplemental Figure 7C). Differentiation of Th0 to Th17 was 38.1% when cultured without CAR T cells (Supplemental Figure 7D). When these cells were cocultured with WT CD1928z CAR-T cells, differentiation to Th17 dropped to 1.9%. Coculture with IFN-γ KO CAR-T cells supported 17.3% Th0 cells to differentiate into Th17 (Supplemental Figure 7D). Without CAR T cells, 85% Th0 cells differentiated into Th1, which dropped to 59.75% in the presence of WT CD1928z CAR-T cells and 8.29% in presence of IFN-γ KO CAR-T cells.
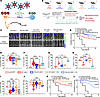 Figure 5
The impact of IFN-γ blockade on the Th1/Th17 axis after CAR-T administration. (A) Representation of proposed mechanism for the role of IFN-γ in regulating Th1/Th17 axis during CRS and neutropenia. (B) IL-2Ra KO mice bearing luciferase-expressing Em-ALL tumors administered with WT CAR-T (Group1), IFN-γ KO CAR-T (Group 2), WT CAR-T treated with anti-IFN-γ mAb (Group 3), WT CAR-T + Th17 cells (Group 4), and IFN-γ KO CAR-T with Th1 cells (Group 5). A control group included mice injected with tumor only. Mice were imaged pretreatment and at week 4 (endpoint) followed by analysis of CBC, neutropenia, and CRS. Data in groups 1, 2, 4, and 5 are pooled from 3 independent experiments. Group 3 and tumor only are from 1 of the pooled experiments, so no statistics for these groups are included. (C) IVIS images showing tumor burden pretreatment and at endpoint. (D) Difference in Kaplan-Meier OS of mice between groups 1, 2,and 3. % Total macrophages (Live+CD45+CD11b+F4/80+) (E) and % iNOS+M1-like macrophages (Live+CD45+CD11b+F4/80+CD11c-CD86+MHCII+iNOS+) (F) were compared. (G) % Annexin V+ apoptotic cells as a frequency of neutrophils (kit-based purification), (H) % BrDU+ cells as a frequency of live neutrophils (kit-based purification), and (I) % Ly6G+CXCR2+ mature neutrophils (gated on Live+Lineage-CD11b+Gr1+ckit-CXCR4- BMMCs) for assessing neutrophil recovery. (J) % GMP cells were determined by gating on Live+ckit+Sca1-FcgR+CD34+ BMMCs. (K–L) Difference in Kaplan-Meier OS between groups 1 and 4 (K) and groups 2 and 5 (L). Mice used in groups 1, 2, and tumor only are the same in D, K, and L. Mice alive at endpoint were used to determine macrophages (Group 1: n = 29; 2: n = 28; 4: n = 26; 5: n = 10), mature neutrophils (Group 1: n = 31; 2: n = 34; 4: n = 26; 5: n = 14), and GMPs (Group 1: n = 28; 2: n = 29; 4: n = 26; 5: n = 13) in E, F, I, and J. Annexin V and BrDU staining was done using mice from groups 1 (n = 3 for Annexin V and BrDU), 2 (n = 4 for Annexin V and n = 3 for BrDU), 4 (n = 3 for Annexin V and n = 4 for BrDU), and 5 (n = 2 for Annexin V and BrDU) in G and H. Error bars represent SEM. *P < 0.05, **P < 0.01, and ***P < 0.001. P values for Kaplan-Meier survival curves D, K, and L were generated using Log-rank (Mantel-Cox) test. Statistics for box plots (E–J) generated using Tukey’s multiple comparison test (1-way ANOVA).
To further interrogate the role of the Th1/Th17 axis on CAR T function, IL-2Ra KO mice were inoculated with syngeneic Em-ALL that expressed luciferase (Figure 5B). A week later, mice with established tumors were divided into 5 groups. In addition to Group 1 (WT CAR-T), Group 2 (IFN-γ KO CAR-T), and Group 3 (WT CAR-T +anti- IFN-γ mAb), Group 4 included WT CAR-T and Th17 cells that were adoptively transferred at a 1:1 ratio. Group 5 mice were administered IFN-γ KO CAR-T followed by an equal number of Th1 cells. CAR-T expansion was unaltered in presence of Th17 or Th1 (Supplemental Figure 8, A and B). As reported by Bailey et al. (21), we confirm that IFN-γ blockade does not alter the antitumor efficacy of CD1928z CAR-T cells (Figure 5C). Moreover, IFN-γ blockade improved the survival of mice after CAR-T infusion (P = 0.0003 for Group 1 versus Group 2) (Figure 5D). We also noted total and M1-like macrophages are significantly reduced by IFN-γ blockade (Figure 5, E and F). There were no significant changes in the frequency of M2-like macrophages in Groups 1, 2, and 3 (Supplemental Figure 8C). However, WT CAR-T cells induced iNOS in M2-like macrophages that was reduced with IFN-γ blockade (Group 2) (Supplemental Figure 8D). These observations reproduce our recent report showing that CAR-T induced their own suppression by upregulating iNOS in M2-like macrophages, which could be reversed when blocking IFN-γ (44). We also noted increases in apoptotic neutrophils and decreases in neutrophil proliferation, maturation and GMP frequency, which could all be reversed by IFN-γ attenuation (Figure 5, G–J).
We hypothesized that Th0 to Th1 differentiation caused by IFN-γ released during CAR-T treatment results in an inadequate reserve of Th0 cells for Th17 differentiation. This is confirmed by addition of Th17 cells to WT CAR-T treated mice (Group 4), which displayed reduced neutrophil apoptosis, enhanced neutrophil proliferation, and maturation (Figure 5, G–I). Th17 adoptive transfer also led to increase in GMPs (Group 1 vs Group 4: P = 0.0002) (Figure 5J). This improvement of BM neutrophil homeostasis due to Th17 adoptive transfer increased neutrophil concentration in peripheral blood compared with WT CAR-T alone (Supplemental Figure 8, E and G). Moreover, Th17 cells reduced total and M1-like macrophages (Figure 5, E and F) and significantly improved the survival of WT CAR-T–treated mice (Figure 5K). We hypothesized that IFN-γ released by CAR-T cells increases Th1 differentiation and M1-like macrophages, which was validated through Group 5, showing adoptive transfer of Th1 cells reversed the benefit of IFN-γ blockade on toxicities by triggering polarization of M1-like macrophages (Group 2 versus Group 5: P = 0.049) (Figure 5F). Th1 adoptive transfer also led to an increase in apoptotic neutrophils and a decrease in proliferative and mature neutrophils compared with the IFN-γ KO CAR-T group (Figure 5, G–I). IFN-γ KO CAR-T treatment showed no difference in peripheral blood neutrophils (Supplemental Figure 8F), whereas adoptive transfer of Th1 resulted in a significant drop in neutrophil concentration (Supplemental Figure 8H). Reestablishment of CRS and neutropenia in IFN-γ KO CAR-T–treated mice infused with Th1 cells resulted in poor survival (P < 0.0001) (Figure 5L). Since addition of Th1 preserved the expansion and efficacy of IFN-γ–KO CAR-T (Figure 5C and Supplemental Figure 8B), the cause of death contributing to poor survival in Group 5 is most likely due to rapid onset of CRS and not the tumor.
Single-cell characterization of bone marrow neutrophils and macrophages in IL-2Ra KO mice during CRS and neutropenia. We performed single-cell sequencing to compare differences in neutrophils and macrophages from BMMCs isolated at week 4 from Group 1 (WT CAR-T, n = 2), Group 2 (IFN-g KO CAR-T, n = 2), Group 4 (WT CAR-T+Th17, n = 2), and Group 5 (IFN-g KO CAR-T +Th1, n = 2). We used uniform manifold approximation and projection (UMAP) (45) to represent every cell in a 2-dimensional embedding, which facilitates cell type identification based on shared gene expression markers in clusters of cells (informed by data from the Immunological Genome Project, ImmGen (46)). UMAP plots for each sample showcase different cell types, their respective numbers, and their molecular heterogeneity, with nearly 70% of BMMCs in IL-2Ra KO mice being either neutrophils or macrophages/monocytes (Figure 6A and Supplemental Figure 9A). Frequency of neutrophils are improved from Group 1 (16.9%, Standard deviation ‘SD’=3.8%) to Group 2 (64%, SD=5.3%) (P = 0.009) owing to IFN-γ attenuation (Figure 6B). Similarly, Th17 administration in Group 4 increased neutrophils (63.2%, SD=5.7%) (P = 0.011) (Supplemental Figure 9B). Conversely, Th1 administration in Group 5 slightly reduced neutrophils (50.6%, SD=12.3%) (P = 0.293) (Supplemental Figure 9B) compared with Group 2 (IFN-γ KO CAR-T). We also note macrophages in Group 1 (41.45%, SD=1.8%) were reduced by IFN-γ mitigation in Groups 2 (15%, SD=1.2%) (P = 0.003) and 4 (17.9%, SD=2.9%) (P = 0.008) (Supplemental Figure 9B). Th1 administration in Group 5 (19.2%, SD=10.1%) yielded a small increase (P = 0.62) compared with IFN-γ KO CAR-T (Supplemental Figure 9B). In spite of small sample size of single-cell sequencing, we see statistical significance in cell type frequencies for all comparisons except Group 5 versus Group 2. However, standard deviations within each group indicate low variability between the samples in a given group.
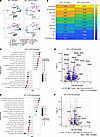 Figure 6
Utilizing single cell–sequencing to identify phenotypic differences in bone marrow neutrophils and macrophages from WT CAR-T and IFN-γ KO CAR-T–treated mice. (A) UMAPs representing cell types present in bone marrow samples of WT CAR-T treated (Group 1 or GP 1) and IFN-γ KO CAR-T treated (Group 2 or GP 2) samples. Each plot represents an individual mouse with 2 mice per group. (B) Heat map displaying the frequency of immune and nonimmune cells in GP 1 and GP 2. Computed values are an average of 2 mice per Group. (C) Gene set enrichment analysis (GSEA) showing the various Pathways from Hallmark dataset that were enriched in the comparison of Neutrophils between GP 1 and GP 2. (D) Volcano plots highlighting the most differentially expressed genes in the Neutrophils from GP 1 and GP 2. (E) GSEA showing various Pathways from Hallmark dataset that were enriched in the comparison of Macrophages between GP 1 and 2. (F) Volcano plots highlighting the most differentially expressed genes in the Macrophages from GP 1 and 2.
Gene set enrichment analysis (GSEA) (45) of cancer hallmarks pathways in neutrophils showed upregulation of IFN-γ response genes in Group 1 compared with Group 2 (Figure 6C), which is confirmed by higher expression of IFN-γ–inducible guanylate binding proteins (Gbp2, Gbp4, Gbp6, and Gbp7) (47) (Figure 6D). This correlated with a downregulation of transcription factors involved in neutrophil activation and emergency granulopoiesis (Nfkb1, Gsk3b, and Cebpb) (48–50). Furthermore, overexpression of Prtn3, previously observed in apoptotic neutrophils (51), in addition to degradation of c-Fos (52) are indicative of increased apoptosis being triggered in Group 1 neutrophils. An upregulation of cell cycle gene sets involving E2F is attributed to overexpression of E2f1 and MYC due to overexpression of Casp8 and Bax (Figure 6, C and D) that drive MYC-induced apoptosis (53–55). Upregulation of E2f1 is associated with overexpression of Casp7 and underexpression of Mcl1 in neutrophils of Group 1 compared with Group 2, which support E2f1’s role in apoptosis (56–59). However, Group 2 neutrophils are enriched for heme metabolism, hypoxia, and TNF-α signaling via NFKB (Figure 6C), which promote neutrophil survival (60–62). We also note that Group 1 macrophages are enriched for IFN-γ and IFN-α response pathways compared with Group 2 (Figure 6E), which is attributed to upregulation of Ccl5, Stat1, and Fgl2 genes involved in M1-like macrophage polarization via the Cxcl9/Cxl10 axis (Figure 6F) (63–65) (44). We observed over expression of IFN regulatory factors, IRF1 (induced by IFN-γ) and IRF7 (induced by IFN-α), which, in turn, aid in the production of iNOS (66–68). Collectively, these analyses offer insight into putative molecular mechanisms involved in excess M1-like macrophage polarization and subsequent activation of neutrophil apoptosis during CRS and neutropenia cooccurrence. These molecular signatures are also seen in Group 1 (WT CAR-T) versus Group 4 (Th17 adoptive transfer) and Group 2 (IFN-γ KO CAR-T) versus Group 5 (Th1 adoptive transfer) comparisons (Supplemental Figure 10, A–H).
Association of Th1/Th17 cytokine levels in human serum with cooccurrence of CRS and neutropenia in CAR-T–treated patients. We investigated if Th1/Th17 balance is associated with CAR T cell toxicities in 43 patients treated at the Roswell Park Comprehensive Cancer Center (Supplemental Table 1). These patients were graded for CRS based on ASTCT guidelines (69). We utilized a neutropenia classification by Rejeski et al (70) (Supplemental Table 2) that categorizes neutropenia based on rate of recovery (Quick, Intermittent, and Aplastic) and another based on severity (Protracted, Profound, Prolonged) per ASCO/IDSA consensus guidelines (71). To determine the role of Th1/Th17 imbalance in driving cooccurrence of CRS and neutropenia in 43 CAR-T–treated patients with hematological malignancies, we split the patients into 3 groups: no cooccurrence of CRS neutropenia, low-grade CRS neutropenia, and high-grade CRSneutropenia. Low-grade CRS neutropenia was defined by cooccurrence of neutropenia and grade 1 CRS. High-grade CRS neutropenia was defined by grade 2 or higher-grade CRS along with prolonged or aplastic neutropenia (severe/high-grade neutropenia). We considered grade 2 CRS as high grade since it requires advanced clinical intervention (13). Eight patients experienced high-grade CRS neutropenia, 7 patients experienced low-grade CRSneutropenia, and the remaining 28 patients experienced no cooccurrence of CRS neutropenia. We measured the ratio of IFN-γ (induced by Th1 cells) to IL-17A (induced by Th17 cells) cytokine levels at prelymphodepletion and peak-postinfusion. A significant increase in IFN-γ–to–IL-17A ratio was noted between high-grade CRS neutropenia and no cooccurrence (P < 0.0001) as well as low-grade CRS neutropenia (P < 0.0001) groups at peak-postinfusion (Figure 7A). The smaller ratio of IFN-γ to IL-17A in low-grade CRS neutropenia compared with high-grade CRS neutropenia may be attributed to the success of CRS intervention strategies. In conclusion, this data is consistent with our in vivo studies, where we observed cooccurrence of CRS neutropenia associated with Th1/Th17 balance.
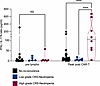 Figure 7
Determining the association of Th1/Th17 balance with CRS Neutropenia cooccurrence in patients. Ratios of IFN-γ to IL-17A (IFN-γ/IL-17A) were calculated for 43 patients with hematological malignancies. Individual levels of IFN-γ as well as IL-17A at prelymphodepletion (prelympho: 6 days before CAR-T infusion) and peak post-CAR-T infusion (defined as the highest cytokine value from postinfusion serum collected on days 1, 7, and 11) were used to generate the ratio of IFN-γ to IL-17A. Violin plots represent 3 different groups where the plots in black represent patients that did not develop cooccurrence of CRS and neutropenia (n = 28), blue violin plots represent patients with a mild case of CRS and neutropenia cooccurrence (n = 7), and red violin plots represent patients with a severe case of CRS and neutropenia cooccurrence (n = 8). *P < 0.05, **P < 0.01, ***P < 0.001 were derived from unpaired t tests.


Copyright © 2026 American Society for Clinical Investigation
ISSN: 0021-9738 (print), 1558-8238 (online)