
Advertisement
Research ArticleCardiologyMetabolism
Open Access |  10.1172/JCI182216
Branched-chain amino acid transaminase 1–mediated pathway promotes proline-dependent collagen production in cardiac myofibroblasts
Noburo Takizawa,1 Takanori Hironaka,1 Hayato Watanabe,1,2 Haruna Suetsugu,1 Keisuke Yoshioka,1 Yuma Horii,1 Yuri Nagata,3 Hiroaki Matoba,4 Hidetaka Kosako,5 Kenji Hamase,3 Go Hirai,4 and Michio Nakaya1,2
1Department of Disease Control, Graduate School of Pharmaceutical Sciences, Kyushu University, Fukuoka, Japan.
2Department of Disease Control, Research Institute of Environmental Medicine, Nagoya University, Nagoya, Japan.
3Department of Drug Discovery and Evolution, Graduate School of Pharmaceutical Sciences, and
4Department of Pharmaceutical Synthetic Chemistry, Graduate School of Pharmaceutical Sciences, Kyushu University, Fukuoka, Japan.
5Division of Cell Signaling, Fujii Memorial Institute of Medical Sciences, Institute of Advanced Medical Sciences, Tokushima University, Tokushima, Japan.
Address correspondence to: Michio Nakaya, Department of Disease Control, Research Institute of Environmental Medicine, Nagoya University, Tokai National Higher Education and Research System, Furo-cho, Chikusa-ku, Nagoya, 464-8601, Japan. Phone: 81.52.789.5001; Email: nakaya@riem.nagoya-u.ac.jp.
Find articles by Takizawa, N. in: PubMed | Google Scholar
1Department of Disease Control, Graduate School of Pharmaceutical Sciences, Kyushu University, Fukuoka, Japan.
2Department of Disease Control, Research Institute of Environmental Medicine, Nagoya University, Nagoya, Japan.
3Department of Drug Discovery and Evolution, Graduate School of Pharmaceutical Sciences, and
4Department of Pharmaceutical Synthetic Chemistry, Graduate School of Pharmaceutical Sciences, Kyushu University, Fukuoka, Japan.
5Division of Cell Signaling, Fujii Memorial Institute of Medical Sciences, Institute of Advanced Medical Sciences, Tokushima University, Tokushima, Japan.
Address correspondence to: Michio Nakaya, Department of Disease Control, Research Institute of Environmental Medicine, Nagoya University, Tokai National Higher Education and Research System, Furo-cho, Chikusa-ku, Nagoya, 464-8601, Japan. Phone: 81.52.789.5001; Email: nakaya@riem.nagoya-u.ac.jp.
Find articles by Hironaka, T. in: PubMed | Google Scholar
1Department of Disease Control, Graduate School of Pharmaceutical Sciences, Kyushu University, Fukuoka, Japan.
2Department of Disease Control, Research Institute of Environmental Medicine, Nagoya University, Nagoya, Japan.
3Department of Drug Discovery and Evolution, Graduate School of Pharmaceutical Sciences, and
4Department of Pharmaceutical Synthetic Chemistry, Graduate School of Pharmaceutical Sciences, Kyushu University, Fukuoka, Japan.
5Division of Cell Signaling, Fujii Memorial Institute of Medical Sciences, Institute of Advanced Medical Sciences, Tokushima University, Tokushima, Japan.
Address correspondence to: Michio Nakaya, Department of Disease Control, Research Institute of Environmental Medicine, Nagoya University, Tokai National Higher Education and Research System, Furo-cho, Chikusa-ku, Nagoya, 464-8601, Japan. Phone: 81.52.789.5001; Email: nakaya@riem.nagoya-u.ac.jp.
Find articles by Watanabe, H. in: PubMed | Google Scholar
1Department of Disease Control, Graduate School of Pharmaceutical Sciences, Kyushu University, Fukuoka, Japan.
2Department of Disease Control, Research Institute of Environmental Medicine, Nagoya University, Nagoya, Japan.
3Department of Drug Discovery and Evolution, Graduate School of Pharmaceutical Sciences, and
4Department of Pharmaceutical Synthetic Chemistry, Graduate School of Pharmaceutical Sciences, Kyushu University, Fukuoka, Japan.
5Division of Cell Signaling, Fujii Memorial Institute of Medical Sciences, Institute of Advanced Medical Sciences, Tokushima University, Tokushima, Japan.
Address correspondence to: Michio Nakaya, Department of Disease Control, Research Institute of Environmental Medicine, Nagoya University, Tokai National Higher Education and Research System, Furo-cho, Chikusa-ku, Nagoya, 464-8601, Japan. Phone: 81.52.789.5001; Email: nakaya@riem.nagoya-u.ac.jp.
Find articles by Suetsugu, H. in: PubMed | Google Scholar
1Department of Disease Control, Graduate School of Pharmaceutical Sciences, Kyushu University, Fukuoka, Japan.
2Department of Disease Control, Research Institute of Environmental Medicine, Nagoya University, Nagoya, Japan.
3Department of Drug Discovery and Evolution, Graduate School of Pharmaceutical Sciences, and
4Department of Pharmaceutical Synthetic Chemistry, Graduate School of Pharmaceutical Sciences, Kyushu University, Fukuoka, Japan.
5Division of Cell Signaling, Fujii Memorial Institute of Medical Sciences, Institute of Advanced Medical Sciences, Tokushima University, Tokushima, Japan.
Address correspondence to: Michio Nakaya, Department of Disease Control, Research Institute of Environmental Medicine, Nagoya University, Tokai National Higher Education and Research System, Furo-cho, Chikusa-ku, Nagoya, 464-8601, Japan. Phone: 81.52.789.5001; Email: nakaya@riem.nagoya-u.ac.jp.
Find articles by Yoshioka, K. in: PubMed | Google Scholar
1Department of Disease Control, Graduate School of Pharmaceutical Sciences, Kyushu University, Fukuoka, Japan.
2Department of Disease Control, Research Institute of Environmental Medicine, Nagoya University, Nagoya, Japan.
3Department of Drug Discovery and Evolution, Graduate School of Pharmaceutical Sciences, and
4Department of Pharmaceutical Synthetic Chemistry, Graduate School of Pharmaceutical Sciences, Kyushu University, Fukuoka, Japan.
5Division of Cell Signaling, Fujii Memorial Institute of Medical Sciences, Institute of Advanced Medical Sciences, Tokushima University, Tokushima, Japan.
Address correspondence to: Michio Nakaya, Department of Disease Control, Research Institute of Environmental Medicine, Nagoya University, Tokai National Higher Education and Research System, Furo-cho, Chikusa-ku, Nagoya, 464-8601, Japan. Phone: 81.52.789.5001; Email: nakaya@riem.nagoya-u.ac.jp.
Find articles by Horii, Y. in: PubMed | Google Scholar
1Department of Disease Control, Graduate School of Pharmaceutical Sciences, Kyushu University, Fukuoka, Japan.
2Department of Disease Control, Research Institute of Environmental Medicine, Nagoya University, Nagoya, Japan.
3Department of Drug Discovery and Evolution, Graduate School of Pharmaceutical Sciences, and
4Department of Pharmaceutical Synthetic Chemistry, Graduate School of Pharmaceutical Sciences, Kyushu University, Fukuoka, Japan.
5Division of Cell Signaling, Fujii Memorial Institute of Medical Sciences, Institute of Advanced Medical Sciences, Tokushima University, Tokushima, Japan.
Address correspondence to: Michio Nakaya, Department of Disease Control, Research Institute of Environmental Medicine, Nagoya University, Tokai National Higher Education and Research System, Furo-cho, Chikusa-ku, Nagoya, 464-8601, Japan. Phone: 81.52.789.5001; Email: nakaya@riem.nagoya-u.ac.jp.
Find articles by Nagata, Y. in: PubMed | Google Scholar
1Department of Disease Control, Graduate School of Pharmaceutical Sciences, Kyushu University, Fukuoka, Japan.
2Department of Disease Control, Research Institute of Environmental Medicine, Nagoya University, Nagoya, Japan.
3Department of Drug Discovery and Evolution, Graduate School of Pharmaceutical Sciences, and
4Department of Pharmaceutical Synthetic Chemistry, Graduate School of Pharmaceutical Sciences, Kyushu University, Fukuoka, Japan.
5Division of Cell Signaling, Fujii Memorial Institute of Medical Sciences, Institute of Advanced Medical Sciences, Tokushima University, Tokushima, Japan.
Address correspondence to: Michio Nakaya, Department of Disease Control, Research Institute of Environmental Medicine, Nagoya University, Tokai National Higher Education and Research System, Furo-cho, Chikusa-ku, Nagoya, 464-8601, Japan. Phone: 81.52.789.5001; Email: nakaya@riem.nagoya-u.ac.jp.
Find articles by Matoba, H. in: PubMed | Google Scholar
1Department of Disease Control, Graduate School of Pharmaceutical Sciences, Kyushu University, Fukuoka, Japan.
2Department of Disease Control, Research Institute of Environmental Medicine, Nagoya University, Nagoya, Japan.
3Department of Drug Discovery and Evolution, Graduate School of Pharmaceutical Sciences, and
4Department of Pharmaceutical Synthetic Chemistry, Graduate School of Pharmaceutical Sciences, Kyushu University, Fukuoka, Japan.
5Division of Cell Signaling, Fujii Memorial Institute of Medical Sciences, Institute of Advanced Medical Sciences, Tokushima University, Tokushima, Japan.
Address correspondence to: Michio Nakaya, Department of Disease Control, Research Institute of Environmental Medicine, Nagoya University, Tokai National Higher Education and Research System, Furo-cho, Chikusa-ku, Nagoya, 464-8601, Japan. Phone: 81.52.789.5001; Email: nakaya@riem.nagoya-u.ac.jp.
Find articles by Kosako, H. in: PubMed | Google Scholar
1Department of Disease Control, Graduate School of Pharmaceutical Sciences, Kyushu University, Fukuoka, Japan.
2Department of Disease Control, Research Institute of Environmental Medicine, Nagoya University, Nagoya, Japan.
3Department of Drug Discovery and Evolution, Graduate School of Pharmaceutical Sciences, and
4Department of Pharmaceutical Synthetic Chemistry, Graduate School of Pharmaceutical Sciences, Kyushu University, Fukuoka, Japan.
5Division of Cell Signaling, Fujii Memorial Institute of Medical Sciences, Institute of Advanced Medical Sciences, Tokushima University, Tokushima, Japan.
Address correspondence to: Michio Nakaya, Department of Disease Control, Research Institute of Environmental Medicine, Nagoya University, Tokai National Higher Education and Research System, Furo-cho, Chikusa-ku, Nagoya, 464-8601, Japan. Phone: 81.52.789.5001; Email: nakaya@riem.nagoya-u.ac.jp.
Find articles by Hamase, K. in: PubMed | Google Scholar
1Department of Disease Control, Graduate School of Pharmaceutical Sciences, Kyushu University, Fukuoka, Japan.
2Department of Disease Control, Research Institute of Environmental Medicine, Nagoya University, Nagoya, Japan.
3Department of Drug Discovery and Evolution, Graduate School of Pharmaceutical Sciences, and
4Department of Pharmaceutical Synthetic Chemistry, Graduate School of Pharmaceutical Sciences, Kyushu University, Fukuoka, Japan.
5Division of Cell Signaling, Fujii Memorial Institute of Medical Sciences, Institute of Advanced Medical Sciences, Tokushima University, Tokushima, Japan.
Address correspondence to: Michio Nakaya, Department of Disease Control, Research Institute of Environmental Medicine, Nagoya University, Tokai National Higher Education and Research System, Furo-cho, Chikusa-ku, Nagoya, 464-8601, Japan. Phone: 81.52.789.5001; Email: nakaya@riem.nagoya-u.ac.jp.
Find articles by Hirai, G. in: PubMed | Google Scholar
1Department of Disease Control, Graduate School of Pharmaceutical Sciences, Kyushu University, Fukuoka, Japan.
2Department of Disease Control, Research Institute of Environmental Medicine, Nagoya University, Nagoya, Japan.
3Department of Drug Discovery and Evolution, Graduate School of Pharmaceutical Sciences, and
4Department of Pharmaceutical Synthetic Chemistry, Graduate School of Pharmaceutical Sciences, Kyushu University, Fukuoka, Japan.
5Division of Cell Signaling, Fujii Memorial Institute of Medical Sciences, Institute of Advanced Medical Sciences, Tokushima University, Tokushima, Japan.
Address correspondence to: Michio Nakaya, Department of Disease Control, Research Institute of Environmental Medicine, Nagoya University, Tokai National Higher Education and Research System, Furo-cho, Chikusa-ku, Nagoya, 464-8601, Japan. Phone: 81.52.789.5001; Email: nakaya@riem.nagoya-u.ac.jp.
Find articles by Nakaya, M. in: PubMed | Google Scholar
Published July 31, 2026 - More info
J Clin Invest. 2026;136(17):e182216. https://doi.org/10.1172/JCI182216.
© 2026 Takizawa et al. This work is licensed under the Creative Commons Attribution 4.0 International License. To view a copy of this license, visit http://creativecommons.org/licenses/by/4.0/.
Received: April 22, 2024; Accepted: July 9, 2026

Related article:
Abstract
Fibrosis remains a major driver of organ dysfunction, yet the metabolic programs that sustain extracellular matrix production are incompletely understood. In this issue of the JCI, Takizawa and colleagues identified branched-chain amino acid transaminase 1 (BCAT1) as a crucial metabolic regulator of fibroblast activation and fibrosis in a model of cardiac fibrosis. Their observations were corroborated by analyses of datasets from patients with heart failure with preserved ejection fraction and metabolic dysfunction–associated steatohepatitis. They report that by coupling mechanical and TGF-β signaling to a proline biosynthesis and utilization program, BCAT1 enhanced collagen production in activated cardiac fibroblasts. These findings place branched-chain amino acid metabolism as a pivotal contributor to fibroblast activation and highlight BCAT1 as a promising therapeutic target for fibrotic disease.
Authors
Marco Ronfini, John W. Elrod

-
Results
Mechanical stimulation induces Bcat1 expression in myofibroblasts. We recently reported that culturing myofibroblasts isolated from fibrotic mouse hearts in suspension for 7 days, thereby removing mechanical stimulation, induces dedifferentiation (30) (Supplemental Figure 1A; supplemental material available online with this article; https://doi.org/10.1172/JCI182216DS1). Furthermore, we showed that adherent culture for 7 days redifferentiates these cells into myofibroblasts (30) (Supplemental Figure 1A). Myofibroblast differentiation strongly induces metabolic reprogramming (5). Thus, we identified the metabolic process–related genes (Gene Ontology [GO]: 0008152) that showed altered expression during differentiation by comparing gene expression in adherent, nonadherent, and re-adherent myofibroblasts (GSE158236) (Supplemental Figure 1A). We identified 286 metabolic process–related genes downregulated more than 4-fold in dedifferentiated myofibroblasts and upregulated more than 4-fold upon redifferentiation (Figure 1A). Among the 286 genes, five (Ptx3, Il6, Lox, Thbs1, and Bcat1) showed significantly increased expression (greater than 8-fold) in fibrotic mouse hearts 3 days after MI surgery (GSE158157) (Figure 1A). In this study, we focused on BCAT1 because its function in myofibroblasts remains unclear. Using quantitative reverse transcription PCR (qRT-PCR), we confirmed that the mRNA expression levels of Bcat1 as well as of Acta2 (which encodes α–smooth muscle actin [αSMA]) and Col1a1 were decreased in nonadherent myofibroblasts and were increased in re-adherent myofibroblasts (Figure 1B) (Acta2 and Col1a1 are myofibroblast markers). Consistently, BCAT1 and αSMA protein levels were also decreased in nonadherent myofibroblasts and increased in re-adherent myofibroblasts (Figure 1C).
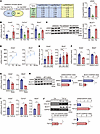 Figure 1
BCAT1 expression is induced in myofibroblasts by mechanical stimulation and TGF-β signaling. (A) Venn diagram of metabolic process genes (GO: 0008152) upregulated by mechanical stimulation and in MI-operated mouse hearts. Five overlapping genes are shown. (B) mRNA levels of Acta2, Col1a1, and Bcat1 in adherent, nonadherent, or re-adherent cardiac myofibroblasts isolated from mouse hearts at post-MI day 3 (n = 4–5). (C) Protein levels of αSMA, BCAT1, and GAPDH in adherent, nonadherent, and re-adherent cardiac myofibroblasts (n = 3). (D) mRNA levels of Acta2 and Bcat1 at 0, 12, and 24 hours after re-adherence and in nonadherent cardiac myofibroblasts (n = 5). (E) mRNA levels of Acta2 and Bcat1 in NIH3T3 cells cultured on 0.4, 6.4, or 25.6 kPa stiffness gels for 12 hours (n = 5). (F) mRNA levels of Acta2 and Bcat1 in cardiac myofibroblasts after latrunculin A (Lat.A) treatment (n = 5). (G) mRNA levels of Acta2 and Bcat1 in cardiac myofibroblasts after BTT-3033 treatment (n = 5). (H) Protein levels of αSMA, BCAT1, and GAPDH in cardiac myofibroblasts after BTT-3033 treatment (n = 3). (I and J) mRNA levels of Acta2, Col1a1, and Bcat1 (I) and protein levels of αSMA, BCAT1, and GAPDH (J) in cardiac resident fibroblasts isolated from normal mouse hearts after TGF-β stimulation (n = 3). An unpaired, 2-tailed t test was used for B–J. *P < 0.05, **P < 0.01, and ***P < 0.001. Ad, adherent; Non, nonadherent; Re, re-adherent. Data are shown as the mean ± SD.
Next, we examined temporal changes in Bcat1 mRNA expression in nonadherent myofibroblasts after transfer to plastic plates for mechanical stimulation. Bcat1 and Acta2 mRNA levels increased after mechanical stimulation in nonadherent myofibroblasts (Figure 1D). To test whether Bcat1 mRNA expression is stiffness regulated, mouse embryonic fibroblasts were cultured on polyacrylamide gels of defined stiffness (0.4, 6.4, or 25.6 kPa). We found that Bcat1 mRNA expression was significantly increased on the stiffest substrate (25.6 kPa), together with expression of the mechanosensitive genes Acta2, Ctgf, and Cyr61 (Figure 1E and Supplemental Figure 1B).
The actin cytoskeleton mediates mechanical stimulation (31, 32). Thus, we examined the effect of latrunculin A, an inhibitor of actin cytoskeleton formation, on Bcat1 mRNA expression in myofibroblasts. Latrunculin A treatment significantly reduced mRNA expression of Bcat1 and Acta2 (Figure 1F). Integrin β1 in myofibroblasts senses mechanical stimulation from the surrounding accumulated collagen, activating Rho/Rock signaling and promotes actin cytoskeleton formation (16, 17). Treatment with the integrin inhibitor (BTT-3033) decreased Acta2 and Bcat1 mRNA expression (Figure 1G), and αSMA and BCAT1 protein levels (Figure 1H). These results indicated that BCAT1 expression in myofibroblasts was induced by mechanical stimulation.
Myocardin-related transcription factors A/B (MRTFA/B) (33) and yes-associated protein 1 (YAP1) (34) are well-established mechanosensitive transcriptional coregulators. We therefore examined whether they are involved in the induction of Bcat1 mRNA expression by mechanical stimulation. In myofibroblasts, knockdown of Mrtfa/b or Yap1 did not affect Bcat1 mRNA expression (Supplemental Figure 1, C and D).
Taken together, these results indicate that mechanical induction of Bcat1 occurred independently of MRTFs and YAP1, suggesting the presence of an alternative regulatory mechanism.
TGF-β signaling induces Bcat1 expression in myofibroblasts. In addition to mechanical stimulation, TGF-β signaling is important for myofibroblast differentiation (10–12). Thus, we examined whether BCAT1 expression could be induced by TGF-β signaling.
Resident fibroblasts from normal mouse hearts and fibroblast cell lines such as IMR-90 differentiate into myofibroblasts and myofibroblast-like cells, respectively, upon TGF-β stimulation and thus increase their collagen production capacity (35, 36). As reported previously (30, 37), we found that mRNA expression of Acta2 and Col1a1 in cardiac resident fibroblasts and IMR-90 cells was increased by TGF-β treatment (Figure 1I and Supplemental Figure 1E), suggesting that these were myofibroblasts and myofibroblast-like cells, respectively. Under these conditions, TGF-β treatment increased Bcat1 expression (Figure 1I and Supplemental Figure 1E). We further confirmed that TGF-β stimulation increased the protein levels of αSMA, collagen type I alpha 1 chain (COL1A1), and BCAT1 in cardiac resident fibroblasts (Figure 1J). In contrast, stimulation with TNF-α or LPS, both of which elicit the inflammatory signaling, did not increase Bcat1 in cardiac resident fibroblasts (Supplemental Figure 1, F and G).
BCAT1 mediates BCAA catabolism (25, 26). BCAT1, in the cytoplasm, or BCAT2, in the mitochondria, converts BCAAs, such as valine, leucine, and isoleucine, to BCKAs (Supplemental Figure 1H). The BCKA dehydrogenase (BCKDH) complex, mainly BCKDHA and BCKDHB, then degrades BCKAs in mitochondria, generating products that enter the TCA cycle (Supplemental Figure 1H). We therefore examined the mRNA expression levels of Bcat2, Bckdha, and Bckdhb in cardiac resident fibroblasts after TGF-β stimulation. We found that TGF-β stimulation did not increase these mRNA expression levels (Supplemental Figure 1I). In adherent, nonadherent, and re-adherent myofibroblasts, Bcat2, Bckdha, and Bckdhb showed a pattern opposite that seen with Bcat1, with higher expression in nonadherent and lower expression in adherent and re-adherent myofibroblasts (Figure 1B and Supplemental Figure 1J).
These results indicated that TGF-β signaling induced the expression of Bcat1, but not that of other BCAA metabolism–related genes, in myofibroblasts.
MI induces Bcat1 expression in protomyofibroblast-like fibroblasts and myofibroblasts. We next measured the mRNA expression of Bcat1 and fibrosis-related genes in mouse hearts after MI. Expression of Bcat1 and Tgfb1 peaked at day 3 after MI, whereas Col1a1, Col1a2, and Acta2 expression peaked at day 7 (Figure 2A). In contrast, other BCAA catabolism–related genes, including Bcat2, Bckdha, and Bckdhb, were not upregulated in the infarcted area (Supplemental Figure 2A). Notably, Bcat1 expression remained elevated 28 days after MI, whereas Tgfb1 expression had returned to basal levels by this time point (Figure 2A). Thus, at this phase, Bcat1 expression appeared more closely associated with collagen-derived mechanical cues than was observed with Tgfb1 expression.
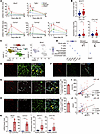 Figure 2
Bcat1 expression is specifically induced in a substantial subset of protomyofibroblast-like fibroblasts of mammalian fibrotic hearts and livers. (A) mRNA levels of Bcat1, Tgfb1, Acta2, Col1a1, and Col1a2 in intact, sham-operated, and MI-operated mouse hearts. The MI-operated mouse hearts were divided into infarcted (Infarct) and noninfarcted (Remote) areas (n = 3–6). (B) Expression levels of BCAT1, COL1A1, and COL1A2 in nonfailing (NF) human hearts or human HF hearts (GSE161472, NF: n = 37, HF: n = 47). (C) Uniform manifold approximation and projection (UMAP) plot of the scRNA-seq dataset E-MTAB-7376 with annotation by cell type (left) and Bcat1 expression in stromal cells from mouse hearts, 3 and 7 days after sham treatment or MI (right). (D) Dot plot of marker genes in each cell (left) and Bcat1 expression (right). (E and F) Codetection of Bcat1 mRNA and COL1A1 (E) or αSMA (F) protein in mouse hearts 3 days after MI. Scale bar: 20 μm. (G and H) Codetection of Bcat1 mRNA, COL1A1 protein, and Postn mRNA (G), or Snai1 mRNA (H) in mouse hearts 3 days after MI. Each graph shows the percentages of Bcat1+ cells in Postn+ or Snai1+ cells of the infarcted area (n = 4). Scale bars: 20 μm. (I and J) Relative BCAT1 and POSTN (I) or SNAI1 (J) in NF (blue) or HF (red) human hearts (GSE161472, NF: n = 37, HF: n = 47). (K) mRNA levels of Bcat1 and Col1a1 in livers of mice fed a standard diet or a CDAHFD (standard diet: n = 6, CDAHFD: n = 10). (L) BCAT1 and COL1A1 expression in healthy and MASH human livers (GSE126848, healthy: n = 14, MASH: n = 16). An unpaired, 2-tailed t test was used for A, B, K, and L. Spearman’s rank correlation test was used for I and J. Arrowheads in the images indicate merged cells. *P < 0.05, **P < 0.01, and ***P < 0.001. Data are shown as the mean ± SD.
We also analyzed BCAT1 expression in hearts from healthy volunteers and patients with heart failure (HF) with reduced ejection fraction (HFrEF) (GSE161472). The expression of BCAT1, COL1A1, and COL1A2 was significantly increased in the hearts of patients with HFrEF (Figure 2B). In contrast, the expression levels of Bcat2, Bckdha, and Bckdhb did not increase in the hearts of patients with HFrEF (Supplemental Figure 2B).
To identify cells expressing Bcat1 in fibrotic hearts after MI, we analyzed a published single-cell RNA-seq (scRNA-seq) dataset derived from stromal cells in mouse hearts 3 or 7 days after sham treatment or MI (E-MTAB-7376). In scRNA-seq analysis, stromal cells were divided into 6 clusters on the basis of marker gene expression: fibroblasts (e.g., Col1a1), endothelial cells (e.g., Kdr), macrophages (e.g., Cd68), B cells (e.g., Cd79a), T cells (e.g., Cd3d), and mural cells (e.g., Vtn) (Figure 2C, Supplemental Figure 2C). Bcat1 was specifically expressed in a cluster of fibroblasts, including myofibroblasts (Figure 2C). Dot plots also showed that the expression of Bcat1 was specific to a cluster of fibroblasts, including myofibroblasts (Figure 2D). BCAT1 has been reported to be expressed in human monocyte–derived macrophages, where it promotes immune-responsive gene 1 (IRG1) expression and enhances macrophage infiltration and collagen accumulation in arthritis and glomerulonephritis (29). In contrast, Irg1 was not expressed in the (myo)fibroblast cluster in post-MI hearts (Supplemental Figure 2C), and Bcat1 expression was not detected in CD45+ cells isolated from fibrotic mouse hearts at day 3 after MI (Supplemental Figure 2D). Consistently, at day 3 after MI, Bcat1 mRNA was detected in fibroblasts expressing abundant COL1A1, but not in CD45+ leukocytes, CD31+ endothelial cells, or TNNI3+ cardiomyocytes (Figure 2E and Supplemental Figure 2, E–G). Bcat1 mRNA was also nearly absent in sham-operated hearts, indicating that it was not expressed in resident fibroblasts (Supplemental Figure 2H). Notably, Bcat1 mRNA was detected in αSMA– fibroblasts at day 3 after MI (Figure 2F), suggesting that Bcat1 expression was induced before the emergence of fully differentiated αSMA+ myofibroblasts. We therefore referred to these COL1A1hi, αSMA– fibroblasts at day 3 after MI as protomyofibroblast-like fibroblasts. At day 7 after MI, abundant αSMA+ myofibroblasts were present in the infarcted hearts (Supplemental Figure 2I). Previous studies have identified Periostin (Postn) as a marker of protomyofibroblasts (13) and Snail family transcriptional repressor 1 (Snai1) as an early regulator of fibroblast-to-myofibroblast transition (14, 15). Therefore, we examined the relationship between Bcat1 mRNA expression and Postn- or Snai1-expressing cells at day 3 after MI. IHC and ISH analyses showed that a substantial proportion of Postn-expressing cells (approximately 65%) and Snai1-expressing cells (approximately 64%) expressed Bcat1 mRNA (Figure 2, G and H). Consistent with these findings, BCAT1 expression positively correlated with POSTN and SNAI1 expression in human HFrEF hearts (Figure 2, I and J). Bcat1 mRNA expression was induced in a substantial subset of Postn- or Snai1-expressing protomyofibroblast-like fibroblasts and was still detectable in αSMA+ myofibroblasts at day 7 after MI (Supplemental Figure 2I). Together, these findings suggest that Bcat1 expression was induced in a substantial subset of protomyofibroblast-like fibroblasts during early myofibroblast differentiation and remained expressed in αSMA+ myofibroblasts after MI (Supplemental Figure 2J).
Bcat1 expression is specifically induced in myofibroblasts of fibrotic livers. We investigated whether fibrosis increased Bcat1 mRNA expression in mouse livers. Mice were fed a choline-deficient, methionine-reduced high-fat diet (CDAHFD) for 10 weeks to induce MASH, which progresses to liver fibrosis. The mRNA expression levels of Bcat1 and Col1a1 were markedly increased in the liver (Figure 2K). Analysis of the RNA-seq dataset (GSE126848) demonstrated that expression levels of BCAT1 and COL1A1 were also increased in the livers of patients with MASH (Figure 2L).
IHC analysis of mouse livers with MASH demonstrated that Bcat1 mRNA was specifically expressed in activated hepatic stellate cells (HSCs), corresponding to liver myofibroblasts characterized by both desmin and abundant Col1a1 mRNA expression (Supplemental Figure 2K).
The expression levels of Aldh18a1, Pycr1, and Eprs are enriched in Bcat1+ fibrogenic fibroblast–lineage cells. To investigate the role of Bcat1 in cardiac fibrogenic fibroblast–lineage cells, we analyzed a scRNA-seq dataset focusing on all fibroblasts, including resident fibroblasts and fibrogenic fibroblast–lineage cells in mouse hearts 3 and 7 days after sham treatment or MI (European Molecular Biology Laboratory – European Bioinformatics Institute [EMBL-EBI] accession code: E-MTAB-7376). We divided the fibroblasts into Bcat1+ and Bcat1– fibroblasts (Figure 3A). The genes with differential expression between Bcat1+ and Bcat1– fibroblasts are shown in a volcano plot in Figure 3B. We then compared gene expression in the 2-cell population and performed GO analysis using the Database for Annotation, Visualization, and Integrated Discovery (DAVID), focusing on 822 genes that showed abundant expression in Bcat1+ cells in Figure 3B. The analysis revealed that the genes related to organonitrogen (ON) compound metabolic or biosynthetic processes were enriched in Bcat1+ cells (Figure 3C). Of the 116 genes related to the organonitrogen (ON) compound metabolic process shown in Figure 3C, expression levels of 22 genes were greatly decreased by Bcat1 knockdown in cardiac protomyofibroblast–like fibroblasts isolated from fibrotic mouse hearts 3 days after MI (siBcat1/siControl [siCtrl] <0.5) (Figure 3D). Among these 22 genes, we identified the Aldh18a1 and Pycr1, genes encoding proline synthesis enzymes and a proline translation enzyme gene, Eprs (Figure 3D). Glutamate is converted to proline by the sequential action of ALDH18A1 and PYCR1 (Figure 3E). The generated proline is attached to prolyl-tRNA via EPRS (Figure 3E), which promotes the production of proline-containing proteins, such as collagen (24). Using violin plots, we confirmed that the expression levels of Aldh18a1, Pycr1, and Eprs were higher in Bcat1+ cells than in Bcat1– cells (Figure 3F).
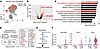 Figure 3
Aldh18a1, Pycr1, and Eprs expression is enriched in fibrogenic fibroblast–lineage cells and induced by BCAT1. (A) UMAP plot of Bcat1– (Bcat1_neg) and Bcat1+ (Bcat1_pos) fibroblasts isolated from mouse hearts 3 and 7 days after sham treatment or MI (E-MTAB-7376). (B) Volcano plot for comparison of gene expression between Bcat1– and Bcat1+ fibroblasts. (C) DAVID analysis of enriched genes in Bcat1+ fibroblasts based on log2 (fold change) and –log10 (P value), shown as red dots in B. (D) Venn diagram of ON compound metabolic process–related genes (GO: 1901564) that are highly expressed in Bcat1+ fibroblasts according to scRNA-seq and that were downregulated by Bcat1 knockdown in protomyofibroblast-like fibroblasts isolated from mouse hearts 3 days after MI according to RNA-seq. (E) Schematic diagram of proline and collagen synthesis from glutamate. (F) Expression levels of Aldh18a1, Pycr1, and Eprs in Bcat1– or Bcat1+ fibroblasts.
Mechanical stimulation and TGF-β signaling induce Aldh18a1, Pycr1, and Eprs expression. We next investigated whether mechanical stimulation and TGF-β signaling regulated the mRNA and protein expression of ALDH18A1, PYCR1, EPRS, and BCAT1 (Figure 1, B, C, I, and J). qRT-PCR and Western blot experiments demonstrated that all expression levels in nonadherent myofibroblasts were lower than those in adherent and re-adherent myofibroblasts (Figure 4, A and B), and TGF-β stimulation induced their expression in cardiac resident fibroblasts (Figure 4, C and D). These results indicated that both mechanical stimulation and TGF-β signaling induced the expression of Aldh18a1, Pycr1, and Eprs in myofibroblasts, as observed for Bcat1.
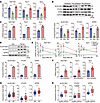 Figure 4
Aldh18a1, Pycr1, and Eprs expression is induced by mechanical stimulation and TGF-β signaling and is increased in mammalian fibrotic hearts and livers. (A) mRNA levels of Aldh18a1, Pycr1, and Eprs in adherent, nonadherent, or re-adherent cardiac myofibroblasts (n = 4–5). (B) Protein levels of ALDH18A1, PYCR1, EPRS, and GAPDH in adherent, nonadherent, or re-adherent cardiac myofibroblasts (n = 3). (C) mRNA levels of Aldh18a1, Pycr1, and Eprs in cardiac resident fibroblasts after TGF-β stimulation (n = 3). (D) Protein levels of ALDH18A1, PYCR1, EPRS, and GAPDH in cardiac resident fibroblasts after TGF-β stimulation (n = 3). (E and F) mRNA levels of Aldh18a1, Pycr1, and Eprs in intact mouse hearts or infarcted (infarct) and noninfarcted (remote) areas of mouse hearts 3, 7, and 28 days after sham treatment or MI (n = 3–6) (E) and mRNA levels in livers of mice fed a CDAHFD (standard diet: n = 6, CDAHFD: n = 10) (F). (G and H) Expression levels of ALDH18A1, PYCR1, and EPRS in human HF or NF hearts (GSE161472, NF: n = 37, HF: n = 47) (G) or human livers with MASH (GSE126848, healthy: n = 14, MASH: n = 16) (H). An unpaired, 2-tailed t test was used for A–H. *P < 0.05, **P < 0.01, and ***P < 0.001. Data represent the mean ± SD.
Aldh18a1, Pycr1, and Eprs expression is increased in mouse hearts after MI and in livers of mice with MASH. We determined the mRNA expression levels of Aldh18a1, Pycr1, and Eprs in mouse hearts after MI. Similar to Bcat1, the expression of these genes peaked on day 3 after MI (Figure 2A and Figure 4E). scRNA-seq revealed that Aldh18a1 and Pycr1 were specifically expressed in fibroblasts, including fibrogenic fibroblast–lineage cells, whereas Eprs was broadly expressed across multiple cell types in fibrotic hearts, including these cells, endothelial cells, and macrophages (Supplemental Figure 3). We also found that the mRNA expression levels of Aldh18a1, Pycr1, and Eprs were markedly increased in the livers of MASH model mice (Figure 4F).
Consistent with these data, the expression of ALDH18A1, PYCR1, and EPRS was increased in patients with HFrEF or MASH (GSE161472, GSE126848) (Figure 4, G and H). These results suggested that the expression levels of Aldh18a1, Pycr1, Eprs, and Bcat1 were increased during fibrosis in both the heart and liver.
BCAT1 promotes the expression of Aldh18a1, Pycr1, and Eprs. RNA-seq data (Figure 3D) suggested that the mRNA expression levels of Aldh18a1, Pycr1, and Eprs were reduced following Bcat1 knockdown in cardiac protomyofibroblast–like fibroblasts. This was confirmed in protomyofibroblast-like fibroblasts isolated from fibrotic hearts and activated HSCs of fibrotic livers by qRT-PCR (Figure 5A and Supplemental Figure 4A). We further found that the protein expression levels of ALDH18A1, PYCR1, and EPRS were reduced by Bcat1 knockdown in cardiac protomyofibroblast–like fibroblasts, whereas expression of αSMA was not, indicating that BCAT1 did not significantly affect differentiation into myofibroblasts (Figure 5B and Supplemental Figure 4B). Importantly, mRNA expression of ALDH18A1, PYCR1, and EPRS correlated with that of BCAT1 in the hearts of patients with HFrEF (Figure 5C).
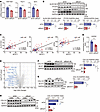 Figure 5
BCAT1 increases protein levels of collagen via proline biosynthesis in protomyofibroblast-like fibroblasts. (A and B) mRNA levels of Aldh18a1, Pycr1, and Eprs (A) and protein levels of ALDH18A1, PYCR1, EPRS, BCAT1, and GAPDH (B) in protomyofibroblast-like fibroblasts after siBcat1 treatment (n = 5). (C) Relative BCAT1 and ALDH18A1, PYCR1, and EPRS mRNA expression in human HF hearts (GSE161472, NF: n = 37, HF: n = 47). (D) Intracellular proline levels in protomyofibroblasts after siBcat1 treatment (n = 10). (E) Volcano plot of the differential 7,672 proteins identified by LC-MS/MS in protomyofibroblast-like fibroblasts after siBcat1 treatment (n = 4). Blue dots represent the collagen proteins with the top-10 PSM values detected in these cells after siBcat1 treatment. (F) Protein levels of COL1A1, BCAT1, and GAPDH in protomyofibroblast-like fibroblasts after siBcat1 treatment (n = 5). (G) Protein levels of COL1A1, BCAT1, and GAPDH in CCD-18Co cells after siBCAT1 treatment (n = 3). (H) Protein levels of COL1A1, BCAT1, and GAPDH in siBcat1-treated protomyofibroblast-like fibroblasts after proline supplementation (n = 3). An unpaired, 2-tailed t test was used for A, B, and D–H. Spearman’s rank correlation test was used for C. *P < 0.05, **P < 0.01, and ***P < 0.001. Data represent the mean ± SD.
Because both ALDH18A1 and PYCR1 are enzymes that promote proline production (Figure 3E), we examined the amount of proline in protomyofibroblast-like fibroblasts treated with siRNA against Bcat1. 3D-HPLC analysis showed that siBcat1 treatment significantly decreased intracellular proline levels in protomyofibroblast-like fibroblasts, indicating that BCAT1 enhanced proline synthesis via ALDH18A1 and PYCR1 expression (Figure 5D and Supplemental Data 1). To assess global amino acid metabolic changes regulated by BCAT1, we performed comprehensive hydrophilic metabolomics in cardiac protomyofibroblast–like fibroblasts after Bcat1 knockdown. Analysis of all 20 proteinogenic amino acids showed that Bcat1 loss broadly altered intracellular amino acid levels (Supplemental Figure 4C and Supplemental Data 2). Consistent with previous findings in BCAT1hi chronic myeloid leukemia cells showing increased levels of BCAAs, proline, and other amino acids (28), we observed the opposite pattern in cardiac protomyofibroblast–like fibroblasts, where these amino acids were consistently reduced after Bcat1 silencing (Supplemental Figure 4C and Supplemental Data 2). Together, these findings suggest that Bcat1 contributes to the regulation of intracellular amino acid pools across distinct cellular contexts.
BCAT1 promotes the protein expression level of COL1A1. ALDH18A1, PYCR1, and EPRS have been reported to increase collagen protein expression levels (21, 22, 24). Consistent with previous reports, the protein expression level of COL1A1 in protomyofibroblast-like fibroblasts was markedly suppressed by knockdown of Aldh18a1, Pycr1, or Eprs (Supplemental Figure 4, D–F). We confirmed that COL1A1 protein expression in protomyofibroblast-like fibroblasts was markedly suppressed by deficiency in glutamine and glutamic acid, which are upstream of proline synthesis (Supplemental Figure 4G).
Because we found that BCAT1 regulates the expression of ALDH18A1, PYCR1, and EPRS, we examined the effect of BCAT1 deficiency on the expression of collagen proteins, which contain a substantial amount of proline. Tandem mass tag–based (TMT-based) quantitative proteomics revealed that Bcat1 knockdown in protomyofibroblast-like fibroblasts decreased protein expression of the top-10 collagens (COL14A1, COL1A1, COL11A1, COL1A2, COL5A1, COL6A2, COL5A2, COL6A1, COL12A1, and COL3A1) with the highest number of peptide spectrum matches (PSMs) in the MS analysis (Figure 5E and Supplemental Data 3). Among the collagens, COL1A1 was most abundant in fibrotic hearts, and we performed Western blotting using COL1A1 antibody to confirm the proteomics analysis. The experiments revealed that Bcat1 knockdown decreased the protein expression levels of COL1A1 in protomyofibroblast-like fibroblasts and activated HSCs (Figure 5F and Supplemental Figure 4H). A decrease in COL1A1 protein expression levels after BCAT1 knockdown was also observed in CCD-18Co cells, a human intestinal myofibroblast line, and in LX-2 cells, a human liver myofibroblast line (Figure 5G and Supplemental Figure 4I). Importantly, we also found that the decrease in protein expression levels of COL1A1 (containing 19.0% proline) after Bcat1 knockdown in protomyofibroblast-like fibroblasts was rescued by the addition of proline (Figure 5H). In contrast, protein expression levels of COL6A1, a collagen with a lower proline content (9%), was not restored by proline supplementation (Supplemental Figure 4J). These findings raise the possibility that proline-dependent enhancement of protein synthesis in protomyofibroblast-like fibroblasts selectively augments collagens with a high proline content, such as COL1A1.
These results indicated that BCAT1 promoted the expression of COL1A1 protein, which has a high proline content, via both proline synthesis by ALDH18A1 and PYCR1 and proline attachment to its translation enzyme by EPRS in protomyofibroblast-like fibroblasts.
BCAT1 promotes SMAD3 phosphorylation, which induces the expression of Aldh18a1, Pycr1, and Eprs. We next investigated how BCAT1 promotes the expression of Aldh18a1, Pycr1, and Eprs. Because BCAT1 is an aminotransferase and has been reported to enhance mTOR signaling, an amino acid–sensing pathway (26), we examined the possible involvement of amino acid–responsive pathways. mTOR/transcription factor EB (TFEB) and General control nonderepressible 2 (GCN2) are well-established amino acid–responsive pathways (38, 39), we assessed the phosphorylation levels of mTOR, TFEB, and GCN2 following Bcat1 knockdown in protomyofibroblast-like fibroblasts from mouse fibrotic hearts. However, Western blot analysis showed that the phosphorylation levels of mTOR, TFEB, and GCN2 were unchanged (Supplemental Figure 5A).
TGF-β promotes mRNA and protein expression of Aldh18a1, Pycr1, and Eprs (Figure 4, C and D). We therefore focused on SMAD3 phosphorylation, a key mediator of TGF-β signaling (40, 41). The treatment of cardiac protomyofibroblast–like fibroblasts with an siRNA against Smad3 significantly decreased the mRNA expression of Aldh18a1, Pycr1, Eprs, and Col1a1 (Figure 6A), indicating that SMAD3 mediated the mRNA expression of these genes. We then knocked down Bcat1 in protomyofibroblast-like fibroblasts, which revealed that the Bcat1 knockdown significantly decreased the phosphorylation levels of SMAD3, thereby indicating that BCAT1 promoted the phosphorylation of SMAD3 in protomyofibroblast-like fibroblasts (Figure 6B). In fact, Col1a1 mRNA levels in protomyofibroblast-like fibroblasts were significantly reduced by siBcat1 treatment (Supplemental Figure 5B), indicating that BCAT1 also contributed to the production of Col1a1 mRNA.
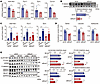 Figure 6
BCAT1 increases the expression levels of Aldh18a1, Pycr1, and Eprs in protomyofibroblast-like fibroblasts through BCAA-dependent SMAD3 signaling. (A) mRNA levels of Aldh18a1, Pycr1, Eprs, and Col1a1 in protomyofibroblast-like fibroblasts after siSmad3 treatment (n = 5). (B) Protein levels of p-SMAD3 and SMAD3 in protomyofibroblast-like fibroblasts after siBcat1 treatment (n = 5). (C) ChIP-qPCR for SMAD3 binding to the promoters of Aldh18a1, Pycr1, and Eprs in protomyofibroblast-like fibroblasts after siBcat1 treatment (control: n = 3; SMAD3: n = 9). (D) Intracellular levels of valine, leucine, and isoleucine in protomyofibroblast-like fibroblasts after siBcat1 treatment (n = 10). (E) Protein levels of ALDH18A1, PYCR1, EPRS, BCAT1, p-SMAD3, SMAD3, and GAPDH in siBcat1-treated protomyofibroblast-like fibroblasts after BCAA treatment (n = 3). An unpaired, 2-tailed t test was used for A, B, and D. One-way ANOVA with Tukey’s test was used for C and E. *P < 0.05, **P < 0.01, and ***P < 0.001. Data are shown as the mean ± SD.
Consistent with these findings, analysis of published ChIP-seq data (GSE145250) showed SMAD3 binding sites in the upstream regions of ALDH18A1, PYCR1, EPRS, and COL1A1 (Supplemental Figure 5C). To validate this result, we performed ChIP-qPCR with an anti-SMAD3 antibody in protomyofibroblast-like fibroblasts and found significant SMAD3 enrichment at the promoter regions of Aldh18a1, Pycr1, and Eprs (Figure 6C). Notably, Bcat1 knockdown markedly reduced SMAD3 occupancy at these sites (Figure 6C). Together, these results indicate that BCAT1 enhanced SMAD3 activation and promoted the transcription of Aldh18a1, Pycr1, and Eprs in protomyofibroblast-like fibroblasts.
We next examined whether BCAT1-mediated BCAA production enhances SMAD3-dependent transcription of these genes in protomyofibroblast-like fibroblasts. To determine whether BCAT1 primarily drives the anabolic or catabolic arm of BCAA metabolism in these cells, we measured intracellular BCAA levels after Bcat1 knockdown. Both 3D-HPLC and GC-MS analyses showed that Bcat1 knockdown significantly reduced intracellular levels of BCAAs, including valine, leucine, and isoleucine, in protomyofibroblast-like fibroblasts (Figure 6D, Supplemental Figure 4C, and Supplemental Data 1 and 2). Notably, BCAA supplementation restored ALDH18A1, PYCR1, and EPRS expression, as well as SMAD3 phosphorylation, after Bcat1 knockdown (Figure 6E).
We finally asked whether BCAT1 expression alone is sufficient to induce SMAD3 phosphorylation and collagen production in the absence of mechanical stress or TGF-β signaling. We induced overexpression of BCAT1 in cardiac resident fibroblasts from normal mouse hearts and cultured them in suspension on nonadherent plates for 3 days to minimize mechanical cues and TGF-β–dependent activation. Under these conditions, SMAD3 phosphorylation and COL1A1 expression were largely unchanged in BCAT1-overexpressing fibroblasts (Supplemental Figure 5D). These results indicate that BCAT1 overexpression alone was insufficient to activate SMAD3 or induce collagen production.
BCAT1 enhances phosphorylation of HDAC5 at Ser488, leading to subsequent SMAD3 phosphorylation. Next, we performed phosphoproteomics analysis of Bcat1-knockdown protomyofibroblast-like fibroblasts to identify molecules linking BCAT1 to SMAD3 phosphorylation (Supplemental Data 4). Among the altered phosphoproteins, phosphorylation of HDAC5 at Ser488, which has been reported to promote SMAD3 phosphorylation, was markedly reduced by Bcat1 knockdown (Figure 7A). We validated this finding by Western blotting using an antibody against phosphorylated mouse HDAC4 (Ser629)/HDAC5 (Ser488) and confirmed the phosphorylated HDAC5 (p-HDAC5) band by Hdac5 siRNA treatment (Supplemental Figure 6). Consistently, we found that Bcat1 knockdown reduced HDAC5 (Ser488) phosphorylation in protomyofibroblast-like fibroblasts (Figure 7B). Moreover, Hdac5 knockdown suppressed both SMAD3 phosphorylation and COL1A1 protein expression, as previously reported (42) (Figure 7C). To assess the functional relevance of HDAC5 (Ser488) phosphorylation, we induced overexpression of either WT HDAC5 or a phospho-null mutant (S488A). WT HDAC5 increased SMAD3 phosphorylation, whereas the S488A mutant did not (Figure 7D). COL1A1 protein expression was also markedly increased by WT HDAC5, but not comparably by the S488A mutant (Figure 7D). Importantly, BCAA supplementation restored HDAC5 (Ser488) phosphorylation after Bcat1 knockdown (Figure 7E). Together, these results indicate that BCAT1-mediated BCAA production promoted HDAC5 (Ser488) phosphorylation, leading to SMAD3 activation and induction of Aldh18a1, Pycr1, and Eprs expression in protomyofibroblast-like fibroblasts.
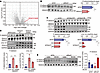 Figure 7
BCAT1 increases the phosphorylation of HDAC5 at Ser488 in protomyofibroblast-like fibroblasts through BCAA production. (A) Volcano plot of the differentially regulated phosphorylated peptides in which the protein expression was not reduced by siBcat1 (siCtrl/siBcat1 ratio >0.9) in protomyofibroblast-like fibroblasts after siBcat1 treatment (n = 4). (B) Protein levels of p-HDAC5 (Ser488) and HDAC5 in protomyofibroblast-like fibroblasts after siBcat1 treatment (n = 4). (C) Protein levels of p-SMAD3, SMAD3, COL1A1, HDAC5, and GAPDH in protomyofibroblast-like fibroblasts after siHdac5 treatment (n = 4). (D) Protein levels of p-SMAD3, SMAD3, COL1A1, HDAC5, and GAPDH in protomyofibroblast-like fibroblasts after pMXs-puro, HDAC5 WT, or HDAC5 S488A overexpression (n = 3). (E) Protein levels of p-HDAC5, and HDAC5 in protomyofibroblast-like fibroblasts with siBcat1 treatment after BCAA treatment (n = 3). An unpaired, 2-tailed t test was used for A–C. One-way ANOVA with Tukey’s test was used for D and E. *P < 0.05, **P < 0.01, and ***P < 0.001. Data are shown as the mean ± SD.
Increased cardiac expression of ALDH18A1, PYCR1, and EPRS and post-MI cardiac fibrosis are attenuated in Bcat1-KO mice. To assess BCAT1 function in vivo, we established Bcat1-KO mice (Supplemental Figure 7, A–C) (43). We examined mRNA expression of Aldh18a1, Pycr1, Eprs, and Col1a1 in remote nonfibrotic areas (rem) and infarcted fibrotic areas (inf) of WT and Bcat1-KO mouse hearts 3 days after MI. qRT-PCR revealed that induction of Aldh18a1, Pycr1, Eprs, and Col1a1 mRNA expression in fibrotic areas was significantly attenuated in Bcat1-KO mice as compared with that in WT mice (Figure 8A). Consistent with this result, we found that mRNA expression of Aldh18a1, Pycr1, Eprs, and Col1a1 was decreased in isolated cardiac protomyofibroblast–like fibroblasts of Bcat1-KO mouse hearts as compared with that in WT mouse hearts (Figure 8B). We further observed that protein expression levels of ALDH18A1, PYCR1, and EPRS were reduced in the fibrotic area and isolated cardiac protomyofibroblast–like fibroblasts of Bcat1-KO mouse hearts after MI, as compared with those of WT mouse hearts (Figure 8C and Supplemental Figure 7D). In addition, the protein expression levels of COL1A1 and phosphorylated SMAD3 and HDAC5 were decreased in the fibrotic area and isolated protomyofibroblast-like fibroblasts of Bcat1-KO mouse hearts 3 days after MI (Figure 8D and Supplemental Figure 7E). The decrease in cardiac fibrosis after MI in Bcat1-KO mice was verified by Picrosirius red staining of heart sections 28 days after MI (Figure 8E). Thus, we examined cardiac function in WT and Bcat1-KO mice 28 days after MI using echocardiography. The results showed that ejection fraction (EF) and fractional shortening (FS) rates were significantly increased in Bcat1-KO mice as compared with those in WT mice (Figure 8F, Supplemental Figure 7F, and Supplemental Table 1). These results indicated that BCAT1 promoted the protein expression of enzymes related to proline synthesis and translation in protomyofibroblast-like fibroblasts, leading to collagen accumulation in the heart after MI. In contrast, mRNA expression of proinflammatory genes in the infarcted area and in these cells was comparable between WT and Bcat1-KO mice 3 days after MI (Supplemental Figure 7, G and H). Moreover, infiltration of CD45+ macrophages into the fibrotic area and mRNA expression levels of Tnf, Tgfb1, Il1b, and Cxcl2 in macrophages isolated from WT and Bcat1-KO hearts after MI did not significantly differ between the 2 groups (Supplemental Figure 7, I and J). We also observed no difference in the proliferative capacity of fibrogenic fibroblast–lineage cells between WT and Bcat1-KO mice at post-MI day 4 (Supplemental Figure 7K). Taken together, these findings indicate that BCAT1 did not contribute to the inflammation that initiated fibrosis or to the proliferation of fibrogenic fibroblast–lineage cells in fibrotic hearts.
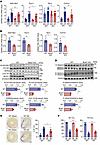 Figure 8
Bcat1 deficiency attenuates mouse cardiac fibrosis and improves cardiac function after MI. (A) mRNA levels of Aldh18a1, Pycr1, Eprs, and Col1a1 in infarcted (inf) or noninfarcted (rem) areas of WT or Bcat1-KO (KO) mouse hearts 3 days after MI (n = 12). (B) mRNA levels of Aldh18a1, Pycr1, Eprs, and Col1a1 in protomyofibroblast-like fibroblasts isolated from WT or Bcat1-KO mouse hearts 3 days after MI (n = 5). (C and D) Protein levels of COL1A1, ALDH18A1, PYCR1, EPRS, BCAT1, and β-tubulin (C), p-SMAD3, SMAD3, p-HDAC5, and HDAC5 (D), in protomyofibroblast-like fibroblasts isolated from WT or Bcat1-KO mouse hearts 3 days after MI (n = 4–5). (E) Collagen staining of WT or Bcat1-KO mouse hearts 28 days after sham treatment (Sh) or MI. The collagen volume fraction (CVF) was calculated as the percentage of the Picrosirius red+ area (WT sham/MI: n = 5/7, KO sham/MI: n = 5/8). Scale bar: 1 mm. (F) Cardiac function in WT or Bcat1-KO mice 28 days after sham treatment or MI (WT sham/MI: n = 8/12, KO sham/MI: n = 8/12). An unpaired, 2-tailed t test was used for B–D. One-way ANOVA with Tukey’s test was used for A, E, and F. *P < 0.05, **P < 0.01, and ***P < 0.001. Data are shown as the mean ± SD.
Inhibition of BCAT1 attenuates cardiac fibrosis and dysfunction after MI. Finally, we investigated the effects of ERG240 (29), a specific inhibitor of BCAT1, on cardiac fibrosis and dysfunction after MI. We first examined whether treatment of protomyofibroblast-like fibroblasts with ERG240 affects the expression levels of Aldh18a1, Pycr1, and Eprs. We observed that ERG240 treatment significantly suppressed mRNA and protein expression of these enzymes in this cell population (Figure 9, A and B).
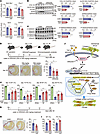 Figure 9
ERG240 treatment attenuates mouse cardiac fibrosis and improves cardiac function after MI. (A) mRNA levels of Aldh18a1, Pycr1, Eprs, and Col1a1 in protomyofibroblast-like fibroblasts after ERG240 treatment (n = 5). (B and C) Protein levels of COL1A1, ALDH18A1, PYCR1, EPRS, and GAPDH (B), and of p-SMAD3, SMAD3, p-HDAC5, and HDAC5 (C) in protomyofibroblast-like fibroblasts after ERG240 treatment (n = 4). (D) Schematic image of water or ERG240 treatment for 10 days after MI. (E) Collagen staining of the heart 28 days after MI in mice administrated ERG240 for 10 days. The CVF was calculated as the percentage of the Picrosirius red+ area (n = 5). Scale bar: 1 mm. (F) Cardiac function 14 and 28 days after sham treatment or MI in mice administrated ERG240 for 10 days (sham/MI: n = 9/5). (G) Schematic of treatment for 7 days with water or ERG240 (250 mg/kg) starting at post-MI day 7. (H) Collagen staining of the heart 28 days after MI in mice administrated ERG240 for 7 days, starting at post-MI day 7. The CVF was calculated as the percentage of the Picrosirius red+ area (water: n = 5, ERG240: n = 6). Scale bar: 1 mm. (I) Cardiac function 28 days after sham treatment or MI in mice administrated ERG240 for 7 days, starting at post-MI day 7 (water: n = 5, ERG240: n = 6). (J) Schematic of the BCAT1-mediated signaling pathway that enhances collagen expression in protomyofibroblast-like fibroblasts after MI. An unpaired, 2-tailed t test was used for A–C, E, H, and I. One-way ANOVA with Tukey’s test was used for F. *P < 0.05, **P < 0.01, and ***P < 0.001. Data are shown as the mean ± SD.
We further found that the protein expression levels of COL1A1 and the phosphorylation levels of SMAD3 and HDAC5 were significantly suppressed by ERG240 treatment in protomyofibroblast-like fibroblasts of fibrotic hearts 3 days after MI (Figure 9, B and C). In contrast, ERG240 treatment did not alter the infiltration of CD45+ macrophages into the fibrotic area or the mRNA expression levels of Tnf, Tgfb1, Il1b, and Cxcl2 in macrophages isolated from fibrotic hearts (Supplemental Figure 8, A and B), indicating that ERG240 did not enhance inflammatory responses.
We next administered ERG240 to WT mice for 10 days, starting the day after MI, and measured collagen accumulation in the hearts 28 days after MI and cardiac function at 14 and 28 days after MI (Figure 9D). We found that ERG240 administration significantly reduced collagen accumulation in mouse hearts after MI (Figure 9E). The administration also attenuated decreased in the EF and FS, indicating reduced post-MI cardiac dysfunction (Figure 9F, Supplemental Figure 8C, and Supplemental Table 2).
We next examined whether ERG240 administration initiated on day 7 after MI, when acute inflammation shifts to the chronic inflammatory phase, could ameliorate fibrosis (Figure 9G). We found that ERG240 treatment initiated on day 7 after MI and continued for 7 consecutive days significantly reduced cardiac collagen deposition 28 days after MI (Figure 9H). In addition, treatment with ERG240 attenuated the decline in EF and FS (Figure 9I, Supplemental Figure 8D, and Supplemental Table 3). These findings demonstrate that BCAT1 inhibition mitigated post-MI cardiac fibrosis and functional deterioration during both the acute and chronic inflammatory phases.


Copyright © 2026 American Society for Clinical Investigation
ISSN: 0021-9738 (print), 1558-8238 (online)