
Advertisement
Research ArticleImmunologyOncology
Open Access |  10.1172/JCI174092
Osteopontin mediates acquired resistance to hypoxia-inducing antiangiogenics and promotes anti–PD-L1 refractoriness in breast cancer models
Jose Luis Ruiz-Sepulveda,1 Maria J. Bueno,1 Silvana Mouron,1 Veronica Jimenez-Renard,1 Manuel Muñoz,1 Manuel Moradiellos,2 Leonardo D. Garma,1 Luis García-Jimeno,2 Adam W. Watson,3 Ghassan Mouneimne,3,4 Solip Park,2 Rebeca Jimeno,1,5 and Miguel Quintela-Fandino1,6,7
1Breast Cancer Clinical Research Unit and
2Computational Cancer Genomics Group, Centro Nacional de Investigaciones Oncológicas, Madrid, Spain.
3MeCo Diagnostics Holdings, Inc., San Diego, California, USA.
4University of Arizona Cancer Center, Tucson, Arizona, USA.
5Centro de Biología Molecular Severo Ochoa–CSIC, Universidad Autónoma de Madrid, Cantoblanco, Madrid, Spain.
6Endowed Chair of Personalized Precision Medicine, Universidad Autónoma de Madrid– Fundación Instituto Roche, Madrid, Spain.
7Medical Oncology Department, Hospital Universitario de La Princesa, Madrid, Spain.
Address correspondence to: Miguel Quintela-Fandino, Head of the Breast Cancer Clinical Research Unit, CNIO–Spanish National Cancer Research Center, Melchor Fernández Almagro, 3, Madrid 28029, Spain. Phone: 34.917.328.000; Email: mquintela@cnio.es. Or to: Rebeca Jimeno, Centro de Biología Molecular Severo Ochoa–CSIC, Campus Universidad Autónoma de Madrid, Nicolas Cabrera, 1 Cantoblanco, Madrid 28049, Spain. Phone: 34.911.964.574; Email: rjimeno@cbm.csic.es.
Authorship note: RJ and MQF contributed equally to this work.
Find articles by Ruiz-Sepulveda, J. in: PubMed | Google Scholar
1Breast Cancer Clinical Research Unit and
2Computational Cancer Genomics Group, Centro Nacional de Investigaciones Oncológicas, Madrid, Spain.
3MeCo Diagnostics Holdings, Inc., San Diego, California, USA.
4University of Arizona Cancer Center, Tucson, Arizona, USA.
5Centro de Biología Molecular Severo Ochoa–CSIC, Universidad Autónoma de Madrid, Cantoblanco, Madrid, Spain.
6Endowed Chair of Personalized Precision Medicine, Universidad Autónoma de Madrid– Fundación Instituto Roche, Madrid, Spain.
7Medical Oncology Department, Hospital Universitario de La Princesa, Madrid, Spain.
Address correspondence to: Miguel Quintela-Fandino, Head of the Breast Cancer Clinical Research Unit, CNIO–Spanish National Cancer Research Center, Melchor Fernández Almagro, 3, Madrid 28029, Spain. Phone: 34.917.328.000; Email: mquintela@cnio.es. Or to: Rebeca Jimeno, Centro de Biología Molecular Severo Ochoa–CSIC, Campus Universidad Autónoma de Madrid, Nicolas Cabrera, 1 Cantoblanco, Madrid 28049, Spain. Phone: 34.911.964.574; Email: rjimeno@cbm.csic.es.
Authorship note: RJ and MQF contributed equally to this work.
Find articles by Bueno, M. in: PubMed | Google Scholar
1Breast Cancer Clinical Research Unit and
2Computational Cancer Genomics Group, Centro Nacional de Investigaciones Oncológicas, Madrid, Spain.
3MeCo Diagnostics Holdings, Inc., San Diego, California, USA.
4University of Arizona Cancer Center, Tucson, Arizona, USA.
5Centro de Biología Molecular Severo Ochoa–CSIC, Universidad Autónoma de Madrid, Cantoblanco, Madrid, Spain.
6Endowed Chair of Personalized Precision Medicine, Universidad Autónoma de Madrid– Fundación Instituto Roche, Madrid, Spain.
7Medical Oncology Department, Hospital Universitario de La Princesa, Madrid, Spain.
Address correspondence to: Miguel Quintela-Fandino, Head of the Breast Cancer Clinical Research Unit, CNIO–Spanish National Cancer Research Center, Melchor Fernández Almagro, 3, Madrid 28029, Spain. Phone: 34.917.328.000; Email: mquintela@cnio.es. Or to: Rebeca Jimeno, Centro de Biología Molecular Severo Ochoa–CSIC, Campus Universidad Autónoma de Madrid, Nicolas Cabrera, 1 Cantoblanco, Madrid 28049, Spain. Phone: 34.911.964.574; Email: rjimeno@cbm.csic.es.
Authorship note: RJ and MQF contributed equally to this work.
Find articles by Mouron, S. in: PubMed | Google Scholar
1Breast Cancer Clinical Research Unit and
2Computational Cancer Genomics Group, Centro Nacional de Investigaciones Oncológicas, Madrid, Spain.
3MeCo Diagnostics Holdings, Inc., San Diego, California, USA.
4University of Arizona Cancer Center, Tucson, Arizona, USA.
5Centro de Biología Molecular Severo Ochoa–CSIC, Universidad Autónoma de Madrid, Cantoblanco, Madrid, Spain.
6Endowed Chair of Personalized Precision Medicine, Universidad Autónoma de Madrid– Fundación Instituto Roche, Madrid, Spain.
7Medical Oncology Department, Hospital Universitario de La Princesa, Madrid, Spain.
Address correspondence to: Miguel Quintela-Fandino, Head of the Breast Cancer Clinical Research Unit, CNIO–Spanish National Cancer Research Center, Melchor Fernández Almagro, 3, Madrid 28029, Spain. Phone: 34.917.328.000; Email: mquintela@cnio.es. Or to: Rebeca Jimeno, Centro de Biología Molecular Severo Ochoa–CSIC, Campus Universidad Autónoma de Madrid, Nicolas Cabrera, 1 Cantoblanco, Madrid 28049, Spain. Phone: 34.911.964.574; Email: rjimeno@cbm.csic.es.
Authorship note: RJ and MQF contributed equally to this work.
Find articles by Jimenez-Renard, V. in: PubMed | Google Scholar
1Breast Cancer Clinical Research Unit and
2Computational Cancer Genomics Group, Centro Nacional de Investigaciones Oncológicas, Madrid, Spain.
3MeCo Diagnostics Holdings, Inc., San Diego, California, USA.
4University of Arizona Cancer Center, Tucson, Arizona, USA.
5Centro de Biología Molecular Severo Ochoa–CSIC, Universidad Autónoma de Madrid, Cantoblanco, Madrid, Spain.
6Endowed Chair of Personalized Precision Medicine, Universidad Autónoma de Madrid– Fundación Instituto Roche, Madrid, Spain.
7Medical Oncology Department, Hospital Universitario de La Princesa, Madrid, Spain.
Address correspondence to: Miguel Quintela-Fandino, Head of the Breast Cancer Clinical Research Unit, CNIO–Spanish National Cancer Research Center, Melchor Fernández Almagro, 3, Madrid 28029, Spain. Phone: 34.917.328.000; Email: mquintela@cnio.es. Or to: Rebeca Jimeno, Centro de Biología Molecular Severo Ochoa–CSIC, Campus Universidad Autónoma de Madrid, Nicolas Cabrera, 1 Cantoblanco, Madrid 28049, Spain. Phone: 34.911.964.574; Email: rjimeno@cbm.csic.es.
Authorship note: RJ and MQF contributed equally to this work.
Find articles by Muñoz, M. in: PubMed | Google Scholar
1Breast Cancer Clinical Research Unit and
2Computational Cancer Genomics Group, Centro Nacional de Investigaciones Oncológicas, Madrid, Spain.
3MeCo Diagnostics Holdings, Inc., San Diego, California, USA.
4University of Arizona Cancer Center, Tucson, Arizona, USA.
5Centro de Biología Molecular Severo Ochoa–CSIC, Universidad Autónoma de Madrid, Cantoblanco, Madrid, Spain.
6Endowed Chair of Personalized Precision Medicine, Universidad Autónoma de Madrid– Fundación Instituto Roche, Madrid, Spain.
7Medical Oncology Department, Hospital Universitario de La Princesa, Madrid, Spain.
Address correspondence to: Miguel Quintela-Fandino, Head of the Breast Cancer Clinical Research Unit, CNIO–Spanish National Cancer Research Center, Melchor Fernández Almagro, 3, Madrid 28029, Spain. Phone: 34.917.328.000; Email: mquintela@cnio.es. Or to: Rebeca Jimeno, Centro de Biología Molecular Severo Ochoa–CSIC, Campus Universidad Autónoma de Madrid, Nicolas Cabrera, 1 Cantoblanco, Madrid 28049, Spain. Phone: 34.911.964.574; Email: rjimeno@cbm.csic.es.
Authorship note: RJ and MQF contributed equally to this work.
Find articles by Moradiellos, M. in: PubMed | Google Scholar
1Breast Cancer Clinical Research Unit and
2Computational Cancer Genomics Group, Centro Nacional de Investigaciones Oncológicas, Madrid, Spain.
3MeCo Diagnostics Holdings, Inc., San Diego, California, USA.
4University of Arizona Cancer Center, Tucson, Arizona, USA.
5Centro de Biología Molecular Severo Ochoa–CSIC, Universidad Autónoma de Madrid, Cantoblanco, Madrid, Spain.
6Endowed Chair of Personalized Precision Medicine, Universidad Autónoma de Madrid– Fundación Instituto Roche, Madrid, Spain.
7Medical Oncology Department, Hospital Universitario de La Princesa, Madrid, Spain.
Address correspondence to: Miguel Quintela-Fandino, Head of the Breast Cancer Clinical Research Unit, CNIO–Spanish National Cancer Research Center, Melchor Fernández Almagro, 3, Madrid 28029, Spain. Phone: 34.917.328.000; Email: mquintela@cnio.es. Or to: Rebeca Jimeno, Centro de Biología Molecular Severo Ochoa–CSIC, Campus Universidad Autónoma de Madrid, Nicolas Cabrera, 1 Cantoblanco, Madrid 28049, Spain. Phone: 34.911.964.574; Email: rjimeno@cbm.csic.es.
Authorship note: RJ and MQF contributed equally to this work.
Find articles by Garma, L. in: PubMed | Google Scholar
1Breast Cancer Clinical Research Unit and
2Computational Cancer Genomics Group, Centro Nacional de Investigaciones Oncológicas, Madrid, Spain.
3MeCo Diagnostics Holdings, Inc., San Diego, California, USA.
4University of Arizona Cancer Center, Tucson, Arizona, USA.
5Centro de Biología Molecular Severo Ochoa–CSIC, Universidad Autónoma de Madrid, Cantoblanco, Madrid, Spain.
6Endowed Chair of Personalized Precision Medicine, Universidad Autónoma de Madrid– Fundación Instituto Roche, Madrid, Spain.
7Medical Oncology Department, Hospital Universitario de La Princesa, Madrid, Spain.
Address correspondence to: Miguel Quintela-Fandino, Head of the Breast Cancer Clinical Research Unit, CNIO–Spanish National Cancer Research Center, Melchor Fernández Almagro, 3, Madrid 28029, Spain. Phone: 34.917.328.000; Email: mquintela@cnio.es. Or to: Rebeca Jimeno, Centro de Biología Molecular Severo Ochoa–CSIC, Campus Universidad Autónoma de Madrid, Nicolas Cabrera, 1 Cantoblanco, Madrid 28049, Spain. Phone: 34.911.964.574; Email: rjimeno@cbm.csic.es.
Authorship note: RJ and MQF contributed equally to this work.
Find articles by García-Jimeno, L. in: PubMed | Google Scholar
1Breast Cancer Clinical Research Unit and
2Computational Cancer Genomics Group, Centro Nacional de Investigaciones Oncológicas, Madrid, Spain.
3MeCo Diagnostics Holdings, Inc., San Diego, California, USA.
4University of Arizona Cancer Center, Tucson, Arizona, USA.
5Centro de Biología Molecular Severo Ochoa–CSIC, Universidad Autónoma de Madrid, Cantoblanco, Madrid, Spain.
6Endowed Chair of Personalized Precision Medicine, Universidad Autónoma de Madrid– Fundación Instituto Roche, Madrid, Spain.
7Medical Oncology Department, Hospital Universitario de La Princesa, Madrid, Spain.
Address correspondence to: Miguel Quintela-Fandino, Head of the Breast Cancer Clinical Research Unit, CNIO–Spanish National Cancer Research Center, Melchor Fernández Almagro, 3, Madrid 28029, Spain. Phone: 34.917.328.000; Email: mquintela@cnio.es. Or to: Rebeca Jimeno, Centro de Biología Molecular Severo Ochoa–CSIC, Campus Universidad Autónoma de Madrid, Nicolas Cabrera, 1 Cantoblanco, Madrid 28049, Spain. Phone: 34.911.964.574; Email: rjimeno@cbm.csic.es.
Authorship note: RJ and MQF contributed equally to this work.
Find articles by Watson, A. in: PubMed | Google Scholar
1Breast Cancer Clinical Research Unit and
2Computational Cancer Genomics Group, Centro Nacional de Investigaciones Oncológicas, Madrid, Spain.
3MeCo Diagnostics Holdings, Inc., San Diego, California, USA.
4University of Arizona Cancer Center, Tucson, Arizona, USA.
5Centro de Biología Molecular Severo Ochoa–CSIC, Universidad Autónoma de Madrid, Cantoblanco, Madrid, Spain.
6Endowed Chair of Personalized Precision Medicine, Universidad Autónoma de Madrid– Fundación Instituto Roche, Madrid, Spain.
7Medical Oncology Department, Hospital Universitario de La Princesa, Madrid, Spain.
Address correspondence to: Miguel Quintela-Fandino, Head of the Breast Cancer Clinical Research Unit, CNIO–Spanish National Cancer Research Center, Melchor Fernández Almagro, 3, Madrid 28029, Spain. Phone: 34.917.328.000; Email: mquintela@cnio.es. Or to: Rebeca Jimeno, Centro de Biología Molecular Severo Ochoa–CSIC, Campus Universidad Autónoma de Madrid, Nicolas Cabrera, 1 Cantoblanco, Madrid 28049, Spain. Phone: 34.911.964.574; Email: rjimeno@cbm.csic.es.
Authorship note: RJ and MQF contributed equally to this work.
Find articles by Mouneimne, G. in: PubMed | Google Scholar
1Breast Cancer Clinical Research Unit and
2Computational Cancer Genomics Group, Centro Nacional de Investigaciones Oncológicas, Madrid, Spain.
3MeCo Diagnostics Holdings, Inc., San Diego, California, USA.
4University of Arizona Cancer Center, Tucson, Arizona, USA.
5Centro de Biología Molecular Severo Ochoa–CSIC, Universidad Autónoma de Madrid, Cantoblanco, Madrid, Spain.
6Endowed Chair of Personalized Precision Medicine, Universidad Autónoma de Madrid– Fundación Instituto Roche, Madrid, Spain.
7Medical Oncology Department, Hospital Universitario de La Princesa, Madrid, Spain.
Address correspondence to: Miguel Quintela-Fandino, Head of the Breast Cancer Clinical Research Unit, CNIO–Spanish National Cancer Research Center, Melchor Fernández Almagro, 3, Madrid 28029, Spain. Phone: 34.917.328.000; Email: mquintela@cnio.es. Or to: Rebeca Jimeno, Centro de Biología Molecular Severo Ochoa–CSIC, Campus Universidad Autónoma de Madrid, Nicolas Cabrera, 1 Cantoblanco, Madrid 28049, Spain. Phone: 34.911.964.574; Email: rjimeno@cbm.csic.es.
Authorship note: RJ and MQF contributed equally to this work.
Find articles by Park, S. in: PubMed | Google Scholar
1Breast Cancer Clinical Research Unit and
2Computational Cancer Genomics Group, Centro Nacional de Investigaciones Oncológicas, Madrid, Spain.
3MeCo Diagnostics Holdings, Inc., San Diego, California, USA.
4University of Arizona Cancer Center, Tucson, Arizona, USA.
5Centro de Biología Molecular Severo Ochoa–CSIC, Universidad Autónoma de Madrid, Cantoblanco, Madrid, Spain.
6Endowed Chair of Personalized Precision Medicine, Universidad Autónoma de Madrid– Fundación Instituto Roche, Madrid, Spain.
7Medical Oncology Department, Hospital Universitario de La Princesa, Madrid, Spain.
Address correspondence to: Miguel Quintela-Fandino, Head of the Breast Cancer Clinical Research Unit, CNIO–Spanish National Cancer Research Center, Melchor Fernández Almagro, 3, Madrid 28029, Spain. Phone: 34.917.328.000; Email: mquintela@cnio.es. Or to: Rebeca Jimeno, Centro de Biología Molecular Severo Ochoa–CSIC, Campus Universidad Autónoma de Madrid, Nicolas Cabrera, 1 Cantoblanco, Madrid 28049, Spain. Phone: 34.911.964.574; Email: rjimeno@cbm.csic.es.
Authorship note: RJ and MQF contributed equally to this work.
Find articles by Jimeno, R. in: PubMed | Google Scholar
1Breast Cancer Clinical Research Unit and
2Computational Cancer Genomics Group, Centro Nacional de Investigaciones Oncológicas, Madrid, Spain.
3MeCo Diagnostics Holdings, Inc., San Diego, California, USA.
4University of Arizona Cancer Center, Tucson, Arizona, USA.
5Centro de Biología Molecular Severo Ochoa–CSIC, Universidad Autónoma de Madrid, Cantoblanco, Madrid, Spain.
6Endowed Chair of Personalized Precision Medicine, Universidad Autónoma de Madrid– Fundación Instituto Roche, Madrid, Spain.
7Medical Oncology Department, Hospital Universitario de La Princesa, Madrid, Spain.
Address correspondence to: Miguel Quintela-Fandino, Head of the Breast Cancer Clinical Research Unit, CNIO–Spanish National Cancer Research Center, Melchor Fernández Almagro, 3, Madrid 28029, Spain. Phone: 34.917.328.000; Email: mquintela@cnio.es. Or to: Rebeca Jimeno, Centro de Biología Molecular Severo Ochoa–CSIC, Campus Universidad Autónoma de Madrid, Nicolas Cabrera, 1 Cantoblanco, Madrid 28049, Spain. Phone: 34.911.964.574; Email: rjimeno@cbm.csic.es.
Authorship note: RJ and MQF contributed equally to this work.
Find articles by Quintela-Fandino, M. in: PubMed | Google Scholar
Published July 15, 2026 - More info
J Clin Invest. 2026;136(14):e174092. https://doi.org/10.1172/JCI174092.
© 2026 Ruiz-Sepulveda et al. This work is licensed under the Creative Commons Attribution 4.0 International License. To view a copy of this license, visit http://creativecommons.org/licenses/by/4.0/.
Received: February 1, 2024; Accepted: May 28, 2026

-
Results
Hypoxia-inducing antiangiogenic treatment upregulates the PD-1/PD-L1 axis, but blocking it in this context lacks efficacy both in animals and in patients. We had previously observed that the anti-murine VEGF antibody B20-4.1.1, the murine analog of bevacizumab, was the antiangiogenic agent that most consistently increased vascular abnormality and tumor hypoxia while retaining antitumor activity (6). We therefore treated the FVB MMTV-PyMT breast cancer model with vehicle (isotype IgG2a control; VT) or B20-4.1.1. B20-4.1.1 significantly inhibited tumor growth and doubled median OS (5 vs. 10 weeks, P < 0.0001; Figure 1A) but also increased tumor hypoxia compared with VT (Figure 1B). However, the hypoxic response was heterogeneous across individual tumors in both groups (Figure 1C). To distinguish tumors that increased hypoxia after treatment from those that corrected it, we classified B20-4.1.1–treated tumors according to the median hypoxic fraction at week 6 (10.4% of tumor area), defining them as high hypoxia (HH) or low hypoxia (LH) tumors. This divergence had only a modest impact on tumor growth and survival within the treated cohort (median OS 9.1 and 10.0 weeks for HH and LH tumors, respectively; Figure 1D), indicating that the main consequence of this branching response was unlikely to be explained by direct differences in tumor growth control.
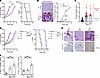 Figure 1
Anti-VEGF treatment generates hypoxic and nonhypoxic response patterns associated with differential PD-L1 induction. (A) Tumor growth and OS in response to B20-4.1.1 (n = 31) or isotype control (n = 36). Two-way ANOVA followed by Šidák’s multiple-comparison test. (B) Representative anti-pimonidazole (aPimonidazole) staining and quantification of tumor hypoxia over time in control- (n = 32) and B20-4.1.1–treated tumors (n = 90). Scale bars: 200 μm. Two-way ANOVA followed by Šidák’s multiple-comparison test. (C) Distribution of hypoxia values in individual tumors at the indicated time points, showing heterogeneous hypoxic responses to anti-VEGF treatment. Control (n = 28) or B20-4.1.1 at 6 weeks of treatment (n = 90), or Tend (n = 24). (D) Tumor growth and OS according to whether B20-4.1.1–treated tumors developed HH (n = 20 mice) or LH (n = 11 mice). Two-way ANOVA followed by Tukey’s multiple-comparison test. (E) Representative consecutive sections stained for pimonidazole and PD-L1, showing increased PD-L1 in hypoxic rims surrounding necrotic areas in HH tumors. Scale bars: 200 μm. (F) PD-L1 positivity in tumor cells and myeloid cells from vehicle-treated tumors (n = 5) and from LH or HH tumors after B20-4.1.1 (n = 5 each group). One-way ANOVA with Tukey’s post hoc test for multiple comparisons. Data are presented as mean ± SEM. *P < 0.05; **P < 0.01; ***P < 0.001; ****P < 0.0001. n, necrotic areas; r, rims.
We next asked whether antiangiogenic-induced hypoxia altered the immune context of the tumors. Compared with VT and LH tumors, HH tumors showed higher PD-L1 expression, particularly along the gradient from normoxic regions to hypoxic rims and necrotic areas at the humane endpoint (Tend; Figure 1E). Flow cytometry confirmed increased PD-L1 protein levels in tumor cells (CD45– fraction) and in the T cell–depleted CD45+ infiltrate (Figure 1F), together with increased PD-1 expression in CD8+, CD4+, and FOXP3+ Treg lymphocytes (Figure 2A).
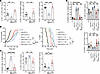 Figure 2
Hypoxic tumors remain refractory to PD-L1 blockade despite PD-1/PD-L1 upregulation. (A) PD-1 positivity in CD4+, CD8+, and Treg populations from vehicle-treated tumors and from LH or HH tumors after B20-4.1.1 (VT: n = 9; LH: n = 4; HH: n = 6). One-way ANOVA with Tukey’s post hoc test for multiple comparisons. (B) Tumor growth and OS after B20-4.1.1 plus anti–PD-L1, stratified according to LH (n = 7) and HH (n = 10) status. Log-rank (Mantel-Cox) test. (C) Percentage of CD4+, CD8+, and Treg lymphocytes among the CD45+ fraction of control (n = 9), HH (n = 13), or LH (n = 8) tumors. One-way ANOVA with Tukey’s post hoc test for multiple comparisons. (D) Lymphocyte composition in LH and HH tumors after addition of anti–PD-L1 (n = 4). One-way ANOVA with Tukey’s post hoc test for multiple comparisons. Data are presented as mean ± SEM. *P < 0.05; **P < 0.01; ***P < 0.001; ****P < 0.0001.
Because hypoxia and inflammatory signals may both regulate PD-L1 (16), we explored these possibilities further. Although IFN-γ transcripts were increased in LH and not in HH tumors after B20-4.1.1 (Supplemental Figure 1A; supplemental material available online with this article; https://doi.org/10.1172/JCI174092DS1), direct in vitro hypoxia exposure of BRL1468 or RAW264.7 cells did not clearly upregulate PD-L1, whereas IFN-γ did so in both cell lines (Supplemental Figure 1, B and C). In addition, immunohistochemistry showed greater T cell accumulation in normoxic than in hypoxic tumor regions (Supplemental Figure 2), arguing against a simple model in which hypoxia alone is sufficient to produce effective immune reinvigoration.
To determine whether PD-L1 upregulation was functionally relevant for resistance, we combined B20-4.1.1 with anti–PD-L1. In the overall unstratified cohort, the combination did not significantly improve survival over B20-4.1.1 alone (Figure 2B; median OS for vehicle, anti–PD-L1, B20-4.1.1, and combination groups were 5, 5, 10, and 11 weeks, respectively). However, stratification according to hypoxic response revealed a marked divergence: in LH tumors, adding anti–PD-L1 increased median OS from 10.0 to 11.74 weeks, whereas in HH tumors, it reduced median OS from 9.14 to 8.5 weeks (Figure 2B).
We then asked whether this hypoxia-dependent modulation of antiangiogenic plus anti–PD-L1 efficacy could also be detected in patients. The JAVELIN 101 trial (17, 18) compared standard therapy with the antiangiogenic sunitinib against a combination of axitinib (antiangiogenic) and avelumab (anti–PD-L1) in kidney cancer. In the gene expression data of this study, using a hypoxia gene expression signature defined from baseline biopsies (Supplemental Figure 3A), patients classified as LH had longer median progression-free survival (PFS) than HH patients in the combination arm (13.1 vs. 11.1 months; Supplemental Figure 3B). In the IMbrave trial (antiangiogenic and sorafenib versus combination bevacizumab plus atezolizumab treatment in liver cancer) (19, 20), LH patients also showed numerically longer OS than HH patients, although without statistical significance (Supplemental Figure 3, C and D). Concordance between the hypoxia signature and pimonidazole-based classification of hypoxia is discussed in Supplemental Figure 3, E and F. In addition, in our own breast cancer trial combining bevacizumab with durvalumab, benefit from durvalumab was restricted to patients in whom bevacizumab had corrected hypoxia (10).
To further explore the role of antiangiogenic-induced hypoxia, we conducted a dose-response experiment with 0.5-fold, standard, and 2-fold doses of B20-4.1.1, seeking to increase tumor hypoxia by intensifying the pro/antiangiogenic factor imbalance (1). The highest dose produced the weakest antitumor effect, whereas the lowest dose produced the strongest one (Supplemental Figure 4A). Increasing dose also increased both the magnitude of hypoxia and interanimal variability (Supplemental Figure 4B), reduced CD4+ infiltration, increased Treg representation, and raised PD-1 levels in tumor-infiltrating lymphocytes (Supplemental Figure 4, C and D). Consistently, adding anti–PD-L1 improved OS only in the 0.5-fold group (Supplemental Figure 4E).
Together, these data indicate that the direction of the antiangiogenic response — toward hypoxia correction or toward hypoxia aggravation — shapes the immune infiltrate and determines the efficacy of subsequent anti–PD-L1 treatment. They also suggest that PD-L1 upregulation is not, by itself, sufficient to explain resistance in HH tumors, prompting us to analyze the immune infiltrate in greater depth.
Tumors that develop hypoxia in response to antiangiogenics display myeloid inflammation features and are infiltrated by protumor macrophages. Compared with LH tumors, HH tumors contained fewer CD4+ and CD8+ lymphocytes and more FOXP3+ Tregs (Figure 2C and Supplemental Figure 2A). Tumor hypoxia correlated inversely with CD4+/CD8+ infiltration and directly with Treg abundance (Supplemental Figure 5, A–C). Consistent with its lack of therapeutic efficacy in HH tumors, anti–PD-L1 did not significantly modify the lymphoid infiltrate (Figure 2D), nor did it reinvigorate CD4+, CD8+, or Treg populations according to PD-1 levels (Supplemental Figure 2B). Instead, in HH tumors, anti–PD-L1 was associated with an adverse cytokine profile, with a trend toward lower IFN-γ and higher TGF-β compared with B20-4.1.1 alone (Supplemental Figure 2C)
To further characterize the functional differences between LH and HH tumors, we profiled gene expression in sorted epithelial and CD45+ tumor compartments (Figure 3A; Gene Expression Omnibus [GEO], GSE241539). Most transcriptional differences were found in the CD45+ fraction, whereas epithelial cells showed comparatively limited changes (Figure 3A and Supplemental Figure 6). In HH leukocytes, GSEA showed enrichment of inflammatory and myeloid activation programs together with reduced lymphocyte activation, increased CD8 exhaustion, and enhanced Treg activity (Figure 3, B and C). Flow cytometry confirmed a >2-fold increase in total macrophages in HH tumors (Figure 3D), which positively correlated with hypoxia (Supplemental Figure 7A). Using CD206 and MHCII (21) to define macrophage states, HH tumors were enriched in M2-like and depleted in M1-like macrophages relative to LH tumors (Figure 3E), and these populations correlated directly and inversely with hypoxia, respectively (Supplemental Figure 7B). Consistently, an M2 macrophage signature was enriched in the CD45+ compartment of HH tumors (Figure 3F).
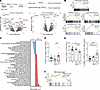 Figure 3
HH Tumors display a macrophage-rich, tumor-tolerant immune compartment. (A) Experimental scheme for bulk RNA-seq of sorted EPCAM−CD45+ immune cells and EPCAM+CD45− tumor cells from LH and HH tumors and volcano plots of differentially expressed transcripts in each compartment. (B) Selected GSEA plots enriched in the CD45+ immune compartment of HH versus LH tumors. (C) Global pathway analysis of the CD45+ immune compartment comparing HH and LH tumors. (D) Percentage of macrophages within the CD45+ fraction in LH (n = 9) and HH (n = 10) tumors. One-way ANOVA with Tukey’s post hoc test for multiple comparisons. (E) Frequency of M1 and M2 macrophages in LH (n = 7) and HH (n = 9) tumors. One-way ANOVA with Tukey’s post hoc test for multiple comparisons. (F) M2-related GSEA in the immune compartment of HH versus LH tumors. Data are presented as mean ± SEM. *P < 0.05; **P < 0.01. ES, enrichment score; NES, normalized enrichment score.
Macrophage depletion reverses HH-associated immune suppression, and HH-derived tumor-associated macrophages impair T cell effector function. Given the known role of M2 macrophages in tumor progression and immunosuppression (22, 23), the enrichment of M2-like tumor-associated macrophages (TAMs) in HH tumors suggests that these cells might actively sustain the immunosuppressive phenotype in our model. We therefore depleted macrophages with an anti-CSF1R antibody before initiating antiangiogenic treatment (Figure 4A). Anti-CSF1R effectively reduced tumor macrophages (Supplemental Figure 8) and improved tumor control and OS (Figure 4A). Importantly, anti-CSF1R–treated tumors were no longer stratified into HH and LH because they failed to develop antiangiogenic-induced hypoxia under subsequent B20-4.1.1 treatment (Figure 4B). Compared with HH tumors, tumors treated with anti-CSF1R plus B20-4.1.1 showed increased CD4+ and CD8+ infiltration, reduced Tregs, lower PD-1 expression in lymphocyte subsets, and a more favorable cytokine profile, with lower immunosuppressive cytokines and increased IFN-γ (Supplemental Figure 9, A–C).
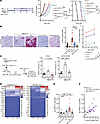 Figure 4
TAM depletion suppresses late hypoxia and angiogenic compensation and restores lymphocyte function. (A) Treatment scheme and effects of control (n = 36), anti-CSF1R (n = 5), B20-4.1.1 (n = 31), or the combination (n = 13) on tumor growth and OS. Two-way ANOVA followed by Tukey’s multiple-comparison test. (B) Representative hypoxia staining (scale bars: 200 μm) and quantification of hypoxia in tumors treated with vehicle (n = 28), LH (n = 40) and HH (n = 50) B20-4.1.1, anti-CSF1R (n = 5), and combination (n = 15), including late time points under continued therapy. One-way ANOVA with Tukey’s post hoc test for multiple comparisons. Right panel: average hypoxic levels of tumors treated with B20-4.1.1 anti-CSF1R or combination in final time points (B20: 6 wk n = 63, Tend n = 24; B20+aCSF1R: 6 wk n = 15, Tend n = 5). Two-way ANOVA followed by Šidák’s multiple-comparison test. (C) Cytotoxic activity of tumor-derived CD45+ cells from control (n = 10), LH (n = 7), and HH (n = 10) tumors against BRL1468 cells. One-way ANOVA with Tukey’s post hoc test for multiple comparisons. (D) Expression of selected angiogenesis-related transcripts in tumor and immune compartments across the indicated treatment groups. (E) VEGFA protein levels in tumors treated with vehicle (n = 5), LH (n = 10), HH (n = 13), anti-CSF1R (n = 4), and combination (n = 11). One-way ANOVA with Tukey’s post hoc test for multiple comparisons. (F) Correlation between VEGFA levels and tumor hypoxia in same tumors treated with B20-4.1.1 alone or in combination with anti-CSF1R. Data are presented as mean ± SEM. *P < 0.05; **P < 0.01; ***P < 0.001; ****P < 0.0001.
To determine whether the immune infiltrate of HH tumors was also functionally impaired, we performed an in vitro cytotoxicity assay using CD45+ cells isolated from tumors treated with B20-4.1.1 for 6 weeks (Figure 4C). Lymphocytes from HH tumors displayed reduced cytotoxic activity compared with those from LH tumors, both at baseline and after CD3/CD28 stimulation. We next asked whether TAMs from HH tumors were sufficient to impose this tolerant phenotype. TAMs isolated from vehicle-, LH-, or HH-derived tumors were cocultured with naive WT splenocytes according to the scheme shown in Supplemental Figure 9D. HH-derived TAMs promoted Treg differentiation and reduced IFN-γ production by both CD4+ and CD8+ cells (Supplemental Figure 9E). They also decreased the proliferative fraction of CD4+ and CD8+ lymphocytes, as measured by Ki67 (Supplemental Figure 9F). Consistently, supernatants from these cocultures showed increased CCL5 and TNF-α when macrophages were derived from HH tumors (Supplemental Figure 9G).
Together, these data indicate that TAMs are not merely associated with HH tumors, but functionally contribute to the tolerant immune microenvironment that emerges under hypoxia-inducing antiangiogenic treatment. The observation that macrophage depletion also prevents the subsequent development of hypoxia suggests that TAMs are part of a feed-forward loop rather than a terminal downstream consequence, prompting us to search for an earlier event upstream of macrophage recruitment.
Osteopontin (SPP1) initiates macrophage recruitment and immunoregulatory polarization in response to antiangiogenic treatment. A classical model of antiangiogenic resistance proposes that anti-VEGF treatment increases hypoxia, which in turn induces VEGFA and attracts monocytes/macrophages, thereby sustaining an angiogenic/inflammatory/necrotic cycle (24, 25). Our data are consistent with parts of this framework but also reveal an important paradox. On the one hand, HH tumors showed increased VEGFA transcription and protein levels in both epithelial and immune compartments at late treatment time points, and VEGF-related GSEAs were enriched, particularly in the immune compartment (Figure 4, D–F, and Supplemental Figure 10). On the other hand, although macrophage depletion decreased the amount of VEGF (Figure 4, E and F) — in accordance with the classic model — it also abolished the subsequent development of hypoxia despite continued antiangiogenic treatment (Figure 4, B and F), implying that macrophages are not merely a downstream consequence of hypoxia but part of a feed-forward loop required to sustain it. This raised 2 questions: what event precedes macrophage accumulation in HH tumors, and what promotes monocyte differentiation toward an M2-like state in this context?
To address these issues, we combined scRNA-seq with time-course analyses. We profiled 17,651 cells from 16 tumors (6 vehicle, 5 LH, and 5 HH). The pimonidazole-based hypoxia measurements correlated strongly with a hypoxia gene set score derived from the single-cell data, supporting the validity of our hypoxia classification method (Supplemental Figure 11A). UMAP visualization identified 18 major cell clusters (Figure 5A and Supplemental Figure 11B), and the overall lineage analysis revealed an inverse balance between tumor and immune cells in HH versus LH tumors, with higher macrophage abundance and lower CD4+/CD8+ representation in HH tumors (Figure 5B), in agreement with the flow cytometry results. The gene expression profiles presented in Supplemental Figure 11C highlight the up- and downregulated genes that distinguish each cluster.
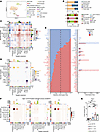 Figure 5
Single-cell analysis identifies SPP1-centered epithelial-to-myeloid communication in HH tumors. (A) UMAP representation of the major tumor and immune cell populations identified by scRNA-seq. (B) Relative distribution of nonimmune and immune cell populations across treatment groups. (C) Heatmap of the number of inferred cell-cell interactions in HH versus LH tumors. (D) Heatmap of interaction strength across cell populations in HH versus LH tumors. (E) Signaling flow analysis highlighting pathways enriched in HH or LH tumors. Blue or red coloring of pathways indicates a significant difference between HH and LH (Wilcoxon’s test, P < 0.05; gray, nonsignificant). (F) SPP1-mediated interaction strength across sender and receiver cell populations in vehicle-treated tumors and in LH or HH tumors after B20-4.1.1. (G) Transcriptional Spp1 levels in tumors treated with VT (n = 6), anti-CSF1R (n = 5), LH (n = 10) or HH (n = 9) B20-4.1.1, and anti-CSF1R+B20-4.1.1 (n = 5). Experiment was performed in triplicate. One-way ANOVA with Tukey’s post hoc test for multiple comparisons. Data are presented as mean ± SEM. **P < 0.01.
We then subclustered the macrophage compartment and identified 6 TAM states (TAM0–TAM5; Supplemental Figure 12, A and B). Their gene expression profiles and pathway signatures were consistent with M1-like features in TAM0/TAM1, M2-like features in TAM3/TAM4, and more tissue-resident characteristics in TAM2/TAM5 (Supplemental Figure 12, A and C). HH tumors were enriched in TAM3 within a generally expanded macrophage compartment (Supplemental Figure 12D and Figure 5B). To specifically determine which TAM subsets expressed the highest Spp1 levels, we profiled Spp1 across TAM states and found TAM2 and TAM3 to be the Spp1-high subsets (Supplemental Figure 12E). Although these subsets are not proposed as the sole drivers of immune escape, they showed relative enrichment of immunoregulatory/checkpoint-associated genes (Cd274, Pdcd1lg2, Vsir, Cd276, Lgals9, and Entpd1) together with hypoxia/metabolic and microenvironment-shaping features (Hif1a, Ldha, Vegfa, Tgfb1, and Lgals3) (Supplemental Figure 12, F and G), supporting their role as myeloid amplifiers of the HH-associated immunosuppressive program. Together, these data point to a more immunosuppressed environment in HH tumors, dominated by different TAM variants with protumor and proangiogenic traits.
To determine how these cell populations interact, we performed CellChat analysis (26). HH tumors showed stronger epithelial→epithelial and epithelial→macrophage communication, whereas LH tumors retained stronger epithelial→CD8, CD4→CD8, and CD8→CD8 interactions (Figure 5, C and D). When we analyzed signaling flow across pathways, 3 major pathways stood out: collagen, MHCI, and SPP1, with Spp1 showing the strongest differential increase in HH tumors (Figure 5E). Mapping the SPP1 pathway across sender and receiver populations confirmed that the dominant SPP1 communication in HH tumors occurred from epithelial cells to epithelial cells and, most prominently, from epithelial cells to macrophages (Figure 5F). These findings pointed to epithelial SPP1 secretion as a candidate initiating signal upstream of macrophage accumulation.
Because the earliest measurable consequence of anti-VEGF treatment is vascular pruning and perfusion loss (24, 25), we hypothesized that hypoxia itself might trigger epithelial SPP1 upregulation. An alternative hypothesis was considering compensatory VEGF secretion, which occurs in response to VEGF-clearing therapeutics (27), the initiating event. In multiple human breast cancer cell lines and in murine BRL1468 cells, hypoxia consistently induced Spp1 mRNA, whereas VEGF alone did not (Supplemental Figure 13A). Conserved HIF1α-binding motifs were identified in both murine and human Spp1 promoters (Supplemental Figure 13B), supporting a direct link between hypoxic stress and SPP1 induction.
We next explored the in vivo relevance of these findings. There are 5 known Spp1 isoforms that have been involved in several tumor progression features (28–32); transcript-level analysis showed upregulation of multiple annotated Spp1 splice variants in HH tumors (Supplemental Figure 14A). Importantly, these transcript-level data do not distinguish between extracellular/secreted and intracellular SPP1 protein pools. Secreted forms are pleiotropic (33) (OPNa and c are proangiogenic, and OPNa, b, and c attract monocytes), whereas intracellular isoforms can influence cell-intrinsic programs (34–36). Because the functional experiments below interrogate ligand-receptor communication, recombinant SPP1 activity, and antibody-mediated neutralization, the mechanistic conclusions of the present work primarily concern the extracellular SPP1 pool. HH tumors also displayed increased expression of integrin isoforms compatible with SPP1 signaling, including αVβ3 (proangiogenic) (37) and α9β1, which is a ligand of SPP1 and is implicated in wound-healing, angiogenesis, and cellular migration (38) (Supplemental Figure 14B). If extracellular SPP1 was hierarchically upstream of macrophage recruitment, one would expect that blocking macrophages would not eliminate SPP1 itself. Consistent with this, Spp1 transcript levels were higher in HH than in LH tumors, and macrophage depletion — alone or combined with B20-4.1.1 — did not reduce Spp1 levels (Figure 5G), supporting the interpretation that SPP1 elevation precedes macrophage accumulation. Recombinant SPP1 acted as a potent monocyte chemoattractant, stronger than VEGF in our assay (Figure 6A), and induced M2-associated transcriptional features in macrophages (Figure 6B). In addition, Spp1 levels increased in parallel with antiangiogenic dose and hypoxia severity (Supplemental Figure 4B). To understand how extracellular SPP1 reprograms macrophages, we stimulated RAW264.7 cells with recombinant osteopontin under low-serum/BSA conditions and examined early signaling events downstream of its canonical receptors. SPP1 induced STAT3 phosphorylation after 5 minutes and NF-κB/p65 phosphorylation after 15 minutes, and both responses were attenuated by inhibition of CD44 or integrin β3 (Figure 6, C and D). We next asked whether this receptor-linked signaling was associated with an immunoregulatory output relevant to checkpoint refractoriness. Under the same low-serum conditions, recombinant SPP1 increased Cd274/PD-L1 expression in macrophages after 24 hours, and this induction was reduced by CD44 or integrin β3 inhibition (Figure 6E). Together with the migration data and the M2-related transcriptional changes induced by extracellular SPP1, these data delineate a minimal CD44/integrin β3–dependent signaling axis involving STAT3 and NF-κB/p65 activation, accompanied by PD-L1 induction, consistent with SPP1-driven immunoregulatory macrophage reprogramming. Thus, the former data support a revised model in which antiangiogenic-induced hypoxia first triggers epithelial SPP1 secretion; extracellular SPP1 then recruits monocytes, promotes immunoregulatory macrophage polarization, and amplifies a feed-forward loop involving VEGF, hypoxia, and immune suppression.
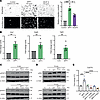 Figure 6
Extracellular osteopontin reprograms macrophages through CD44/integrin B3-linked signaling. (A) Transwell migration of macrophages in response to vehicle, recombinant SPP1, or VEGF-A. Scale bars: 200 μm. Right: quantitation chart. Experiment involved analyzing 10 images for each condition across 3 independent experiments (total 30 images per condition). One-way ANOVA with Tukey’s post hoc test for multiple comparisons. (B) Expression of M2-related transcripts in macrophages after exposure to recombinant SPP1 (n = 4). One-way ANOVA with Tukey’s post hoc test for multiple comparisons. (C) Representative images of immunoblots showing phosphorylation of STAT3 in response to stimulation (5 minutes) with SPP1 (5 μg/mL) or vehicle (VT) in RAW264.7 cells, in presence or absence of a CD44 inhibitor (anti-mouse/human CD44 IM7 antibody, 10 μg/mL; upper panel) or an ITGβ3 inhibitor (ITGB3-IN-1, 5 μM; lower panel) (n = 3). (D) Same as in C showing the effect of p65 phosphorylation in response to SPP1 (15 minutes) (n = 3). (E) PD-L1 regulation in RAW264.7 cells in the same conditions as C and D (n = 4). One-way ANOVA with Tukey’s post hoc test for multiple comparisons. Data are presented as mean ± SEM. *P < 0.05; **P < 0.01; ***P < 0.001; ****P < 0.0001.
Depleting extracellular SPP1 reverses HH-associated immunosuppression and restores sensitivity to PD-L1 blockade. We next examined whether neutralizing extracellular SPP1 could reverse the immunosuppressive phenotype induced by hypoxia-promoting antiangiogenic treatment. Anti-SPP1 therapy prevented the development of treatment-induced hypoxia (Supplemental Figure 15A) and reverted the immune changes induced by B20-4.1.1, restoring CD8+ cells and reducing Tregs (Supplemental Figure 15B), while decreasing myeloid cells, macrophages, and myeloid-derived suppressor cells (Figure 7A). Importantly, M1 macrophages were preserved whereas M2 macrophages were reduced (Figure 7B), and PD-1 levels in lymphocyte subsets also decreased (Supplemental Figure 15C). Anti-SPP1 monotherapy had no antitumor effect, but its combination with B20-4.1.1 significantly prolonged median OS (Supplemental Figure 15D). Together, these data again support the interpretation that SPP1 lies upstream of macrophage recruitment and polarization in this setting.
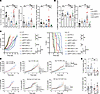 Figure 7
Systemic osteopontin blockade restores immune control, and tumor cells are the predominant source of SPP1. (A) Myeloid cells, macrophages, and myeloid-derived suppressor cells in tumors from the indicated treatment groups (VT: n = 11; anti-SPP1: n = 4; B20 LH: n = 9; B20 HH: n = 10). One-way ANOVA with Tukey’s post hoc test for multiple comparisons. (B) M1 and M2 macrophage fractions across the same treatment groups. (VT: n = 11; anti-SPP1: n = 4; B20 LH: n = 9; B20 HH: n = 10). One-way ANOVA with Tukey’s post hoc test for multiple comparisons. (C) Tumor growth and OS after anti–PD-L1, anti-SPP1, B20-4.1.1, or their combinations. Controls (n = 36); anti–PD-L1 (n = 23); anti-SPP1 (n = 5); anti-SPP1 + anti–PD-L1 (n = 6); HH (n = 20); LH (n = 10); B20-4.1.1+anti-SPP1 (n = 8); B20-4.1.1 + anti-SPP1 + anti–PD-L1 (n = 7). Two-way ANOVA followed by Tukey’s multiple-comparison test. (D) Phenotypic consequences of tumor cell versus myeloid SPP1 depletion, showing a predominant contribution of the tumor-epithelial compartment (n = 7–21 mice per group). Two-way ANOVA followed by Tukey’s multiple-comparison test. (E) Hypoxia development (in VT- or B20-4.1.1–treated tumors) is partially corrected in the epithelial KO model (n = 5–7) but not in the BM model (n = 9–19). One-way ANOVA with Tukey’s post hoc test for multiple comparisons. Data are presented as mean ± SEM. *P < 0.05; **P < 0.01; ***P < 0.001; ****P < 0.0001.
We then asked how SPP1 contributes to resistance to anti–PD-L1 therapy. Transcriptomic analyses of the CD45+ compartment suggested impaired lymphocyte costimulation in HH tumors (Supplemental Figure 16A), and CellChat analysis of the CD86/CD28 and CD86/CTLA4 pathways supported weaker costimulatory interactions during antigen presentation in HH versus LH tumors (Supplemental Figure 16A). Expression of CD80, CD86, CD40, and CTLA4 was consistent with this pattern (Supplemental Figure 16B), providing a plausible explanation for the lack of benefit from PD-L1 blockade despite PD-1/PD-L1 upregulation.
To complement these in vivo findings, we exposed tumor-epithelial cells (BRL1468) and macrophages (RAW264.7) to recombinant SPP1 ex vivo. SPP1 was a stronger inducer of PD-L1 than hypoxia in both cell types (Supplemental Figure 17). In BRL1468 cells, SPP1 induced modest but coherent shifts in antigen presentation/costimulatory markers together with increased IL6 and TGF-β, consistent with a tolerogenic tilt (Supplemental Figure 18A). In RAW264.7 cells, SPP1 promoted an M2-skewed program (Figure 6B and Supplemental Figure 18B). Moreover, macrophages primed with SPP1 induced a broad immunosuppressive transcriptional program in cocultured naive splenocytes, despite only minor phenotypic changes by flow cytometry (Supplemental Figure 18, C–G). These findings support a mechanism whereby tumor-derived SPP1 conditions antigen presentation and costimulation, attracts and reprograms macrophages toward immunoregulatory states, and dampens T cell effector function.
Consistent with this model, SPP1 depletion restored costimulation-associated transcripts (Supplemental Figure 16B), recovered tumor lymphocyte cytotoxicity (Supplemental Figure 19), and, when added to B20-4.1.1 plus anti–PD-L1, induced tumor regression during the first 6 weeks and increased median survival by more than 50% compared with HH tumors (Figure 7C). These therapeutic results were reproduced in the 4T1 model (Supplemental Figure 20), and analysis of the JAVELIN 101 and IMbrave 150 cohorts showed higher SPP1 levels in hypoxic tumors with poorer outcome to antiangiogenic plus anti–PD-L1 combinations (Supplemental Figure 21).
Predominantly tumor-epithelial origin of SPP1. Previous studies have highlighted immunosuppressive functions of myeloid-derived SPP1 (39–41). In contrast, in our antiangiogenic resistance model, the data indicate a predominantly tumor-epithelial source. To address this, we used 2 complementary genetic strategies: epithelial SPP1 deletion in BRL1468 tumor cells (BRL-KO) implanted into WT FVB recipients and bone marrow chimeras generated by reconstituting lethally irradiated FVB-MMTV-PyMT mice with WT or germline Spp1-KO marrow (Supplemental Figure 22A). BRL-KO tumors displayed markedly lower SPP1 levels than spontaneous PyMT tumors and tumors growing in BM-KO mice, supporting a predominant epithelial origin (Supplemental Figure 22B). B20-4.1.1 increased SPP1 in BRL-WT tumors but only modestly in BRL-KO grafts, consistent with residual epithelial production, whereas BM-KO tumors showed no reduction in SPP1 induction, arguing against a major myeloid source (Supplemental Figure 22B).
Functionally, epithelial SPP1 deletion modestly delayed tumor growth and sensitized tumors to anti–PD-L1, whereas myeloid deletion had minimal effects (Figure 7D). Although B20-4.1.1 showed limited activity in these graft and chimera settings, epithelial SPP1 loss reduced hypoxia under vehicle and antiangiogenic treatment, while myeloid deletion did not (Figure 7E). In parallel, BRL-KO tumors showed increased CD8 T cells, reduced Tregs, and lower macrophage, myeloid-derived suppressor cell, and M2 macrophage infiltration, whereas these changes were not evident in BM-KO tumors (Supplemental Figure 22, C and D). Together, these findings indicate that, in this context, SPP1 is predominantly epithelial in origin. Therapeutically, however, the strongest benefit is achieved by systemic anti-SPP1 antibody treatment, which neutralizes SPP1 regardless of its cellular source, whereas selective epithelial or myeloid deletions provide only modest benefit.
Sequence of events: time course of SPP1, hypoxia, macrophages, and clinical adaptation to antiangiogenic monotherapy. To define the sequence of events linking antiangiogenic treatment to hypoxia and immunosuppression, we combined murine time-course studies with a clinical run-in analysis. In mice, hypoxia remained low during isotype treatment and increased only gradually under B20-4.1.1, reaching substantial levels at later time points (Figure 1B). By contrast, SPP1 was induced rapidly, already after 1 week of treatment (Figure 8A), whereas macrophage accumulation occurred later, mainly between weeks 4 and 6 (Figure 8B). VEGFA upregulation also appeared at later time points (Figure 8C). In parallel, HIF1α progressively accumulated after B20-4.1.1 treatment (Figure 8D), supporting a model in which early hypoxic stress triggers Spp1, followed by macrophage recruitment and later reinforcement of the hypoxic/VEGF state.
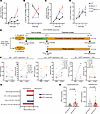 Figure 8
Time-course and clinical run-in analyses to support an osteopontin-centered adaptive program under antiangiogenic pressure. (A) Tumor SPP1 transcript levels during the first 6 weeks of anti-VEGF treatment (T0: n = 5; T1: VT n = 3, B20 n = 3; T3: VT n = 10, B20 n = 9; T6: VT n = 6, B20 LH n = 8, and B20 HH n = 11). (B) Macrophage abundance over the same time window (T3: VT n = 5, B20 n = 7; T6: VT n = 10, B20 LH n = 11 and B20 HH n = 15). (C) Transcriptional levels of VEGFA along the first 6 weeks of isotype or anti-VEGF treatment (T0: n = 5; T1: VT n = 3, B20 n = 3; T3: VT n = 10, B20 n = 9; T6: VT n = 3, B20 LH n = 4, and B20 HH n = 6). (D) Evolution of HIF1α staining during treatment (T0: n = 5; T1: VT n = 3, B20 n = 3; T3: VT n = 6, B20 n = 6; T6: VT n = 5, B20 LH n = 6, and B20 HH n = 6). (E) Design of the NCT01484080 clinical trial, including baseline and post–run-in sampling in the nintedanib-containing arm. (F) Individual changes in SPP1 expression and hypoxia score during the nintedanib run-in phase. (G) GSEA plots comparing pre– and post–run-in samples according to baseline SPP1 levels. (H) Baseline SPP1 levels according to pathological complete response category (Symmans 0/1 versus 2/3) in the nintedanib-containing arm (experimental arm) and in the paclitaxel-alone arm of clinical trial NCT01484080. Experimental arm: Symmans 0/1: N = 5; average SPP1 = 42.3; Symmans 2/3: N = 19; average SPP1: 119.9; P = 0.35. Standard arm: Symmans 0/1: N = 3; average SPP1 = 142.2; Symmans 2/3: N = 33; average SPP1 = 127.9; P = 0.74).
We next examined whether this sequence was recapitulated clinically in a randomized trial of early HER2– breast cancer in which patients received a 2-week run-in of single-agent nintedanib before paclitaxel, compared with paclitaxel alone (ClinicalTrials.gov NCT01484080; Figure 8E). In the experimental arm, changes in SPP1 during the run-in phase were associated with concordant changes in hypoxia: patients in the lowest quartile of SPP1 change showed decreased hypoxia, whereas those in the highest quartiles showed increased hypoxia (Figure 8F). Baseline-high SPP1 tumors also developed a more immunosuppressive program during antiangiogenic exposure, with enrichment of M2-like macrophage, Treg, and PD-1+ CD8 signatures (Figure 8G). Finally, baseline SPP1 tended to be higher in tumors with less favorable pathological response in the nintedanib-containing arm, whereas this pattern was not observed in the paclitaxel-alone arm, although the study was not powered for formal treatment-interaction testing (Figure 8H).
Together, the murine and clinical data support a model in which antiangiogenic therapy that exacerbates hypoxia induces epithelial SPP1, which precedes macrophage accumulation and is followed by VEGF upregulation, deepening hypoxia, immune suppression, and refractoriness to PD-L1 blockade. This self-reinforcing hypoxia/SPP1/myeloid circuit is summarized in Figure 9.
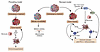 Figure 9
Proposed model of resistance to hypoxia-inducing antiangiogenics. Schematic representation of the proposed mechanism whereby antiangiogenic treatment that exacerbates hypoxia induces epithelial SPP1, promotes monocyte recruitment and macrophage immunoregulatory polarization, reinforces VEGF-driven hypoxic adaptation, and culminates in refractoriness to anti–PD-L1 therapy. The model also highlights the therapeutic points of intervention identified in this study, including CSF1R and Spp1 blockade.


Copyright © 2026 American Society for Clinical Investigation
ISSN: 0021-9738 (print), 1558-8238 (online)