
Advertisement
Research ArticleGeneticsOncology
Open Access |  10.1172/JCI205415
HIF-1–mediated PPME1 expression promotes breast cancer progression via AKT activation and β-catenin recruitment
Yajing Lyu,1,2 Varen Talwar,3 Yongkang Yang,1,4 Si-Sim Kang,3 Shuyi Li,1 Shaima Salman,1,4 Daiana Drehmer,1,2 Yufeng Wang,1,2 Chelsey Chen,1 Vijay Ramu,3 Sujin Kim,3 Dylan Park,3 Tina Yi-Ting Huang,1,2 Emmanuel Datan,1,2 Dominic Dordai,1,2 Jonathan P. Schneck,1,4 and Gregg L. Semenza1,2,4
1Institute for Cell Engineering and
2Department of Genetic Medicine, Johns Hopkins University School of Medicine, Baltimore, Maryland, USA.
3Johns Hopkins University, Baltimore, Maryland, USA.
4Sidney Kimmel Comprehensive Cancer Center at Johns Hopkins, Baltimore, Maryland, USA.
Address correspondence to: Gregg L. Semenza, Johns Hopkins University School of Medicine, Miller Research Building, Suite 671, 733 N. Broadway, Baltimore, Maryland 21205, USA. Email: gsemenza@jhmi.edu.
Find articles by Lyu, Y. in: PubMed | Google Scholar
1Institute for Cell Engineering and
2Department of Genetic Medicine, Johns Hopkins University School of Medicine, Baltimore, Maryland, USA.
3Johns Hopkins University, Baltimore, Maryland, USA.
4Sidney Kimmel Comprehensive Cancer Center at Johns Hopkins, Baltimore, Maryland, USA.
Address correspondence to: Gregg L. Semenza, Johns Hopkins University School of Medicine, Miller Research Building, Suite 671, 733 N. Broadway, Baltimore, Maryland 21205, USA. Email: gsemenza@jhmi.edu.
Find articles by Talwar, V. in: PubMed | Google Scholar
1Institute for Cell Engineering and
2Department of Genetic Medicine, Johns Hopkins University School of Medicine, Baltimore, Maryland, USA.
3Johns Hopkins University, Baltimore, Maryland, USA.
4Sidney Kimmel Comprehensive Cancer Center at Johns Hopkins, Baltimore, Maryland, USA.
Address correspondence to: Gregg L. Semenza, Johns Hopkins University School of Medicine, Miller Research Building, Suite 671, 733 N. Broadway, Baltimore, Maryland 21205, USA. Email: gsemenza@jhmi.edu.
Find articles by Yang, Y. in: PubMed | Google Scholar
1Institute for Cell Engineering and
2Department of Genetic Medicine, Johns Hopkins University School of Medicine, Baltimore, Maryland, USA.
3Johns Hopkins University, Baltimore, Maryland, USA.
4Sidney Kimmel Comprehensive Cancer Center at Johns Hopkins, Baltimore, Maryland, USA.
Address correspondence to: Gregg L. Semenza, Johns Hopkins University School of Medicine, Miller Research Building, Suite 671, 733 N. Broadway, Baltimore, Maryland 21205, USA. Email: gsemenza@jhmi.edu.
Find articles by Kang, S. in: PubMed | Google Scholar
1Institute for Cell Engineering and
2Department of Genetic Medicine, Johns Hopkins University School of Medicine, Baltimore, Maryland, USA.
3Johns Hopkins University, Baltimore, Maryland, USA.
4Sidney Kimmel Comprehensive Cancer Center at Johns Hopkins, Baltimore, Maryland, USA.
Address correspondence to: Gregg L. Semenza, Johns Hopkins University School of Medicine, Miller Research Building, Suite 671, 733 N. Broadway, Baltimore, Maryland 21205, USA. Email: gsemenza@jhmi.edu.
Find articles by Li, S. in: PubMed | Google Scholar
1Institute for Cell Engineering and
2Department of Genetic Medicine, Johns Hopkins University School of Medicine, Baltimore, Maryland, USA.
3Johns Hopkins University, Baltimore, Maryland, USA.
4Sidney Kimmel Comprehensive Cancer Center at Johns Hopkins, Baltimore, Maryland, USA.
Address correspondence to: Gregg L. Semenza, Johns Hopkins University School of Medicine, Miller Research Building, Suite 671, 733 N. Broadway, Baltimore, Maryland 21205, USA. Email: gsemenza@jhmi.edu.
Find articles by
Salman, S.
in:
PubMed
|
Google Scholar
|

1Institute for Cell Engineering and
2Department of Genetic Medicine, Johns Hopkins University School of Medicine, Baltimore, Maryland, USA.
3Johns Hopkins University, Baltimore, Maryland, USA.
4Sidney Kimmel Comprehensive Cancer Center at Johns Hopkins, Baltimore, Maryland, USA.
Address correspondence to: Gregg L. Semenza, Johns Hopkins University School of Medicine, Miller Research Building, Suite 671, 733 N. Broadway, Baltimore, Maryland 21205, USA. Email: gsemenza@jhmi.edu.
Find articles by Drehmer, D. in: PubMed | Google Scholar
1Institute for Cell Engineering and
2Department of Genetic Medicine, Johns Hopkins University School of Medicine, Baltimore, Maryland, USA.
3Johns Hopkins University, Baltimore, Maryland, USA.
4Sidney Kimmel Comprehensive Cancer Center at Johns Hopkins, Baltimore, Maryland, USA.
Address correspondence to: Gregg L. Semenza, Johns Hopkins University School of Medicine, Miller Research Building, Suite 671, 733 N. Broadway, Baltimore, Maryland 21205, USA. Email: gsemenza@jhmi.edu.
Find articles by Wang, Y. in: PubMed | Google Scholar
1Institute for Cell Engineering and
2Department of Genetic Medicine, Johns Hopkins University School of Medicine, Baltimore, Maryland, USA.
3Johns Hopkins University, Baltimore, Maryland, USA.
4Sidney Kimmel Comprehensive Cancer Center at Johns Hopkins, Baltimore, Maryland, USA.
Address correspondence to: Gregg L. Semenza, Johns Hopkins University School of Medicine, Miller Research Building, Suite 671, 733 N. Broadway, Baltimore, Maryland 21205, USA. Email: gsemenza@jhmi.edu.
Find articles by Chen, C. in: PubMed | Google Scholar
1Institute for Cell Engineering and
2Department of Genetic Medicine, Johns Hopkins University School of Medicine, Baltimore, Maryland, USA.
3Johns Hopkins University, Baltimore, Maryland, USA.
4Sidney Kimmel Comprehensive Cancer Center at Johns Hopkins, Baltimore, Maryland, USA.
Address correspondence to: Gregg L. Semenza, Johns Hopkins University School of Medicine, Miller Research Building, Suite 671, 733 N. Broadway, Baltimore, Maryland 21205, USA. Email: gsemenza@jhmi.edu.
Find articles by Ramu, V. in: PubMed | Google Scholar
1Institute for Cell Engineering and
2Department of Genetic Medicine, Johns Hopkins University School of Medicine, Baltimore, Maryland, USA.
3Johns Hopkins University, Baltimore, Maryland, USA.
4Sidney Kimmel Comprehensive Cancer Center at Johns Hopkins, Baltimore, Maryland, USA.
Address correspondence to: Gregg L. Semenza, Johns Hopkins University School of Medicine, Miller Research Building, Suite 671, 733 N. Broadway, Baltimore, Maryland 21205, USA. Email: gsemenza@jhmi.edu.
Find articles by Kim, S. in: PubMed | Google Scholar
1Institute for Cell Engineering and
2Department of Genetic Medicine, Johns Hopkins University School of Medicine, Baltimore, Maryland, USA.
3Johns Hopkins University, Baltimore, Maryland, USA.
4Sidney Kimmel Comprehensive Cancer Center at Johns Hopkins, Baltimore, Maryland, USA.
Address correspondence to: Gregg L. Semenza, Johns Hopkins University School of Medicine, Miller Research Building, Suite 671, 733 N. Broadway, Baltimore, Maryland 21205, USA. Email: gsemenza@jhmi.edu.
Find articles by Park, D. in: PubMed | Google Scholar
1Institute for Cell Engineering and
2Department of Genetic Medicine, Johns Hopkins University School of Medicine, Baltimore, Maryland, USA.
3Johns Hopkins University, Baltimore, Maryland, USA.
4Sidney Kimmel Comprehensive Cancer Center at Johns Hopkins, Baltimore, Maryland, USA.
Address correspondence to: Gregg L. Semenza, Johns Hopkins University School of Medicine, Miller Research Building, Suite 671, 733 N. Broadway, Baltimore, Maryland 21205, USA. Email: gsemenza@jhmi.edu.
Find articles by Huang, T. in: PubMed | Google Scholar
1Institute for Cell Engineering and
2Department of Genetic Medicine, Johns Hopkins University School of Medicine, Baltimore, Maryland, USA.
3Johns Hopkins University, Baltimore, Maryland, USA.
4Sidney Kimmel Comprehensive Cancer Center at Johns Hopkins, Baltimore, Maryland, USA.
Address correspondence to: Gregg L. Semenza, Johns Hopkins University School of Medicine, Miller Research Building, Suite 671, 733 N. Broadway, Baltimore, Maryland 21205, USA. Email: gsemenza@jhmi.edu.
Find articles by Datan, E. in: PubMed | Google Scholar
1Institute for Cell Engineering and
2Department of Genetic Medicine, Johns Hopkins University School of Medicine, Baltimore, Maryland, USA.
3Johns Hopkins University, Baltimore, Maryland, USA.
4Sidney Kimmel Comprehensive Cancer Center at Johns Hopkins, Baltimore, Maryland, USA.
Address correspondence to: Gregg L. Semenza, Johns Hopkins University School of Medicine, Miller Research Building, Suite 671, 733 N. Broadway, Baltimore, Maryland 21205, USA. Email: gsemenza@jhmi.edu.
Find articles by Dordai, D. in: PubMed | Google Scholar
1Institute for Cell Engineering and
2Department of Genetic Medicine, Johns Hopkins University School of Medicine, Baltimore, Maryland, USA.
3Johns Hopkins University, Baltimore, Maryland, USA.
4Sidney Kimmel Comprehensive Cancer Center at Johns Hopkins, Baltimore, Maryland, USA.
Address correspondence to: Gregg L. Semenza, Johns Hopkins University School of Medicine, Miller Research Building, Suite 671, 733 N. Broadway, Baltimore, Maryland 21205, USA. Email: gsemenza@jhmi.edu.
Find articles by
Schneck, J.
in:
PubMed
|
Google Scholar
|
1Institute for Cell Engineering and
2Department of Genetic Medicine, Johns Hopkins University School of Medicine, Baltimore, Maryland, USA.
3Johns Hopkins University, Baltimore, Maryland, USA.
4Sidney Kimmel Comprehensive Cancer Center at Johns Hopkins, Baltimore, Maryland, USA.
Address correspondence to: Gregg L. Semenza, Johns Hopkins University School of Medicine, Miller Research Building, Suite 671, 733 N. Broadway, Baltimore, Maryland 21205, USA. Email: gsemenza@jhmi.edu.
Find articles by
Semenza, G.
in:
PubMed
|
Google Scholar
|
Published October 1, 2026 - More info
J Clin Invest. 2026;136(19):e205415. https://doi.org/10.1172/JCI205415.
© 2026 Lyu et al. This work is licensed under the Creative Commons Attribution 4.0 International License. To view a copy of this license, visit http://creativecommons.org/licenses/by/4.0/.
Received: February 3, 2026; Accepted: August 7, 2026


-
Results
PPME1 expression is mediated by HIF-1 in hypoxic BC cells. Analysis of several recently published RNA-seq datasets from our lab revealed that PPME1 mRNA expression was significantly elevated in hypoxic BC cells (13, 27, 28). Consistently, hypoxia induced PPME1 expression at both the mRNA (Figure 1A and Supplemental Figure 1A; supplemental material available online with this article; https://doi.org/10.1172/JCI205415DS1) and protein (Figure 1B and Supplemental Figure 1B) levels in human estrogen receptor–positive (ER+) and progesterone receptor–positive (PR+) MCF-7 and T-47D cells; human epidermal growth factor receptor 2–positive (HER2+) HCC1954 cells; human triple-positive BT-474 cells; human triple-negative MDA-MB-231, SUM159, and SUM149 cells; mouse triple-positive EO771 cells; mouse triple-negative EMT6 and 4T1 cells; and the mouse brain metastatic TNBC subclone 4T1-BR5.
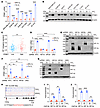 Figure 1
PPME1 expression is mediated by HIF-1 in hypoxic BC cells. (A) Human BC cell lines were exposed to 20% or 1% O2 for 24 hours, and PPME1 mRNA expression was analyzed by RT-qPCR. For each cell line, the expression of PPME1 mRNA was normalized to the mean result for MDA-MB-231 cells at 20% O2. ****P < 0.0001, 2-way ANOVA with Tukey’s multiple comparisons test. (B) BC cell lines were exposed to 20% or 1% O2 for 48 hours, whole cell lysates were prepared, and immunoblot assays were performed. (C) Comparison of the expression levels of 17 mRNAs encoded by HIF target genes (HIF metagene signature) in BCs that ranked in the top 100 (high) or bottom 100 (low) in TCGA database with respect to PPME1 mRNA expression. **P < 0.01, Wilcoxon test. (D–G) MDA-MB-231 (D and E) and MCF7 (F and G) subclones, which stably expressed a nontargeting control shRNA (NTC) or shRNA targeting HIF-1α, HIF-2α, or both HIF-1α and HIF-2α (DKD), were exposed to 20% or 1% O2 for 24 or 48 hours, followed by RT-qPCR (D and F) or immunoblot assay (E and G), respectively. **P < 0.01, ****P < 0.0001; 2-way ANOVA with Tukey’s multiple comparisons test. (H) ChIP-seq analysis of SUM159 cells revealed overlapping matches to the HIF consensus binding site 5′-(A/G)CGTG-3′ (highlighted in red) under the HIF-1α peak in the PPME1 gene at +92 bp relative to the transcription start site using the Integrative Genomics Viewer genome browser. (I and J) MDA-MB-231 (I) and MCF7 (J) cells were exposed to 20% or 1% O2 for 16 hours, and ChIP assays were performed using antibodies against HIF-1α, HIF-1β, or HIF-2α. Primers flanking the candidate HIF binding site were used for qPCR, and results were normalized to the mean result at 20% O2. **P < 0.01, ***P < 0.001, ****P < 0.0001, 2-tailed Student’s t test. In all bar graphs, data are presented as mean ± SD (n = 3).
Analysis of The Cancer Genome Atlas (TCGA) BC dataset revealed that patients with high PPME1 expression exhibited significantly increased expression of a 17-gene HIF signature (ANGPTL4, PDK1, VEGFA, LDHA, PGK1, HK2, CA9, CXCR3, L1CAM, BNIP3, PLOD1, P4HA1, P4HA2, NARF, ISG20, PADI4, and ITGB3) compared with patients with low PPME1 expression (Figure 1C). This association suggests that HIFs might regulate PPME1 expression in human BCs.
To determine the HIF dependency of PPME1 induction, we established MDA-MB-231 and MCF7 subclones stably transduced with a lentiviral vector encoding a nontargeting control (NTC) shRNA or shRNA(s) targeting HIF-1α, HIF-2α, or both (double knockdown [DKD]) and exposed the subclones to 1% O2. HIF-1α-knockdown (KD) and DKD, but not HIF-2α–KD, abrogated the hypoxic induction of PPME1 mRNA and protein in MDA-MB-231 (Figure 1, D and E) and MCF7 (Figure 1, F and G) cells. In contrast, expression of RPL13A, a gene that is not HIF regulated, was not affected by exposure to hypoxia or by HIF-KD in MDA-MB-231 or MCF7 (Supplemental Figure 1, C and D) cells. Treatment of BALB/c mice bearing EMT6 tumors with dual HIF-1/2 inhibitors that induce HIF-1α/2α protein degradation abrogated PPME1 protein expression in tumor tissue (Supplemental Figure 1E). Thus, both in vitro and in vivo data indicate that PPME1 expression is regulated by HIF-1.
To examine whether HIF-1 directly binds to the PPME1 gene for transcriptional activation in SUM159 cells, we performed ChIP using an anti–HIF-1α antibody followed by DNA sequencing (ChIP-seq) and identified a HIF-1α binding peak in the PPME1 gene. Within this peak, we found 2 overlapping sequences that match the HIF-1 consensus binding motif, 5′-(A/G)CGTG-3′, located 92 bp downstream of the transcription start site (Figure 1H). We exposed MDA-MB-231 and MCF7 cells to 1% O2 and performed ChIP followed by quantitative real-time PCR (ChIP-qPCR) assays. Binding of HIF-1α and HIF-1β, but not HIF-2α, to the PPME1 gene, but not the RPL13A gene, was induced by hypoxia in MDA-MB-231 (Figure 1I and Supplemental Figure 1F) and MCF7 cells (Figure 1J and Supplemental Figure 1G). These results indicate that PPME1 is bound by HIF-1 but not HIF-2. Together, these findings demonstrate that PPME1 is a direct transcriptional target of HIF-1 in BC cells.
PPME1 promotes nuclear localization of β-catenin in BC cells by enhancing AKT activity. PPME1 negatively regulates PP2A by demethylation of Leu-309 in the catalytic subunit (29, 30). In MDA-MB-231 cells, hypoxia-induced PPME1 expression led to demethylation at Leu-309 of PP2Ac, whereas PPME1-KD abrogated hypoxia-induced Leu-309 demethylation, without markedly affecting total PP2Ac protein levels (Figure 2A). Hypoxia significantly decreased PP2A catalytic activity, as measured by liberation of phosphate from a model substrate, and this effect was lost in PPME1-KD subclones (Figure 2B).
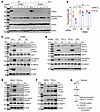 Figure 2
PPME1 promotes nuclear localization of β-catenin in BC cells by enhancing AKT activation through PP2Ac inhibition. (A) MDA-MB-231 subclones, which stably expressed an NTC shRNA or 1 of 5 shRNAs targeting PPME1 were exposed to 20% or 1% O2 for 48 hours, followed by immunoblot assays. (B and C) Subclones of MDA-MB-231 cells that expressed NTC or PPME1 shRNA (#3 or #4) were exposed to 20% or 1% O2 for 48 hours, followed by the malachite green Ser/Thr phosphatase assay (B) and immunoblot assays (C). Phosphate concentration was normalized to cell number. In the bar graph, data are presented as mean ± SD (n = 3); *P < 0.05, **P < 0.01, 2-way ANOVA with Tukey’s multiple comparisons test. (D) MDA-MB-231 subclones were exposed to 20% or 1% O2 for 48 hours, followed by immunoblot assays. (E and F) MDA-MB-231 cells were treated with vehicle (DMSO), PP2A activator (PP2A-a) SMAP-2 (10 μM; E), or PP2A inhibitor (PP2A-i) LB-100 (5 μM; F) and exposed to 20% or 1% O2 for 48 hours, followed by immunoblot assays. (G) The schematic illustrates the mechanism by which HIF-1 induces β-catenin nuclear translocation through PPME1 under hypoxic conditions.
We next analyzed AKT signaling, which plays a key role in BC progression and is negatively regulated by PP2A (31, 32). Hypoxia has been reported to induce AKT kinase activation and phosphorylation of serine 552 (Ser-552), and β-catenin has been shown to be mediated by AKT (23). In MDA-MB-231 subclones, hypoxia-induced phosphorylation of AKT at Ser-473 and Thr-308 and phosphorylation of β-catenin at Ser-552 were attenuated in PPME1-KD subclones, with no changes in total AKT or β-catenin protein levels (Figure 2C), indicating that PPME1 is required for hypoxia-mediated activation of AKT → β-catenin signaling in BC cells. Gene set enrichment analysis (GSEA) of RNA-seq data from patients with BC (TCGA) revealed enrichment of phosphatidylinositol 3-kinase–AKT (PI3K-AKT) signaling in tumors with the highest PPME1 expression compared with tumors with the lowest expression, supporting the role of PPME1 in activating AKT signaling (Supplemental Figure 1H). To validate the correlation between hypoxia and PI3K-AKT signaling in patients with BC, we examined pathway activity using gene expression signatures (33, 34) in TCGA data (35). We observed a significant positive association between hypoxia and PIK3CA pathway scores (Supplemental Figure 1I), indicating that hypoxia is associated with increased PI3K-AKT signaling in human BC tissue. Hypoxia-induced activation of the AKT → β-catenin axis was also observed in the nontumorigenic human mammary epithelial cell line MCF10A, indicating that this response is not restricted to malignant cells (Supplemental Figure 2A). We analyzed a published proteomic dataset comprising BC specimens from 105 patients (36) and found that PPME1 protein expression was positively correlated with β-catenin phosphorylation at Ser-552 (Supplemental Figure 2B). Cytoplasmic and nuclear fractionation in MDA-MB-231 subclones revealed that hypoxia increased nuclear Ser-552–phosphorylated β-catenin abundance, whereas PPME1 KD markedly attenuated this hypoxia-induced nuclear accumulation (Supplemental Figure 2C). Together, these data establish that PPME1 is required for hypoxia-induced nuclear translocation of β-catenin through Ser-552 phosphorylation and confirm the clinical relevance of this axis in BC.
To determine the HIF dependency of AKT → β-catenin signaling, we examined AKT and β-catenin phosphorylation in MDA-MB-231 subclones. HIF-1α, but not HIF-2α, was required for hypoxia-induced phosphorylation of AKT and β-catenin (Figure 2D). This pattern mirrors the hypoxia-induced activation of PPME1 by HIF-1 and indicates that HIF-1 → PPME1 transcriptional activation leads to AKT → β-catenin pathway activation.
To investigate the involvement of PP2A in this pathway, we treated MDA-MB-231 cells with PP2A activator SMAP-2 or PP2A inhibitor LB-100. Treatment with SMAP-2 mimicked the effect of PPME1-KD, abrogating hypoxia-induced phosphorylation of AKT and β-catenin (Figure 2E). In contrast, treatment with LB-100 produced the opposite effect, enhancing the phosphorylation of AKT and β-catenin (Figure 2F). No changes were observed with respect to total AKT or β-catenin protein levels across all conditions. Because neither compound affected PP2A protein levels, these findings suggest that PP2A activity is critical for PPME1-mediated activation of AKT → β-catenin signaling under hypoxia in BC cells.
To determine which regulatory function of PPME1 drives hypoxia-induced AKT → β-catenin activation, we employed two point mutants with distinct biochemical properties: S156A, which abolishes methylesterase activity while retaining PP2A inhibition; and M335D, which retains methylesterase activity but fails to inhibit PP2A (37). Reexpression of S156A in PPME1-KD cells fully recapitulated wild-type PPME1, restoring AKT and β-catenin phosphorylation and hypoxia-induced ISG20 and KLF4 expression, whereas M335D failed to restore any of these outputs (Supplemental Figure 2D). This dissociation establishes that the tumor-promoting AKT → β-catenin axis is governed by the PP2Ac active site inhibition function of PPME1, independent of its demethylase activity.
Taken together, our findings demonstrate that HIF-1–mediated PPME1 expression leads to PP2Ac inhibition, thereby decreasing its phosphatase activity toward AKT at Ser-473 and Thr-308, which results in enhanced AKT signaling, promoting β-catenin nuclear localization via phosphorylation at Ser-552 (Figure 2G).
PPME1 is required for hypoxia-induced BCSC specification. HIF-1 plays a critical role in BCSC specification by inducing the expression (13) and activity (14) of pluripotency factors under hypoxic conditions. To investigate how HIF-1–mediated PPME1 expression contributes to BCSC enrichment, we analyzed TCGA data. We observed a significant positive correlation between the expression of PPME1 mRNA and a 20-gene BCSC signature (38) (Figure 3A). Culturing BC cells under nonadherent conditions induces the formation of mammospheres, which have been shown to be enriched in BCSCs (39). We performed mammosphere formation assays using NTC and PPME1-KD subclones of MDA-MB-231 and MCF7 cells to assess secondary mammosphere formation, which was initiated after dissociating primary mammospheres and represents a more rigorous measure of BCSC specification (40). The hypoxia-induced enhancement of mammosphere formation observed in MDA-MB-231 NTC subclones persisted through the second generation over 14 days after removal from the hypoxic environment. In contrast, this effect was abolished in PPME1-KD subclones (Figure 3, B and C). Similar results were observed in MCF7 cells (Supplemental Figure 3, A and B). Furthermore, we compared the expression of PPME1 with expression of NANOG and KLF4, which are required for BCSC specification (11, 41–44). Both mRNA and protein levels were markedly induced in MDA-MB-231 mammospheres as compared with adherent cells (Figure 3, D and E). Similar results were observed in MCF7 cells (Supplemental Figure 3, C and D). These findings demonstrate that PPME1 is required for hypoxia-induced NANOG and KLF4 expression and BCSC specification.
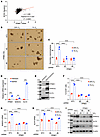 Figure 3
PPME1 is required for hypoxia-induced BCSC specification. (A) Expression of PPME1 mRNA and a BCSC signature in primary BC samples were analyzed by Pearson’s test. (B and C) Representative light microscope images (B; scale bar: 100 μm) and quantification (C) of secondary mammospheres generated from MDA-MB-231 subclones expressing NTC or PPME1 shRNA (#3 or #4) and exposed to 20% or 1% O2 for 72 hours. ****P < 0.0001, 2-way ANOVA with Tukey’s multiple comparisons test. (D and E) mRNA and protein were extracted from MDA-MB-231 adherent cells and secondary mammospheres, followed by RT-qPCR (D) and immunoblot assays (E), respectively. RT-qPCR results were normalized to adherent cells. **P < 0.01, ***P < 0.001, 2-tailed Student’s t test. (F) MDA-MB-231 subclones were exposed to 20% or 1% O2 for 72 hours, and the percentage of cells with high aldehyde dehydrogenase-expressing (ALDH+) activity was determined by ALDEFLUOR assay. ****P < 0.0001, 2-way ANOVA with Tukey’s multiple comparisons test. (G–I) MDA-MB-231 subclones were exposed to 20% or 1% O2 for 24 or 48 hours, followed by RT-qPCR (G and H) and immunoblot assays (I), respectively. ****P < 0.0001, 2-way ANOVA with Tukey’s multiple comparisons test. In all bar graphs, data are presented as mean ± SD (n = 3).
Aldehyde dehydrogenase (ALDH) is a marker of BCSCs, and its catalytic activity regulates tumor stemness (45). Hypoxia induces expansion of the BCSC population, as reflected by an increased percentage of ALDH+ cells (46). ALDH+ cells in NTC and PPME1-KD subclones of MDA-MB-231 and MCF7 cells exposed to 20% or 1% O2 were quantified by flow cytometry (gating shown in Supplemental Figure 3, E and F). PPME1-KD significantly decreased the ALDH+ population after hypoxic exposure of MDA-MB-231 (Figure 3F) or MCF7 (Supplemental Figure 3G) cells. Both mRNA and protein levels of NANOG and KLF4 were also decreased in PPME1-KD as compared with NTC subclones of MDA-MB-231 (Figure 3, G–I) and MCF7 (Supplemental Figure 3, H–J). Taken together, these results indicate that PPME1 promotes hypoxia-induced BCSC specification by stimulating the expression of NANOG and KLF4.
PPME1 regulates BC tumor initiation and growth. To investigate the role of PPME1 in regulating the tumor-initiating capacity of BC cells — a key functional property of BCSCs in vivo (47, 48) — we orthotopically injected 1,000 NTC or PPME1-KD subclone cells into the mammary fat pad of SCID mice. Under these circumstances, BCSCs are limiting for tumor formation. Following a long-term observation period of 87 days, tumors developed in 9 of 10 mice injected with NTC cells, whereas only 5 of 20 mice injected with either of 2 independent PPME1-KD subclones developed tumors (Figure 4A), indicating that PPME1 is essential for efficient tumor initiation in vivo. We began measurement of tumor volume on day 70 when all tumors could be reliably assessed. At this time point, tumors in the NTC group appeared larger than those in the PPME1-KD group. Tumor growth was monitored for an additional 17 days. In those mice in which tumor formation occurred, PPME1-KD markedly suppressed tumor growth, as evidenced by decreased tumor volume over time (Figure 4B) and decreased mean tumor weight at the endpoint (Figure 4C). These findings indicate that PPME1 is critical for both BC tumor initiation and growth.
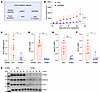 Figure 4
PPME1 KD impairs tumor initiation and growth. (A) MDA-MB-231 subclones expressing NTC or PPME1 shRNA (#3 or #4) were implanted into the mammary fat pad (MFP) of 7-week-old female SCID mice, and the mice were scored for the presence of a palpable tumor on day 87 after implantation. The two PPME1-KD groups were pooled for comparison with the NTC group using Fisher’s exact test. (B) Primary tumor volume was measured every 2 days. Mean ± SD are shown; ***P < 0.001, 2-way ANOVA with Šidák’s multiple comparisons test. (C) Tumors were harvested and weighed. Mean ± SD (n = 5–7; 2 mice in the NTC group died during the tumor measurement period). *P < 0.05, 2-tailed Student’s t test. (D–G) mRNA and protein were extracted from tumor tissues, and aliquots were subjected to RT-qPCR (D–F) and immunoblot assays (G), respectively. Mean ± SD (n = 5–7) are shown. *P < 0.05, **P < 0.01, Mann-Whitney test.
To validate the involvement of NANOG and KLF4 in PPME1-mediated BCSC enrichment in vivo, we extracted mRNA and protein from tumor tissues and analyzed the expression of PPME1, NANOG, and KLF4. The sustained depletion of PPME1 at both mRNA and protein levels confirmed long-term KD efficiency in vivo. Consistently, the expression of NANOG and KLF4 was markedly decreased in PPME1-KD tumors at both the mRNA and protein levels (Figure 4, D–G). Our laboratory has previously established through gain- and loss-of-function studies that NANOG and KLF4 are essential and sufficient mediators of hypoxia-induced BCSC specification downstream of HIF-1 (11, 49, 50). Thus, PPME1 regulates BCSC specification and tumor initiation capacity in association with regulation of NANOG and KLF4 expression in vivo.
Increased PPME1 expression correlates with adverse clinical outcome. We analyzed publicly available datasets and found that levels of both PPME1 mRNA (Supplemental Figure 4, A and B) and protein (Supplemental Figure 4C) were elevated in BC compared with normal breast tissue. PPME1 mRNA levels were higher in all stages (Supplemental Figure 4D) and in all subtypes (Supplemental Figure 4E) of human BC. These clinical data are consistent with the similar phenotypes and regulatory mechanisms that we observed in cell lines derived from both TNBC (MDA-MB-231) and ER+/PR+ BC (MCF7). Kaplan-Meier analysis of 2 GEO datasets revealed that elevated PPME1 expression was significantly associated with decreased overall survival (Supplemental Figure 4F) and relapse-free survival (Supplemental Figure 4G) of patients with BC.
β-Catenin is required for hypoxia-induced and HIF-1–dependent BCSC enrichment. β-Catenin plays a dynamic role in tumorigenesis and has been reported to enhance HIF-1–mediated transcription (51). Given our finding that PPME1 promotes β-catenin nuclear translocation via AKT signaling, we sought to investigate the role of nuclear β-catenin in hypoxic BC cells. β-Catenin KD (CTNNB1-KD) markedly decreased the expression of NANOG and KLF4 in MDA-MB-231 (Figure 5, A–C) and MCF7 (Supplemental Figure 5, A–C) cells, indicating that nuclear β-catenin is required for the hypoxia-induced upregulation of NANOG and KLF4. CTNNB1-KD also decreased the percentage of ALDH+ cells under hypoxic conditions, to a degree comparable to HIF1A-KD (Figure 5D), further supporting the role of β-catenin in hypoxia-induced BCSC specification.
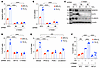 Figure 5
β-Catenin promotes hypoxia-induced and HIF-1–dependent BCSC enrichment. (A and B) MDA-MB-231 subclones expressing NTC or β-catenin shRNA (#4 or #5) were exposed to 20% or 1% O2 for 24 hours, followed by RT-qPCR with primers specific for NANOG (A) or KLF4 (B) mRNA. ****P < 0.0001, 2-way ANOVA with Tukey’s multiple comparisons test. (C) MDA-MB-231 subclones were exposed to 20% or 1% O2 for 48 hours, followed by immunoblot assays. (D) MDA-MB-231 subclones expressing NTC, HIF-1α, or β-catenin shRNA (#4) were exposed to 20% or 1% O2 for 72 hours, and the percentage of ALDH+ cells was determined. ****P < 0.0001, 2-way ANOVA with Tukey’s multiple comparisons test. (E) MDA-MB-231 cells were treated with DMSO, PP2A activator SMAP-2 (10 μM), PI3K inhibitor LY294002 (5 μM), or β-catenin inhibitor MSAB (5 μM) and exposed to 20% or 1% O2 for 72 hours, and the percentage of ALDH+ cells was determined. ***P < 0.001, ****P < 0.0001, 2-way ANOVA with Tukey’s multiple comparisons test. (F) MDA-MB-231 NTC and HIF1A-KD subclones were transfected with empty vector (EV) or β-catenin expression vector (CTNNB1). Cells were exposed to 20% or 1% O2 for 72 hours, and the percentage of ALDH+ cells was determined. ****P < 0.0001, 2-way ANOVA with Tukey’s multiple comparisons test. In all bar graphs, data are presented as mean ± SD (n = 3).
To validate regulation of the AKT–β-catenin pathway by PP2A in BCSCs, we performed the ALDH assay in MDA-MB-231 cells treated with PP2A activator SMAP-2, PI3K inhibitor LY294002, or β-catenin inhibitor MSAB. Each treatment significantly decreased the ALDH+ cell population under hypoxia (Figure 5E), validating the mechanism by which PPME1 mediates hypoxia-induced BCSC specification. Treatment with MSAB, which triggers β-catenin degradation, abolished the hypoxia-induced expression of NANOG and KLF4 protein in both MDA-MB-231 (Supplemental Figure 5D) and MCF7 (Supplemental Figure 5E) cells.
To investigate the sufficiency of β-catenin for BCSC specification, we engineered β-catenin overexpression (β-catenin–OE) in MDA-MB-231 cells. β-Catenin–OE slightly increased the ALDH+ cell population under nonhypoxic conditions but significantly enhanced the hypoxia-induced expansion of ALDH+ cells, and this enhancement was abrogated by HIF1A-KD (Figure 5F). Furthermore, cooverexpression of β-catenin and HIF-1α under nonhypoxic conditions also led to a notable increase in ALDH+ cells (Supplemental Figure 5F), indicating that β-catenin amplifies the effect of HIF-1 on hypoxia-induced BCSC specification.
HIF-1, PPME1, and β-catenin are required for broad transcriptional response to hypoxia. To establish a genome-wide role for PPME1 and β-catenin in HIF-1–mediated transcription, we performed RNA-seq. NTC, HIF1A-KD, PPME1-KD, and CTNNB1-KD subclones of SUM159 TNBC cells were exposed to 20% or 1% O2 for 24 hours, and 3 biological replicates for each condition were subjected to RNA-seq. In response to hypoxia, expression of 2,685 RNAs was increased and expression of 2,322 RNAs was decreased >1.5-fold with a FDR < 0.05 in the NTC subclone (Supplemental Figure 6A). Enrichment analysis of these 2 gene sets revealed distinct signaling patterns under hypoxia. Among hypoxia-induced RNAs, hypoxia and TNF-α signaling ranked at the top (Supplemental Figure 6B). In contrast, hypoxia-repressed RNAs were most enriched for IFN-α and IFN-γ response (Supplemental Figure 6C).
Heatmap analysis of the 4 subclones revealed that the transcriptional responses to hypoxia mediated by HIF-1 were largely dependent on PPME1 and β-catenin (Figure 6A). Venn analysis of the hypoxia-induced genes that were HIF-1α–dependent, PPME1-dependent, and β-catenin–dependent revealed a high degree of overlap (Figure 6B).
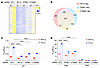 Figure 6
HIF-1, PPME1, and β-catenin are required for a broad transcriptional response to hypoxia. (A) SUM159 shRNA-expressing subclones were exposed to 20% or 1% O2 for 24 hours, and RNA was extracted for sequencing (n = 3 independent samples each). The expression of HIF-1α–dependent hypoxia-induced RNAs is shown for each of the 4 shRNA subclones as a heatmap. (B) Venn analysis shows the overlap among HIF-1α–dependent, PPME1-dependent and β-catenin–dependent hypoxia-induced RNAs identified by RNA-seq. (C) MDA-MB-231 subclones were transiently cotransfected with HIF-1 reporter plasmid p2.1, which expresses firefly luciferase (FLuc) under the control of an hypoxia response element upstream of an SV40 promoter, and control reporter pSV-RL, which expresses Renilla luciferase (RLuc) under the control of the SV40 promoter alone. At 24 hours after transfection, the cells were exposed to 20% or 1% O2 for 24 hours, and FLuc/RLuc ratios were determined. ****P < 0.0001, 2-way ANOVA with Tukey’s multiple comparisons test. (D) MDA-MB-231 subclones were transiently cotransfected with plasmid pGalO or pGalA, which encode the Gal4 DNA-binding domain either alone (GalO) or fused to HIF-1α residues 531–826 (GalA); reporter pG5E1bLuc containing 5 GAL4-binding sites and a basal E1b promoter upstream of FLuc coding sequences; and RLuc reporter pSV-RL. At 24 hours after transfection, the cells were exposed to 20% or 1% O2 for 24 hours, and FLuc/RLuc ratios were determined. ****P < 0.0001, 2-way ANOVA with Tukey’s multiple comparisons test. In both bar graphs, data are presented as mean ± SD (n = 3).
To further explore the role of PPME1 and β-catenin in HIF-1–dependent transcription in BC cells, we analyzed the expression of a HIF-1–dependent reporter gene. Cells were cotransfected with p2.1, which contains the ENO1 HRE upstream of a basal SV40 promoter and firefly luciferase (FLuc) coding sequences, and pSV-RL, which contains the SV40 promoter alone upstream of Renilla luciferase (RLuc) coding sequences, such that the FLuc/RLuc ratio is a measure of HIF-1 transcriptional activity. Hypoxia increased HIF-1–dependent transcription in NTC cells but KD of HIF-1α, PPME1 or β-catenin expression blocked hypoxia-induced transcription (Figure 6C).
We also analyzed the effects of PPME1 and β-catenin depletion on HIF-1α transactivation domain (TAD) function. Cells were cotransfected with pGalA, which encodes a fusion protein containing the GAL4 DNA-binding domain fused to HIF-1α residues 531–826; reporter plasmid pG5-E1b-FLuc, which contains 5 GAL4 binding sites upstream of a basal adenoviral E1b promoter and FLuc coding sequences; and control reporter pSV-RL. Hypoxia induced GalA-dependent transcription in NTC but not in PPME1-KD or CTNNB1-KD cells (Figure 6D). No transcriptional activity was observed in cells transfected with pGalO, which encodes the GAL4 DNA-binding domain alone (Figure 6D). Together, these results suggest that deficiency of PPME1 or β-catenin impairs HIF-1 transcriptional activity due to loss of TAD function. This finding is in agreement with a previous report in SW480 colorectal cancer cells, in which CTNNB1-KD significantly reduced hypoxia-induced HIF-1–dependent reporter activity (51). Taken together, these results demonstrate that HIF-1, PPME1, and β-catenin are all required for a broad transcriptional response to hypoxia in BC cells.
PPME1 and β-catenin repress the STAT1/IRF1/CXCL10 axis via ISG20. Because IFN-α and IFN-γ responses were identified as the top 2 enriched signatures among hypoxia-repressed RNAs (Supplemental Figure 6C), and a recent study from our lab demonstrated that ISG20 mediates immune evasion in hypoxic BC cells (12), we reanalyzed our RNA-seq data and were intrigued to find that ISG20 expression depends on HIF-1, PPME1, and β-catenin (Supplemental Figure 6D). Next, we investigated how PPME1 and β-catenin regulate ISG20 expression in hypoxic BC cells. ChIP-qPCR assays using antibodies against HIF-1α, HIF-1β, and p300 in MDA-MB-231 cells demonstrated that both PPME1 and β-catenin were required for HIF-1α, HIF-1β, and p300 binding to the ISG20 HRE (Figure 7, A–C). Immunoblot analysis of HIF-1α and HIF-1β protein levels at the same time point showed no marked changes across all subclones (Figure 7D), confirming that the loss of HIF-1 and p300 binding to the ISG20 HRE was not due to protein degradation.
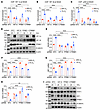 Figure 7
PPME1 and β-catenin are required for hypoxia-mediated repression of the STAT1/IRF1/CXCL10 axis via transcriptional regulation of ISG20. (A–C) MDA-MB-231 subclones expressing NTC, HIF-1α, PPME1, or β-catenin shRNA were exposed to 20% or 1% O2 for 16 hours, followed by ChIP-qPCR assays using antibodies against HIF-1α (A), HIF-1β (B) or p300 (C) and primers flanking the HIF-1 binding site of ISG20. **P < 0.01, ***P < 0.001, ****P < 0.0001, 2-way ANOVA with Tukey’s multiple comparisons test. (D) MDA-MB-231 subclones were exposed to 20% or 1% O2 for 16 hours, and immunoblot assays were performed. (E–I) MDA-MB-231 subclones were exposed to 20% or 1% O2 for 48 hours, followed by RT-qPCR (E–H) or immunoblot assays (I). **P < 0.01, ***P < 0.001, ****P < 0.0001, 2-way ANOVA with Tukey’s multiple comparisons test. In all bar graphs, data are presented as mean ± SD (n = 3).
HIF-1 has been shown to increase transcription initiation of target genes, which is measured by the presence of RNA polymerase II (RPII) phosphorylated at Ser-5 of the C-terminal domain (RPII-S5P), and to stimulate the release of paused RPII, which is measured by phosphorylation at Ser-2 of the C-terminal domain (RPII-S2P) (13). Hypoxia-induced occupancy of the ISG20 HRE by RPII–S5P and RPII–S2P in NTC cells was impaired in HIF1A-KD, PPME1-KD, and CTNNB1-KD subclones (Supplemental Figure 7A). These results indicate that, as in the case of HIF-1α, both PPME1 and β-catenin are required for efficient induction of transcription initiation and release of paused RPII for productive transcript elongation at the ISG20 gene under hypoxic conditions.
Hypoxia has been reported to suppress CXCL10 expression in various cancer cell types (52–55). STAT1 and IRF1, transcription factors that cooperatively activate CXCL10 transcription (56, 57), are also known to be downregulated in hypoxia in a HIF-dependent manner (58). ISG20 is an exonuclease that degrades STAT1 and IRF1 mRNAs, thereby inhibiting CXCL10 expression in hypoxic BC cells. These findings provide direct causal evidence that ISG20 functions as an effector mediating hypoxia-induced repression of the STAT1/IRF1/CXCL10 axis (12). Thus, we analyzed the expression of ISG20, STAT1, IRF1, and CXCL10 in MDA-MB-231 cells. Hypoxia-induced ISG20 expression was markedly attenuated in HIF1A-KD, PPME1-KD, and CTNNB1-KD cells, whereas the hypoxia-mediated repression of STAT1, IRF1, and CXCL10 was reversed in these KD subclones, at both the mRNA (Figure 7, E–H) and protein (Figure 7I) levels. A similar mRNA expression pattern was observed in EMT6 cells (Supplemental Figure 7, B–E). Collectively, these results demonstrate that both PPME1 and β-catenin are required for hypoxia-mediated repression of the STAT1/IRF1/CXCL10 axis via HIF-1–mediated transcriptional activation of ISG20.
PPME1 → β-catenin → HIF-1 → ISG20 signaling mediates immune evasion. We hypothesized that PPME1 contributes to hypoxia-induced suppression of antitumor immunity. To test this hypothesis, we established orthotopic EMT6 breast tumors in syngeneic immunocompetent BALB/c mice using NTC, PPME1-KD, or CTNNB1-KD subclones. Depletion of PPME1 markedly suppressed tumor growth (Figure 8A) and decreased tumor weight at the endpoint (Figure 8B). CTNNB1-KD cells formed very small tumors and failed to sustain further growth (Figure 8A). This observation is consistent with those in previous reports showing that loss of β-catenin suppresses tumor growth in BC and other tumor types (59–63). Due to the limited amount of CTNNB1-KD tumor tissue, subsequent experimental analyses were performed with NTC and PPME1-KD tumors only. Sustained depletion of PPME1 mRNA confirmed the long-term KD efficiency in vivo (Figure 8C). Tumor tissues were analyzed by multispectral flow cytometry to quantify CD8+ T cells (Supplemental Figure 8A), which mediate antitumor immunity, and M2-type tumor-associated macrophages (M2-TAMs) (Supplemental Figure 8B), which mediate immunosuppression. The proportion of intratumoral CD8+ T cells was significantly increased (Figure 8D), whereas M2-TAMs were markedly decreased (Figure 8E) in PPME1-KD tumors. These results indicate that PPME1 mediates BC immune evasion by impairing CD8+ T cell recruitment and enhancing the M2-TAM population. CD8+ T cells produce IFN-γ, an effector cytokine that plays a critical role in the cell-mediated immune response against intracellular pathogens and tumor cells (64, 65). We observed increased IFN-γ expression at both the mRNA (Figure 8F) and protein (Figure 8G) levels in PPME1-KD tumors. CXCL10 mediates cell recruitment by binding to the chemokine receptor CXCR3 on the surface of T cells. CXCL10 expression was increased at both the mRNA (Figure 8H) and protein (Figure 8I) levels in PPME1-KD tumors. These results indicate that PPME1 mediates T cell exclusion by suppressing CXCL10 expression.
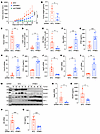 Figure 8
PPME1 KD suppresses BC growth in an immune-mediated manner through inhibition of ISG20 and VEGFA expression. (A and B) EMT6 subclones expressing NTC, PPME1, or β-catenin shRNA were implanted in the mammary fat pad of female BALB/c mice, and tumor growth was monitored (A). ****P < 0.0001, 2-way ANOVA with Tukey’s multiple comparisons test. On day 25, NTC and PPME1-KD tumors were harvested and weighed (B). *P < 0.05, Welch’s t test. (C) PPME1 mRNA expression in tumor tissues was analyzed by RT-qPCR and normalized to the result from NTC group. **P < 0.01, Welch’s t test. (D) The percentage of CD45+/CD8+/CD4– T cells among live cells in the tumors was determined by flow cytometry. *P < 0.05, Welch’s t test. (E) The percentage of CD11b+/MHC II–/Ly6C– M2-TAMs among live cells was determined by flow cytometry. *P < 0.05, Welch’s t test. (F and G) Analysis of IFN-γ (Ifng) mRNA expression by RT-qPCR (F) and protein levels by ELISA (G) in tumors was performed. **P < 0.01, ***P < 0.001, Welch’s t test. (H and I) Analysis of CXCL10 mRNA expression by RT-qPCR (H) and protein levels by ELISA (I) in tumors was performed. **P < 0.01, ****P < 0.0001, Welch’s t test. (J–M) mRNA and protein were extracted from tumors and RT-qPCR (J–L) and immunoblot assays (M) were performed. **P < 0.01, Welch’s t test. (N and O) VEGFA mRNA (N) and protein (O) levels were analyzed in tumors. *P < 0.05, Welch’s t test. (P and Q) IL6 mRNA (P) and protein (Q) levels were analyzed in tumors. ***P < 0.001, Welch’s t test. In all bar graphs, data are presented as mean ± SD (n = 6 tumors).
ISG20 mRNA levels were significantly decreased in PPME1-KD tumors (Figure 8J), whereas STAT1 (Figure 8K) and IRF1 (Figure 8L) mRNA levels were increased. Consistent changes were observed at the protein level (Figure 8M). In our recent study, ISG20-KD restored STAT1, IRF1, and CXCL10 expression, as well as intratumoral CD8+ T cell and NK cell recruitment in orthotopic breast tumor models, establishing ISG20 as a direct driver of immune exclusion (12). Collectively, these findings indicate that PPME1-dependent ISG20 expression suppresses STAT1/IRF1-mediated CXCL10 expression, thereby blocking the recruitment of CD8+ T cells.
In addition to CXCL10, we also analyzed the expression of VEGFA and IL6, which mutually reinforce M2-TAM recruitment and immunosuppressive functions in multiple cancers (66–70). Consistent with the decreased number of M2-TAMs, VEGFA (Figure 8, N and O) and IL6 (Figure 8, P and Q) expression was decreased in PPME1-KD tumors. Since VEGFA is a well-known HIF-1 target gene, we further examined its dependency on PPME1 and β-catenin and found that hypoxic induction of VEGFA was dependent on HIF-1α, PPME1, and β-catenin expression in EMT6 cells (Supplemental Figure 9A). ELISA further validated these results at the secreted protein level (Supplemental Figure 9B). However, IL6 mRNA was undetectable in EMT6 cells according to our previous RNA-seq analysis (12). These data suggest that the reduced level of IL6 production in tumors is likely attributable to a decreased population of M2-TAMs, which are known to express IL6, rather than altered expression in tumor cells. Together, these results suggest that PPME1 KD modulates tumor-infiltrating activated T cells and M2-TAMs by altering the expression of key chemokines (CXCL10 and VEGFA), thereby reshaping the balance between antitumor (IFN-γ) and protumor (IL6) cytokines in the tumor microenvironment to enhance antitumor immunity.
We further investigated the PPME1–AKT–β-catenin axis, previously analyzed in cell culture, in EMT6 tumors. Consistent with our in vitro findings, PPME1-KD led to decreased phosphorylation of AKT at Ser-473 and Thr-308, and decreased phosphorylation of β-catenin at Ser-552, without major changes in the total levels of each protein (Supplemental Figure 10A). Unexpectedly, HIF-1α protein levels were decreased in PPME1-KD tumors, suggesting that long-term PPME1 depletion might impair HIF-1α protein synthesis or stability.
PPME1-KD suppresses tumor growth via CXCL10-driven CD8+ T cell recruitment. To dissect the immune mechanisms underlying the tumor-suppressive effects of PPME1 KD, we orthotopically implanted BALB/c mice with EMT6 subclones expressing NTC or PPME1 shRNA. NTC tumor-bearing mice received intraperitoneal injections of anti-VEGFA or IgG isotype control antibody, while shPPME1 tumor-bearing mice were treated with anti-CXCL10, anti-CD8α, or IgG isotype control antibody (Figure 9A). Anti-VEGFA treatment significantly reduced tumor growth in NTC mice relative to that in IgG controls, whereas neutralization of CXCL10 or depletion of CD8+ T cells in shPPME1 mice both substantially rescued tumor growth (Figure 9B). Consistent with this, shPPME1+IgG tumors exhibited a marked increase in intratumoral CD8+ T cell abundance relative to NTC+IgG; anti-CXCL10 treatment significantly reduced this infiltration, and anti-CD8α treatment nearly abolished it, confirming that CXCL10 is required for CD8+ T cell recruitment in PPME1-deficient tumors (Figure 9C). Analysis of M2-TAMs revealed that anti-VEGFA treatment significantly decreased the percentage of M2-TAMs in NTC tumors, indicating that VEGFA drives M2-TAM polarization or infiltration (Figure 9D). Collectively, these findings demonstrate that PPME1-KD suppresses tumor growth through CXCL10-driven CD8+ T cell recruitment, while VEGFA sustains an immunosuppressive microenvironment through M2-TAM enrichment.
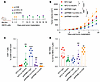 Figure 9
PPME1-KD suppresses tumor growth through CXCL10-driven CD8+ T cell recruitment, while VEGFA sustains an immunosuppressive microenvironment through M2-TAM enrichment. (A) BALB/c mice were orthotopically implanted with EMT6 subclones expressing NTC or PPME1 shRNA. Mice bearing NTC tumors were treated by intraperitoneal injection with anti-VEGFA antibody or IgG2a isotype control antibody at 100 μg per dose on days 7, 10, 13, 16, and 18 after tumor implantation. Mice bearing shPPME1 tumors were treated with anti-CD8α antibody at 100 μg per dose on days 1 and 2 or with anti-CXCL10 antibody or IgG isotype control antibody at 200 μg on day 7 and 100 μg on days 11, 15, and 18. (B) Tumor growth curves are shown as mean ± SD (n = 6). *P < 0.05 and ****P < 0.0001 vs. NTC + IgG; ####P < 0.0001 vs. shPPME1 + IgG, 2-way ANOVA with Tukey’s multiple comparisons test. (C) The percentage of CD45+/CD8+/CD4– T cells among live cells was determined by flow cytometry. ****P < 0.0001 vs. NTC + IgG; ###P < 0.001 and ####P < 0.0001 vs. shPPME1 + IgG, 1-way ANOVA with Tukey’s multiple comparisons test. (D) The percentage of CD11b+/MHC II–/Ly6C– M2-TAMs among live cells was determined by flow cytometry. *P < 0.05 vs. NTC + IgG; ##P < 0.01 vs. shPPME1 + IgG, 1-way ANOVA with Tukey’s multiple comparisons test.
PPME1-KD enhances the efficacy of anti-CTLA-4 immunotherapy. To investigate whether PPME1 silencing can enhance the response to ICB, we established orthotopic EMT6 breast tumors in immunocompetent BALB/c mice using NTC and PPME1-KD subclones. Once palpable tumors developed, mice were treated with either anti–CTLA-4 antibody or isotype control IgG (Figure 10A). Compared with NTC tumors treated with isotype control antibody, anti–CTLA-4 treatment of NTC tumors and PPME1-KD tumors treated with isotype control antibody showed significantly decreased tumor growth; however, anti–CTLA-4 treatment in the PPME1-KD group resulted in complete tumor eradication in all of the mice (Figure 10, B–F). Mice with eradicated tumors were given a secondary tumor challenge on day 117 but no further treatment. By the final endpoint (day 237), no tumor recurrence was observed in any of the mice, indicating durable antitumor immunity. Thus, PPME1 KD enhances the therapeutic efficacy of anti–CTLA-4 ICB.
 Figure 10
PPME1-KD enhances the efficacy of anti-CTLA-4 immunotherapy. (A) BALB/c mice were orthotopically implanted with EMT6 subclones expressing NTC or PPME1 shRNA. When tumors became measurable, mice were treated by intraperitoneal injection with anti-CTLA-4 antibody or IgG isotype control. (B) Tumor growth curves are shown as mean ± SD (n = 5, 1 mouse in the NTC + IgG group died during the tumor measurement period); ****P < 0.0001, 2-way ANOVA with Tukey’s multiple comparisons test. (C–F) Individual tumor growth curves are shown (1 mouse in the NTC + IgG group was euthanized on day 25 due to tumor burden). The number of mice in each group that achieved a complete response (CR) and recurrence-free survival (RFS) on day 237 after secondary tumor cell injection on day 117 is indicated.


Copyright © 2026 American Society for Clinical Investigation
ISSN: 0021-9738 (print), 1558-8238 (online)