
Advertisement
Research ArticleImmunologyMetabolism
Open Access |  10.1172/JCI201325
SREBP1c modulates Treg immunobiology through a phospholipid-dependent adenosine pathway
Fabrizia Bonacina,1 Claudio Procaccini,2,3 Marta Iaia,1 Arianna Moretti,1 Monika Svecla,4 Silvia Pedretti,1,5 Jeroen Bogie,6,7 Giovanni Battista Vingiani,1 Annalisa Moregola,1 Francesca Genova,1 Claudia Russo,2,8 Giusy De Rosa,2 Claudia La Rocca,2 Giada Mondanelli,9 Marco Gargaro,9 Nico Mitro,1,5 Giuseppe Matarese,2,10 and Giuseppe Danilo Norata1
1Department of Excellence of Pharmacological and Biomolecular Sciences “Rodolfo Paoletti,” Università degli Studi di Milano, Milan, Italy.
2Laboratorio di Immunologia, Istituto degli Endotipi in Oncologia, Metabolismo e Immunologia “G. Salvatore” – Consiglio Nazionale delle Ricerche, Napoli, Italy.
3Unità di Neuroimmunologia, IRCCS Fondazione Santa Lucia, Roma, Italy.
4Deutsches Herzzentrum der Charité – Charité-Universitätsmedizin, Berlin, Germany.
5Department of Experimental Oncology, European Institute of Oncology (IEO) IRCCS, Milan, Italy.
6Department of Immunology and Infection, Hasselt University, Diepenbeek, Belgium.
7University MS Center, Pelt, Belgium.
8Dipartimento Assistenziale Integrato de Medicina di Laboratorio e Trasfusionale, Azienda Ospedaliera Universitaria “Federico II,” Napoli, Italy.
9Department of Pharmaceutical Sciences, University of Perugia, Perugia, Italy.
10Treg Cell Lab, Dipartimento di Medicina Molecolare e Biotecnologie Mediche, Università degli Studi di Napoli “Federico II,” Napoli, Italy.
Address correspondence to: Fabrizia Bonacina, Department of Excellence of Pharmacological and Biomolecular Sciences “Rodolfo Paoletti,” Università degli Studi di Milano, via Giuseppe Balzaretti 9 20133, Milan, Italy. Phone: 0039.0250318259; Email: fabrizia.bonacina@unimi.it.
Authorship note: MI and AM contributed equally to this work.
Find articles by
Bonacina, F.
in:
PubMed
|
Google Scholar
|

1Department of Excellence of Pharmacological and Biomolecular Sciences “Rodolfo Paoletti,” Università degli Studi di Milano, Milan, Italy.
2Laboratorio di Immunologia, Istituto degli Endotipi in Oncologia, Metabolismo e Immunologia “G. Salvatore” – Consiglio Nazionale delle Ricerche, Napoli, Italy.
3Unità di Neuroimmunologia, IRCCS Fondazione Santa Lucia, Roma, Italy.
4Deutsches Herzzentrum der Charité – Charité-Universitätsmedizin, Berlin, Germany.
5Department of Experimental Oncology, European Institute of Oncology (IEO) IRCCS, Milan, Italy.
6Department of Immunology and Infection, Hasselt University, Diepenbeek, Belgium.
7University MS Center, Pelt, Belgium.
8Dipartimento Assistenziale Integrato de Medicina di Laboratorio e Trasfusionale, Azienda Ospedaliera Universitaria “Federico II,” Napoli, Italy.
9Department of Pharmaceutical Sciences, University of Perugia, Perugia, Italy.
10Treg Cell Lab, Dipartimento di Medicina Molecolare e Biotecnologie Mediche, Università degli Studi di Napoli “Federico II,” Napoli, Italy.
Address correspondence to: Fabrizia Bonacina, Department of Excellence of Pharmacological and Biomolecular Sciences “Rodolfo Paoletti,” Università degli Studi di Milano, via Giuseppe Balzaretti 9 20133, Milan, Italy. Phone: 0039.0250318259; Email: fabrizia.bonacina@unimi.it.
Authorship note: MI and AM contributed equally to this work.
Find articles by Procaccini, C. in: PubMed | Google Scholar
1Department of Excellence of Pharmacological and Biomolecular Sciences “Rodolfo Paoletti,” Università degli Studi di Milano, Milan, Italy.
2Laboratorio di Immunologia, Istituto degli Endotipi in Oncologia, Metabolismo e Immunologia “G. Salvatore” – Consiglio Nazionale delle Ricerche, Napoli, Italy.
3Unità di Neuroimmunologia, IRCCS Fondazione Santa Lucia, Roma, Italy.
4Deutsches Herzzentrum der Charité – Charité-Universitätsmedizin, Berlin, Germany.
5Department of Experimental Oncology, European Institute of Oncology (IEO) IRCCS, Milan, Italy.
6Department of Immunology and Infection, Hasselt University, Diepenbeek, Belgium.
7University MS Center, Pelt, Belgium.
8Dipartimento Assistenziale Integrato de Medicina di Laboratorio e Trasfusionale, Azienda Ospedaliera Universitaria “Federico II,” Napoli, Italy.
9Department of Pharmaceutical Sciences, University of Perugia, Perugia, Italy.
10Treg Cell Lab, Dipartimento di Medicina Molecolare e Biotecnologie Mediche, Università degli Studi di Napoli “Federico II,” Napoli, Italy.
Address correspondence to: Fabrizia Bonacina, Department of Excellence of Pharmacological and Biomolecular Sciences “Rodolfo Paoletti,” Università degli Studi di Milano, via Giuseppe Balzaretti 9 20133, Milan, Italy. Phone: 0039.0250318259; Email: fabrizia.bonacina@unimi.it.
Authorship note: MI and AM contributed equally to this work.
Find articles by Iaia, M. in: PubMed | Google Scholar
1Department of Excellence of Pharmacological and Biomolecular Sciences “Rodolfo Paoletti,” Università degli Studi di Milano, Milan, Italy.
2Laboratorio di Immunologia, Istituto degli Endotipi in Oncologia, Metabolismo e Immunologia “G. Salvatore” – Consiglio Nazionale delle Ricerche, Napoli, Italy.
3Unità di Neuroimmunologia, IRCCS Fondazione Santa Lucia, Roma, Italy.
4Deutsches Herzzentrum der Charité – Charité-Universitätsmedizin, Berlin, Germany.
5Department of Experimental Oncology, European Institute of Oncology (IEO) IRCCS, Milan, Italy.
6Department of Immunology and Infection, Hasselt University, Diepenbeek, Belgium.
7University MS Center, Pelt, Belgium.
8Dipartimento Assistenziale Integrato de Medicina di Laboratorio e Trasfusionale, Azienda Ospedaliera Universitaria “Federico II,” Napoli, Italy.
9Department of Pharmaceutical Sciences, University of Perugia, Perugia, Italy.
10Treg Cell Lab, Dipartimento di Medicina Molecolare e Biotecnologie Mediche, Università degli Studi di Napoli “Federico II,” Napoli, Italy.
Address correspondence to: Fabrizia Bonacina, Department of Excellence of Pharmacological and Biomolecular Sciences “Rodolfo Paoletti,” Università degli Studi di Milano, via Giuseppe Balzaretti 9 20133, Milan, Italy. Phone: 0039.0250318259; Email: fabrizia.bonacina@unimi.it.
Authorship note: MI and AM contributed equally to this work.
Find articles by Moretti, A. in: PubMed | Google Scholar
1Department of Excellence of Pharmacological and Biomolecular Sciences “Rodolfo Paoletti,” Università degli Studi di Milano, Milan, Italy.
2Laboratorio di Immunologia, Istituto degli Endotipi in Oncologia, Metabolismo e Immunologia “G. Salvatore” – Consiglio Nazionale delle Ricerche, Napoli, Italy.
3Unità di Neuroimmunologia, IRCCS Fondazione Santa Lucia, Roma, Italy.
4Deutsches Herzzentrum der Charité – Charité-Universitätsmedizin, Berlin, Germany.
5Department of Experimental Oncology, European Institute of Oncology (IEO) IRCCS, Milan, Italy.
6Department of Immunology and Infection, Hasselt University, Diepenbeek, Belgium.
7University MS Center, Pelt, Belgium.
8Dipartimento Assistenziale Integrato de Medicina di Laboratorio e Trasfusionale, Azienda Ospedaliera Universitaria “Federico II,” Napoli, Italy.
9Department of Pharmaceutical Sciences, University of Perugia, Perugia, Italy.
10Treg Cell Lab, Dipartimento di Medicina Molecolare e Biotecnologie Mediche, Università degli Studi di Napoli “Federico II,” Napoli, Italy.
Address correspondence to: Fabrizia Bonacina, Department of Excellence of Pharmacological and Biomolecular Sciences “Rodolfo Paoletti,” Università degli Studi di Milano, via Giuseppe Balzaretti 9 20133, Milan, Italy. Phone: 0039.0250318259; Email: fabrizia.bonacina@unimi.it.
Authorship note: MI and AM contributed equally to this work.
Find articles by Svecla, M. in: PubMed | Google Scholar
1Department of Excellence of Pharmacological and Biomolecular Sciences “Rodolfo Paoletti,” Università degli Studi di Milano, Milan, Italy.
2Laboratorio di Immunologia, Istituto degli Endotipi in Oncologia, Metabolismo e Immunologia “G. Salvatore” – Consiglio Nazionale delle Ricerche, Napoli, Italy.
3Unità di Neuroimmunologia, IRCCS Fondazione Santa Lucia, Roma, Italy.
4Deutsches Herzzentrum der Charité – Charité-Universitätsmedizin, Berlin, Germany.
5Department of Experimental Oncology, European Institute of Oncology (IEO) IRCCS, Milan, Italy.
6Department of Immunology and Infection, Hasselt University, Diepenbeek, Belgium.
7University MS Center, Pelt, Belgium.
8Dipartimento Assistenziale Integrato de Medicina di Laboratorio e Trasfusionale, Azienda Ospedaliera Universitaria “Federico II,” Napoli, Italy.
9Department of Pharmaceutical Sciences, University of Perugia, Perugia, Italy.
10Treg Cell Lab, Dipartimento di Medicina Molecolare e Biotecnologie Mediche, Università degli Studi di Napoli “Federico II,” Napoli, Italy.
Address correspondence to: Fabrizia Bonacina, Department of Excellence of Pharmacological and Biomolecular Sciences “Rodolfo Paoletti,” Università degli Studi di Milano, via Giuseppe Balzaretti 9 20133, Milan, Italy. Phone: 0039.0250318259; Email: fabrizia.bonacina@unimi.it.
Authorship note: MI and AM contributed equally to this work.
Find articles by Pedretti, S. in: PubMed | Google Scholar
1Department of Excellence of Pharmacological and Biomolecular Sciences “Rodolfo Paoletti,” Università degli Studi di Milano, Milan, Italy.
2Laboratorio di Immunologia, Istituto degli Endotipi in Oncologia, Metabolismo e Immunologia “G. Salvatore” – Consiglio Nazionale delle Ricerche, Napoli, Italy.
3Unità di Neuroimmunologia, IRCCS Fondazione Santa Lucia, Roma, Italy.
4Deutsches Herzzentrum der Charité – Charité-Universitätsmedizin, Berlin, Germany.
5Department of Experimental Oncology, European Institute of Oncology (IEO) IRCCS, Milan, Italy.
6Department of Immunology and Infection, Hasselt University, Diepenbeek, Belgium.
7University MS Center, Pelt, Belgium.
8Dipartimento Assistenziale Integrato de Medicina di Laboratorio e Trasfusionale, Azienda Ospedaliera Universitaria “Federico II,” Napoli, Italy.
9Department of Pharmaceutical Sciences, University of Perugia, Perugia, Italy.
10Treg Cell Lab, Dipartimento di Medicina Molecolare e Biotecnologie Mediche, Università degli Studi di Napoli “Federico II,” Napoli, Italy.
Address correspondence to: Fabrizia Bonacina, Department of Excellence of Pharmacological and Biomolecular Sciences “Rodolfo Paoletti,” Università degli Studi di Milano, via Giuseppe Balzaretti 9 20133, Milan, Italy. Phone: 0039.0250318259; Email: fabrizia.bonacina@unimi.it.
Authorship note: MI and AM contributed equally to this work.
Find articles by Bogie, J. in: PubMed | Google Scholar
1Department of Excellence of Pharmacological and Biomolecular Sciences “Rodolfo Paoletti,” Università degli Studi di Milano, Milan, Italy.
2Laboratorio di Immunologia, Istituto degli Endotipi in Oncologia, Metabolismo e Immunologia “G. Salvatore” – Consiglio Nazionale delle Ricerche, Napoli, Italy.
3Unità di Neuroimmunologia, IRCCS Fondazione Santa Lucia, Roma, Italy.
4Deutsches Herzzentrum der Charité – Charité-Universitätsmedizin, Berlin, Germany.
5Department of Experimental Oncology, European Institute of Oncology (IEO) IRCCS, Milan, Italy.
6Department of Immunology and Infection, Hasselt University, Diepenbeek, Belgium.
7University MS Center, Pelt, Belgium.
8Dipartimento Assistenziale Integrato de Medicina di Laboratorio e Trasfusionale, Azienda Ospedaliera Universitaria “Federico II,” Napoli, Italy.
9Department of Pharmaceutical Sciences, University of Perugia, Perugia, Italy.
10Treg Cell Lab, Dipartimento di Medicina Molecolare e Biotecnologie Mediche, Università degli Studi di Napoli “Federico II,” Napoli, Italy.
Address correspondence to: Fabrizia Bonacina, Department of Excellence of Pharmacological and Biomolecular Sciences “Rodolfo Paoletti,” Università degli Studi di Milano, via Giuseppe Balzaretti 9 20133, Milan, Italy. Phone: 0039.0250318259; Email: fabrizia.bonacina@unimi.it.
Authorship note: MI and AM contributed equally to this work.
Find articles by Vingiani, G. in: PubMed | Google Scholar
1Department of Excellence of Pharmacological and Biomolecular Sciences “Rodolfo Paoletti,” Università degli Studi di Milano, Milan, Italy.
2Laboratorio di Immunologia, Istituto degli Endotipi in Oncologia, Metabolismo e Immunologia “G. Salvatore” – Consiglio Nazionale delle Ricerche, Napoli, Italy.
3Unità di Neuroimmunologia, IRCCS Fondazione Santa Lucia, Roma, Italy.
4Deutsches Herzzentrum der Charité – Charité-Universitätsmedizin, Berlin, Germany.
5Department of Experimental Oncology, European Institute of Oncology (IEO) IRCCS, Milan, Italy.
6Department of Immunology and Infection, Hasselt University, Diepenbeek, Belgium.
7University MS Center, Pelt, Belgium.
8Dipartimento Assistenziale Integrato de Medicina di Laboratorio e Trasfusionale, Azienda Ospedaliera Universitaria “Federico II,” Napoli, Italy.
9Department of Pharmaceutical Sciences, University of Perugia, Perugia, Italy.
10Treg Cell Lab, Dipartimento di Medicina Molecolare e Biotecnologie Mediche, Università degli Studi di Napoli “Federico II,” Napoli, Italy.
Address correspondence to: Fabrizia Bonacina, Department of Excellence of Pharmacological and Biomolecular Sciences “Rodolfo Paoletti,” Università degli Studi di Milano, via Giuseppe Balzaretti 9 20133, Milan, Italy. Phone: 0039.0250318259; Email: fabrizia.bonacina@unimi.it.
Authorship note: MI and AM contributed equally to this work.
Find articles by Moregola, A. in: PubMed | Google Scholar
1Department of Excellence of Pharmacological and Biomolecular Sciences “Rodolfo Paoletti,” Università degli Studi di Milano, Milan, Italy.
2Laboratorio di Immunologia, Istituto degli Endotipi in Oncologia, Metabolismo e Immunologia “G. Salvatore” – Consiglio Nazionale delle Ricerche, Napoli, Italy.
3Unità di Neuroimmunologia, IRCCS Fondazione Santa Lucia, Roma, Italy.
4Deutsches Herzzentrum der Charité – Charité-Universitätsmedizin, Berlin, Germany.
5Department of Experimental Oncology, European Institute of Oncology (IEO) IRCCS, Milan, Italy.
6Department of Immunology and Infection, Hasselt University, Diepenbeek, Belgium.
7University MS Center, Pelt, Belgium.
8Dipartimento Assistenziale Integrato de Medicina di Laboratorio e Trasfusionale, Azienda Ospedaliera Universitaria “Federico II,” Napoli, Italy.
9Department of Pharmaceutical Sciences, University of Perugia, Perugia, Italy.
10Treg Cell Lab, Dipartimento di Medicina Molecolare e Biotecnologie Mediche, Università degli Studi di Napoli “Federico II,” Napoli, Italy.
Address correspondence to: Fabrizia Bonacina, Department of Excellence of Pharmacological and Biomolecular Sciences “Rodolfo Paoletti,” Università degli Studi di Milano, via Giuseppe Balzaretti 9 20133, Milan, Italy. Phone: 0039.0250318259; Email: fabrizia.bonacina@unimi.it.
Authorship note: MI and AM contributed equally to this work.
Find articles by Genova, F. in: PubMed | Google Scholar
1Department of Excellence of Pharmacological and Biomolecular Sciences “Rodolfo Paoletti,” Università degli Studi di Milano, Milan, Italy.
2Laboratorio di Immunologia, Istituto degli Endotipi in Oncologia, Metabolismo e Immunologia “G. Salvatore” – Consiglio Nazionale delle Ricerche, Napoli, Italy.
3Unità di Neuroimmunologia, IRCCS Fondazione Santa Lucia, Roma, Italy.
4Deutsches Herzzentrum der Charité – Charité-Universitätsmedizin, Berlin, Germany.
5Department of Experimental Oncology, European Institute of Oncology (IEO) IRCCS, Milan, Italy.
6Department of Immunology and Infection, Hasselt University, Diepenbeek, Belgium.
7University MS Center, Pelt, Belgium.
8Dipartimento Assistenziale Integrato de Medicina di Laboratorio e Trasfusionale, Azienda Ospedaliera Universitaria “Federico II,” Napoli, Italy.
9Department of Pharmaceutical Sciences, University of Perugia, Perugia, Italy.
10Treg Cell Lab, Dipartimento di Medicina Molecolare e Biotecnologie Mediche, Università degli Studi di Napoli “Federico II,” Napoli, Italy.
Address correspondence to: Fabrizia Bonacina, Department of Excellence of Pharmacological and Biomolecular Sciences “Rodolfo Paoletti,” Università degli Studi di Milano, via Giuseppe Balzaretti 9 20133, Milan, Italy. Phone: 0039.0250318259; Email: fabrizia.bonacina@unimi.it.
Authorship note: MI and AM contributed equally to this work.
Find articles by Russo, C. in: PubMed | Google Scholar
1Department of Excellence of Pharmacological and Biomolecular Sciences “Rodolfo Paoletti,” Università degli Studi di Milano, Milan, Italy.
2Laboratorio di Immunologia, Istituto degli Endotipi in Oncologia, Metabolismo e Immunologia “G. Salvatore” – Consiglio Nazionale delle Ricerche, Napoli, Italy.
3Unità di Neuroimmunologia, IRCCS Fondazione Santa Lucia, Roma, Italy.
4Deutsches Herzzentrum der Charité – Charité-Universitätsmedizin, Berlin, Germany.
5Department of Experimental Oncology, European Institute of Oncology (IEO) IRCCS, Milan, Italy.
6Department of Immunology and Infection, Hasselt University, Diepenbeek, Belgium.
7University MS Center, Pelt, Belgium.
8Dipartimento Assistenziale Integrato de Medicina di Laboratorio e Trasfusionale, Azienda Ospedaliera Universitaria “Federico II,” Napoli, Italy.
9Department of Pharmaceutical Sciences, University of Perugia, Perugia, Italy.
10Treg Cell Lab, Dipartimento di Medicina Molecolare e Biotecnologie Mediche, Università degli Studi di Napoli “Federico II,” Napoli, Italy.
Address correspondence to: Fabrizia Bonacina, Department of Excellence of Pharmacological and Biomolecular Sciences “Rodolfo Paoletti,” Università degli Studi di Milano, via Giuseppe Balzaretti 9 20133, Milan, Italy. Phone: 0039.0250318259; Email: fabrizia.bonacina@unimi.it.
Authorship note: MI and AM contributed equally to this work.
Find articles by De Rosa, G. in: PubMed | Google Scholar
1Department of Excellence of Pharmacological and Biomolecular Sciences “Rodolfo Paoletti,” Università degli Studi di Milano, Milan, Italy.
2Laboratorio di Immunologia, Istituto degli Endotipi in Oncologia, Metabolismo e Immunologia “G. Salvatore” – Consiglio Nazionale delle Ricerche, Napoli, Italy.
3Unità di Neuroimmunologia, IRCCS Fondazione Santa Lucia, Roma, Italy.
4Deutsches Herzzentrum der Charité – Charité-Universitätsmedizin, Berlin, Germany.
5Department of Experimental Oncology, European Institute of Oncology (IEO) IRCCS, Milan, Italy.
6Department of Immunology and Infection, Hasselt University, Diepenbeek, Belgium.
7University MS Center, Pelt, Belgium.
8Dipartimento Assistenziale Integrato de Medicina di Laboratorio e Trasfusionale, Azienda Ospedaliera Universitaria “Federico II,” Napoli, Italy.
9Department of Pharmaceutical Sciences, University of Perugia, Perugia, Italy.
10Treg Cell Lab, Dipartimento di Medicina Molecolare e Biotecnologie Mediche, Università degli Studi di Napoli “Federico II,” Napoli, Italy.
Address correspondence to: Fabrizia Bonacina, Department of Excellence of Pharmacological and Biomolecular Sciences “Rodolfo Paoletti,” Università degli Studi di Milano, via Giuseppe Balzaretti 9 20133, Milan, Italy. Phone: 0039.0250318259; Email: fabrizia.bonacina@unimi.it.
Authorship note: MI and AM contributed equally to this work.
Find articles by La Rocca, C. in: PubMed | Google Scholar
1Department of Excellence of Pharmacological and Biomolecular Sciences “Rodolfo Paoletti,” Università degli Studi di Milano, Milan, Italy.
2Laboratorio di Immunologia, Istituto degli Endotipi in Oncologia, Metabolismo e Immunologia “G. Salvatore” – Consiglio Nazionale delle Ricerche, Napoli, Italy.
3Unità di Neuroimmunologia, IRCCS Fondazione Santa Lucia, Roma, Italy.
4Deutsches Herzzentrum der Charité – Charité-Universitätsmedizin, Berlin, Germany.
5Department of Experimental Oncology, European Institute of Oncology (IEO) IRCCS, Milan, Italy.
6Department of Immunology and Infection, Hasselt University, Diepenbeek, Belgium.
7University MS Center, Pelt, Belgium.
8Dipartimento Assistenziale Integrato de Medicina di Laboratorio e Trasfusionale, Azienda Ospedaliera Universitaria “Federico II,” Napoli, Italy.
9Department of Pharmaceutical Sciences, University of Perugia, Perugia, Italy.
10Treg Cell Lab, Dipartimento di Medicina Molecolare e Biotecnologie Mediche, Università degli Studi di Napoli “Federico II,” Napoli, Italy.
Address correspondence to: Fabrizia Bonacina, Department of Excellence of Pharmacological and Biomolecular Sciences “Rodolfo Paoletti,” Università degli Studi di Milano, via Giuseppe Balzaretti 9 20133, Milan, Italy. Phone: 0039.0250318259; Email: fabrizia.bonacina@unimi.it.
Authorship note: MI and AM contributed equally to this work.
Find articles by
Mondanelli, G.
in:
PubMed
|
Google Scholar
|
1Department of Excellence of Pharmacological and Biomolecular Sciences “Rodolfo Paoletti,” Università degli Studi di Milano, Milan, Italy.
2Laboratorio di Immunologia, Istituto degli Endotipi in Oncologia, Metabolismo e Immunologia “G. Salvatore” – Consiglio Nazionale delle Ricerche, Napoli, Italy.
3Unità di Neuroimmunologia, IRCCS Fondazione Santa Lucia, Roma, Italy.
4Deutsches Herzzentrum der Charité – Charité-Universitätsmedizin, Berlin, Germany.
5Department of Experimental Oncology, European Institute of Oncology (IEO) IRCCS, Milan, Italy.
6Department of Immunology and Infection, Hasselt University, Diepenbeek, Belgium.
7University MS Center, Pelt, Belgium.
8Dipartimento Assistenziale Integrato de Medicina di Laboratorio e Trasfusionale, Azienda Ospedaliera Universitaria “Federico II,” Napoli, Italy.
9Department of Pharmaceutical Sciences, University of Perugia, Perugia, Italy.
10Treg Cell Lab, Dipartimento di Medicina Molecolare e Biotecnologie Mediche, Università degli Studi di Napoli “Federico II,” Napoli, Italy.
Address correspondence to: Fabrizia Bonacina, Department of Excellence of Pharmacological and Biomolecular Sciences “Rodolfo Paoletti,” Università degli Studi di Milano, via Giuseppe Balzaretti 9 20133, Milan, Italy. Phone: 0039.0250318259; Email: fabrizia.bonacina@unimi.it.
Authorship note: MI and AM contributed equally to this work.
Find articles by
Gargaro, M.
in:
PubMed
|
Google Scholar
|
1Department of Excellence of Pharmacological and Biomolecular Sciences “Rodolfo Paoletti,” Università degli Studi di Milano, Milan, Italy.
2Laboratorio di Immunologia, Istituto degli Endotipi in Oncologia, Metabolismo e Immunologia “G. Salvatore” – Consiglio Nazionale delle Ricerche, Napoli, Italy.
3Unità di Neuroimmunologia, IRCCS Fondazione Santa Lucia, Roma, Italy.
4Deutsches Herzzentrum der Charité – Charité-Universitätsmedizin, Berlin, Germany.
5Department of Experimental Oncology, European Institute of Oncology (IEO) IRCCS, Milan, Italy.
6Department of Immunology and Infection, Hasselt University, Diepenbeek, Belgium.
7University MS Center, Pelt, Belgium.
8Dipartimento Assistenziale Integrato de Medicina di Laboratorio e Trasfusionale, Azienda Ospedaliera Universitaria “Federico II,” Napoli, Italy.
9Department of Pharmaceutical Sciences, University of Perugia, Perugia, Italy.
10Treg Cell Lab, Dipartimento di Medicina Molecolare e Biotecnologie Mediche, Università degli Studi di Napoli “Federico II,” Napoli, Italy.
Address correspondence to: Fabrizia Bonacina, Department of Excellence of Pharmacological and Biomolecular Sciences “Rodolfo Paoletti,” Università degli Studi di Milano, via Giuseppe Balzaretti 9 20133, Milan, Italy. Phone: 0039.0250318259; Email: fabrizia.bonacina@unimi.it.
Authorship note: MI and AM contributed equally to this work.
Find articles by
Mitro, N.
in:
PubMed
|
Google Scholar
|
1Department of Excellence of Pharmacological and Biomolecular Sciences “Rodolfo Paoletti,” Università degli Studi di Milano, Milan, Italy.
2Laboratorio di Immunologia, Istituto degli Endotipi in Oncologia, Metabolismo e Immunologia “G. Salvatore” – Consiglio Nazionale delle Ricerche, Napoli, Italy.
3Unità di Neuroimmunologia, IRCCS Fondazione Santa Lucia, Roma, Italy.
4Deutsches Herzzentrum der Charité – Charité-Universitätsmedizin, Berlin, Germany.
5Department of Experimental Oncology, European Institute of Oncology (IEO) IRCCS, Milan, Italy.
6Department of Immunology and Infection, Hasselt University, Diepenbeek, Belgium.
7University MS Center, Pelt, Belgium.
8Dipartimento Assistenziale Integrato de Medicina di Laboratorio e Trasfusionale, Azienda Ospedaliera Universitaria “Federico II,” Napoli, Italy.
9Department of Pharmaceutical Sciences, University of Perugia, Perugia, Italy.
10Treg Cell Lab, Dipartimento di Medicina Molecolare e Biotecnologie Mediche, Università degli Studi di Napoli “Federico II,” Napoli, Italy.
Address correspondence to: Fabrizia Bonacina, Department of Excellence of Pharmacological and Biomolecular Sciences “Rodolfo Paoletti,” Università degli Studi di Milano, via Giuseppe Balzaretti 9 20133, Milan, Italy. Phone: 0039.0250318259; Email: fabrizia.bonacina@unimi.it.
Authorship note: MI and AM contributed equally to this work.
Find articles by
Matarese, G.
in:
PubMed
|
Google Scholar
|
1Department of Excellence of Pharmacological and Biomolecular Sciences “Rodolfo Paoletti,” Università degli Studi di Milano, Milan, Italy.
2Laboratorio di Immunologia, Istituto degli Endotipi in Oncologia, Metabolismo e Immunologia “G. Salvatore” – Consiglio Nazionale delle Ricerche, Napoli, Italy.
3Unità di Neuroimmunologia, IRCCS Fondazione Santa Lucia, Roma, Italy.
4Deutsches Herzzentrum der Charité – Charité-Universitätsmedizin, Berlin, Germany.
5Department of Experimental Oncology, European Institute of Oncology (IEO) IRCCS, Milan, Italy.
6Department of Immunology and Infection, Hasselt University, Diepenbeek, Belgium.
7University MS Center, Pelt, Belgium.
8Dipartimento Assistenziale Integrato de Medicina di Laboratorio e Trasfusionale, Azienda Ospedaliera Universitaria “Federico II,” Napoli, Italy.
9Department of Pharmaceutical Sciences, University of Perugia, Perugia, Italy.
10Treg Cell Lab, Dipartimento di Medicina Molecolare e Biotecnologie Mediche, Università degli Studi di Napoli “Federico II,” Napoli, Italy.
Address correspondence to: Fabrizia Bonacina, Department of Excellence of Pharmacological and Biomolecular Sciences “Rodolfo Paoletti,” Università degli Studi di Milano, via Giuseppe Balzaretti 9 20133, Milan, Italy. Phone: 0039.0250318259; Email: fabrizia.bonacina@unimi.it.
Authorship note: MI and AM contributed equally to this work.
Find articles by
Norata, G.
in:
PubMed
|
Google Scholar
|
Published July 21, 2026 - More info
J Clin Invest. 2026;136(17):e201325. https://doi.org/10.1172/JCI201325.
© 2026 Bonacina et al. This work is licensed under the Creative Commons Attribution 4.0 International License. To view a copy of this license, visit http://creativecommons.org/licenses/by/4.0/.
Received: October 15, 2025; Accepted: July 2, 2026


-
Results
Srebp1c deficiency worsens Treg immunosuppressive phenotype. To investigate the role of SREBP1c in Treg biology, we purified CD4+CD25+ cells from the spleens of Srebp1c WT and -KO mice, which were confirmed to be Tregs by FoxP3 expression (Figure 1A), to perform in vitro and in vivo functional assays. Ex vivo–isolated CD4+CD25+ Tregs from Srebp1c-KO mice, when cocultured at increasing ratios with CD4+CD25– conventional T cells (Tconv), were less efficient in suppressing Tconv proliferation as compared with those from WT mice (Figure 1B), suggesting a functional impairment in Treg suppressive potency in the absence of SREBP1c. We further validated this dysfunctional phenotype by assessing the ability of purified CD25+ cells (Tregs) to ameliorate the severity of experimental autoimmune encephalomyelitis (EAE), an autoimmune-mediated demyelinating disease of the CNS. Tregs isolated from either WT or KO mice were injected into C57BL/6J-FOXP3 reporter recipients 16 hours prior to EAE induction. Disease progression was monitored compared with that in mice receiving vehicle (saline) (Figure 1C). The administration of WT Tregs was able to significantly attenuate EAE progression (Figure 1D), as evidenced by a marked reduction in both the maximal and cumulative EAE disease scores compared with the vehicle control group (Figure 1E). Conversely, mice that received Srebp1c-KO Tregs exhibited disease scores that were not different from those of the saline group (Figure 1, D and E), thus indicating that, unlike WT Tregs, Srebp1c-deficient Tregs do not significantly ameliorate EAE severity. Consistent with these findings, the immunoinflammatory infiltrate was reduced in the CNS of EAE mice treated with WT Tregs, as suggested by the decreased frequency of CD45+ leukocytes (including both CD4+ and CD8+ T cells), but not in those treated with Srebp1c-KO Tregs (Figure 1F). This effect was paralleled by a similar frequency of recipient Tregs (identified as GFP+ cells) in the spleens of mice treated with Srebp1c-KO Tregs and those receiving saline, whereas a higher frequency was observed in mice receiving WT Tregs (Supplemental Figure 1A; supplemental material available online with this article; https://doi.org/10.1172/JCI201325DS1), suggesting the establishment of a tolerogenic environment. In line with this, the expression of Treg-associated suppressive markers (PD-1, Tigit, CTLA-4, CD62L, CD69, and CCR7) was positively regulated in WT Treg-treated mice, with PD-1 and CD62L reaching a statistically significant difference compared with mice receiving Srebp1c-KO Tregs (Supplemental Figure 1B). Furthermore, following in vitro cognate antigen-specific stimulation of splenocytes isolated from EAE mice, myelin oligodendrocyte glycoprotein peptide 35–55 (MOG35–55) reactive–CD4+ T cells from mice treated with Srebp1c-KO Tregs displayed higher expression of activation markers (CD25, CD69, and CD71) compared with those from mice receiving WT Tregs (Figure 1G). In parallel, polyclonal stimulation with anti-CD3 of splenocytes from EAE mice resulted in a significant reduction of OX-40 only in CD4+ T cells of mice that received WT Tregs compared with saline-treated controls (Supplemental Figure 1C). In contrast, mice receiving Srebp1c-KO Tregs, did not show this trend, with a superimposable expression of CD25, CD69, and OX-40 in activated CD4+ T cells compared with mice receiving saline, pointing to an impaired potency of Srebp1c-deficient Tregs in controlling systemic immune response upon EAE induction.
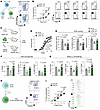 Figure 1
Tregs from Srebp1c-KO mice showed an impaired suppressive function. (A) Graphic representation of ex vivo Tregs purified as CD25+ from CD4+ T cells; a representative flow cytometry dot plot of live isolated cells expressing CD4/CD25/FOXP3 is shown. (B) Suppression of CD4+CD25– (Tconv) proliferation by freshly isolated Tregs (CD25+) from lymphoid tissues of Srebp1c-KO and WT mice cultured at different ratios (0:1 indicates that no Tregs were used, while 1:8, 1:4 1:2, and 1:1 indicate the proportion of Tregs to Tconv) for 4 days. Representative histograms from flow cytometry are shown. (C) Graphic representation of the EAE protocol: FOXP3-reporter (B6.Cg-Foxp3tm2Tch/J) mice received purified WT or Srebp1c-KO Tregs, or saline as control (vehicle), and thereafter were immunized with MOG and pertussis toxin. (D and E) Daily recorded EAE clinical score (D) and relative parameters (E) AUC of clinical, maximal, and cumulative scores) of EAE mice treated as indicated in D. (F) Immune infiltrate of total leukocytes (CD45hi) and T cell subsets (CD4 and CD8) in the CNS of EAE mice treated as indicated in D, 20 days after MOG35–55 immunization. (G) Expression of activation markers in CD4+ T cells in splenocytes isolated from EAE mice and in vitro rechallenged with MOG35–55 peptide 20 days after MOG35–55 immunization. (H) In vitro–induced Tregs (iTregs) were differentiated from CD4+CD25– cells by culture with IL-2 (100 U/mL) and TGF-β (5 ng/mL) for 4 days. Representative dot plots of CD25 and FOXP3 expression from flow cytometry of iTregs are shown. (I) Suppression of Tconv proliferation by WT and Srebp1c-KO iTregs for 3 days. Representative histograms from flow cytometry are shown. N = 4–10/group. Data are presented as mean ± SEM. Statistical analysis has been performed with multiple Mann-Whitney tests (B and I), 2-way ANOVA multiple comparisons (D), and 1-way ANOVA Kruskal-Wallis test (E–G).
Given that Srebp1c hepatic deficiency reduces systemic triglyceride (TG) and cholesterol levels (11), we next sought to exclude the effect of systemic lipid metabolism on Treg phenotype. To this end, we investigated the phenotype of Tregs differentiated in vitro (iTregs) from that of conventional CD4+ T cells. CD4+CD25– cells were isolated from the lymph nodes of Srebp1c-KO or WT mice and stimulated with anti-CD3/28 antibodies in the presence of a high dose of IL-2 and TGF-β (Figure 1H). This approach resulted in nearly 90% of viable CD4+ cells expressing both CD25 and FOXP3 in both WT and Srebp1c-KO cells (Figure 1H). Even under this experimental setting (thereby eliminating the contribution of systemic lipid metabolism), Srebp1c-KO iTregs exhibited reduced immunosuppressive function compared with that of WT iTregs, as demonstrated by their impaired ability to dampen cell proliferation at increasing iTreg-to-Tconv ratios in coculture assays (Figure 1I).
To further corroborate the impaired ability of Srebp1c-KO Tregs to counteract immunoinflammatory responses, we used the 2,4,6-trinitrobenzene sulfonic acid–induced (TNBS-induced) colitis model, a well-established model of Th1/Th17-driven transmural inflammation that recapitulates key features of human Crohn’s disease (12, 13). Disease severity was monitored by assessing body weight loss and inflammatory parameters in the colon. Intrarectal administration of TNBS induced significant weight loss compared with that of vehicle-treated control mice (Supplemental Figure 2, A and B). Adoptive transfer of WT Tregs (CD25+) partially attenuated weight reduction, with a significant improvement observed at days 2 and 3 after induction. In contrast, the weight-loss profiles of mice receiving Srebp1c-KO Tregs (CD25+) were more similar to those of untreated colitic mice (Supplemental Figure 2, A and B). These findings were supported by colon length shortening in the TNBS and TNBS + Treg-KO groups compared with the TNBS + Treg WT and vehicle groups (Supplemental Figure 2C) and by a substantial reduction in the production of proinflammatory cytokines, including IL-17A, IFN-γ, and IL-6, in mice receiving WT, but not KO, Tregs. (Supplemental Figure 2, D–F). Notably, no significant differences in IL-10 levels were detected among the experimental groups (Supplemental Figure 2G), suggesting that the observed effects may be primarily associated with modulation of proinflammatory cytokine production. Overall, these results support the observation that Srebp1c deficiency may impair the immunosuppressive function of Tregs, thereby reducing their protective capacity under immunoinflammatory challenges.
Taken together, these findings underlined a reduced suppressive potency under Srebp1c deficient conditions, suggesting a key role for this TF in controlling Treg function.
Srebp1c deficiency results in an impaired Treg distribution and phenotype in vivo. To follow up on the functional characterization, we next investigated whether Srebp1c deficiency affected Treg distribution and phenotype under homeostatic conditions in vivo. Circulating levels of CD4+CD25hiFoxP3+ Tregs were markedly reduced in KO mice compared with WT littermates (Figure 2A and Supplemental Figure 3A). Similarly, while in the spleens the absolute counts of CD4+ and CD8+ T cells were not affected by Srebp1c deficiency (Figure 2, B and C, and Supplemental Figure 3B), CD4+CD25hiFoxP3+ Tregs were significantly decreased in KO compared with WT mice (Figure 2, B and D, and Supplemental Figure 3B). Notably, we observed a decreased frequency of both CD25+FoxP3+ and CD25–FoxP3+ Tregs in the spleens of Srebp1c-KO compared with WT mice (Supplemental Figure 3C). However, the distribution of naive and memory subsets was largely comparable between WT and KO mice (Supplemental Figure 3, D and E). To figure out whether reduced Treg levels resulted from an impaired thymic development, we analyzed Treg differentiation within single-positive CD4+ T cells tracking the expression of CD25, FOXP3, CD62L, and CD44 as markers of T cell maturation and distribution in secondary lymphoid organs (Figure 2E). In the thymi of Srebp1c-KO mice, we observed an increased frequency of the double-positive population (CD4+CD8+), and a slight reduction of single-positive CD4+ T cells (Supplemental Figure 3F), with no difference in the distribution between double-negative subpopulations (based on CD25 and CD44 expression; data not shown). Notably, Srebp1c-KO mice exhibited a significantly less prevalence of CD25+FOXP3+ cells and higher prevalence of CD25–FOXP3– cells compared with WT mice, with no difference in the intermediate Treg subsets (CD25–FOXP3+ and CD25+FOXP3–) (Figure 2F). The comparable frequencies of naive, central, and effector memory subsets between KO and WT mature Tregs (Figure 2G) also excluded defects in Treg-antigen priming and trafficking between lymphoid organs and instead showed an impairment in the maturation to CD25hiFOXP3+ cells. Indeed, a comparable expression of the lineage-defining TFs RORγt, GATA3, and T-BET — associated with Th17, Th2, and Th1 subsets (14), respectively — was detected in peripheral CD4+ T cells from WT and Srebp1c-KO mice, whereas only the frequency of FOXP3+ cells was significantly reduced in Srebp1c-deficient CD4+ T cells (Figure 2H).
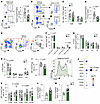 Figure 2
Srebp1c deficiency results in an impaired Treg distribution and phenotype. (A) Representative plots from flow cytometry showing CD25 and FOXP3 expression on CD4+ T cells in circulation and absolute count of Tregs (CD25hiFOXP3+). (B) Representative plots from flow cytometry showing CD4 and CD8 expression from total live leukocytes (CD45) and CD25 and FOXP3 on CD4+ T cells. (C and D) Numbers of CD4+ and CD8+ T cells (C) and Tregs (D) corrected for spleen weights. (E) Gating strategy used to identify Treg subsets in the thymus. (F) Frequency of thymic precursors and mature Tregs depending on the expression of CD25 and FOXP3. (G) Frequency of thymic naive (CD62L+CD44–), central memory (CD62L+CD44+) and effector memory (CD62L–CD44+) cells. (H) Frequency of FOXP3+, RORγT+, GATA3+, and T-BET+ in splenic CD4+ T cells. (I) Fold of expression of CD25 receptor within the splenic CD4+FOXP3+ population corrected to WT values; a representative histogram of CD25 expression within the FOXP3+ cells is shown. (J) Expression of markers of Treg stability (HELIOS), activation (KI67, CD69, LFA-1, GITR), and suppressive function (PD-1, CTLA-4, CD39, and CD73) in the spleens. Data are presented as log2 fold change (FC) of expression compared with WT: the size of the dot indicates the statistical significance, while colors indicate the log2FC (red for upregulated proteins, blue for downregulated proteins). (K) Expression of the chemokine receptors CCR2, CCR3, CCR5, CCR7, and CXCR3 in circulating Tregs. (L and M) In vitro migration assay of ex vivo–isolated Tregs (CD25+) toward CCL19 (L) and CXCL10 (M) chemokines after 3 hours of incubation in 24-well plate Transwells inserts. Results are corrected versus spontaneous (basal) migration toward the medium. Data are presented as mean ± SEM. N = 5–13/group. Statistical analysis has been performed with unpaired nonparametric t test (A, D, and J–N) or 2-way ANOVA (C and F–H).
We excluded that the reduced frequency of CD4+CD25hiFOXP3+ Tregs resulted from a different tolerogenic polarization by myeloid cells, as no changes were observed in the frequencies of DCs and macrophages (Supplemental Figure 3G) or in the capacity of purified splenic CD11c+ cells to polarize allogeneic CD4+ T cells toward a specific T helper phenotype (Supplemental Figure 3H). This evidence further supported the notion that SREBP1c plays an intrinsic role in Treg biology. Furthermore, the expression of CD25, a key receptor protein involved in Treg suppressive function, was significantly reduced in Srebp1c-KO Tregs compared with WT cells (Figure 2I). This was paralleled by reduced expression of markers associated with Treg phenotype, such as HELIOS, PD-1, and CD73, with the first usually associated with Treg stability and the others with suppression potency (Figure 2J), overall indicating that SREBP1c plays a relevant role in maintaining the expression of typical Treg markers. Furthermore, circulating Tregs from Srebp1c-KO mice also showed increased expression of the chemokine receptors CCR3 and CCR7, along with a trend toward higher expression of CCR2 and CXCR3 (Figure 2K), suggesting altered migratory capacity of Tregs under Srebp1c-deficient conditions. Indeed, in an in vitro Transwell migration assay, ex vivo CD25hiFOXP3+ Tregs from Srebp1c-KO mice migrated more than WT cells toward both lymphoid-homing (CCL19) and inflammatory-homing (CXCL10) chemokines (Figure 2, L and M). Similar to ex vivo Tregs, iTregs from Srebp1c-KO mice showed increased migration toward both cytokines (CCL19 and CXCL10) compared with WT iTregs (Supplemental Figure 4, A and B). We have previously shown that Treg suppression versus migratory plasticity is mediated by immunometabolic reprogramming toward glycolysis (2). As such, a functional shift from suppression to migration under Srebp1c-deficient conditions could represent a possible compensatory mechanism, reflecting Treg plasticity. Taken together, these data highlighted the role of SREBP1c as a critical modulator of Treg-suppressive phenotype and function under physiological conditions.
Srebp1c deficiency rewires Treg metabolism toward glycolysis. Because Treg function is intrinsically linked to cellular energetic asset, we next investigated whether Srebp1c deficiency affected Treg functionality by perturbing intracellular metabolism. PCA analysis from targeted metabolomics showed a clear different metabolic signature in CD4+CD25+ Tregs purified from the spleens of Srebp1c-KO mice compared with those of WT mice (Supplemental Figure 5A). Among the most representative energetic metabolites, Srebp1c-KO Tregs exhibited an increased level of lactate, coupled to reduced levels of glucose-6 phosphate, α-ketoglutarate, malate, and C2-carnitine, as compared with WT Tregs (Figure 3A). Indeed, pyruvate metabolism, TCA, and transfer of acetyl groups into mitochondria were the most affected pathways in Srebp1c-deficient Tregs compared with those in WT cells (Figure 3B), suggesting a remodeling of energy metabolism. In parallel, metabolite set enrichment analysis revealed that, beyond pathways related to energetic metabolism (e.g., anaerobic glycolysis, pyruvate metabolism, TCA, and transfer of acetyl groups into mitochondria), those related to amino acids (phenylalanine and tyrosine metabolism, valine, leucine and isoleucine degradation), nucleotides (purine metabolism) and lipids (arachidonic acid and sphingolipid metabolism) were affected by Srebp1c deficiency (Supplemental Figure 5B), indicating a broad metabolic rewiring in Srebp1c-deficient Tregs. This was accompanied by a significant reduction in the α-ketoglutarate/glutamate ratio and an increase in the succinate/α-ketoglutarate ratio (Figure 3D), suggesting alterations in TCA cycle metabolism. In turn, the increase in nonessential amino acids, together with a trend toward reduced ratio between C3-acylcarnitines and the branched-chain amino acids isoleucine and valine (Figure 3E), was consistent with alterations in amino acid metabolism associated with the metabolic rewiring observed in Srebp1c-KO Tregs. Overall, these metabolic changes suggest a potential shift in cellular energy metabolism, possibly reflecting a rebalancing between glycolytic and mitochondrial pathways. Finally, we observed increased pS6 phosphorylation, a downstream target of mTORC1, in Srebp1c-KO cells compared with WT CD4+CD25+ cells (Figure 3F), suggesting a dysregulated immunometabolic phenotype.
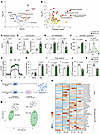 Figure 3
Srebp1c deficiency rewires Treg energetic metabolism toward glycolysis. (A) Volcano plot from targeted metabolomics of CD25+ cells; statistically significant down- and upregulated metabolites (log2FC ± 0.5 and P < 0.05) are depicted in blue and red, respectively. (B) Pathway analysis of significantly different metabolites performed by MetaboAnalyst from targeted metabolomics. Pathway impact (x axis) and significance (–log10P value (y axis) are represented. (C–E) Ratios between metabolites form targeted metabolomics: acylcarnitine (C2)/free carnitine (C), αketoglutarate/glutamate and succinate/αketoglutarate (D), and nonessential amino acids and acylcarnitine (C3)/branched amino acids isoleucine and valine (E). (F) Median fluorescence intensity (MFI) of the phosphorylated form of S6 tested by flow cytometry on CD25+ cells; representative histograms from flow cytometry analysis are shown. (G and H) ECAR analysis by glucose stress test (G) and ATP production by ATP rate assay from glycolysis and OXPHOS (H) tested by Seahorse on iTregs. (I) Glucose and lactate concentration (mM) by metabolomic analysis of supernatants of iTregs cultured for 4 days. (J and K) Ratios from targeted metabolomics of CD25+ cells: ATP energy charge calculated as ([ATP] + 0.5 × [ADP])/([AMP] + [ADP] + [ATP]) and NAD+/NADH. (L) iTregs were cultured in a glucose-free medium for 60 minutes, after which they were processed either immediately or after a 30-minute culture in a glucose-containing medium (10 mM) for metabolomic analysis. (M) PCA analysis from iTregs in glucose-free medium (rest, gray and green full line) or after the addition of glucose (10 mM final concentration; gray and green dotted line). (N) Heatmap of target metabolomics of iTregs in glucose-free medium or after the addition of glucose. Metabolites are clustered in rows according to metabolic pathways of β-oxidation, glycolysis, and TCA. Normalized values were used for the analysis by the ClustVis web tool (https://biit.cs.ut.ee/clustvis/). N = 3–6/ group. Data are presented as mean ± SEM. Statistical analysis has been performed with unpaired nonparametric t test (C–F, and I–K) and 2-way ANOVA (H).
In line with these results, glycolysis stress test by Seahorse metabolic assays showed an increased extracellular acidification rate (ECAR) in Srebp1c-KO iTregs after the administration of glucose and oligomycin (Figure 3G), indicating increased glycolysis and glycolytic capacity (Supplemental Figure 5, C and D) compared with that of WT controls. Accordingly, glycolytic ATP production was higher in Srebp1c-KO compared with WT iTregs, while ATP from OXPHOS was reduced in KO compared with WT iTregs (Figure 3H), corroborating that Srebp1c deficiency reprograms Tregs toward a more glycolytic phenotype. These results were confirmed by the detection of reduced glucose and increased lactate concentration in the culture medium of Srebp1c-KO compared with WT iTregs (Figure 3I). In agreement with this finding, a reduced ATP energy charge (Figure 3J), paralleled by the reduction of the NAD+/NADH ratio (Figure 3K) by targeted metabolomic analysis of iTregs, corroborated the increased glucose flux through the glycolytic pathway. We excluded that these changes were driven by a proliferative advantage in Srebp1c-KO Tregs, as similar expression of Ki67 and rates of in vitro proliferation were detected in both ex vivo Tregs (Supplemental Figure 4, C–E) and iTregs (Supplemental Figure 4, F–H).
To better characterize the glucose dependence of Srebp1c-KO iTregs, targeted metabolomic analysis of iTregs was performed in a glucose-free medium (1 h, rest) and after incubation with glucose re-supplementation (10 mM, + Glu) for 30 minutes (Figure 3L). Srebp1c deficiency was associated with a distinct reprogramming of the metabolome relative to WT iTregs, a change that became more pronounced upon glucose exposure (Figure 3M). Notably, Srebp1c-KO iTregs accumulated higher levels of medium-chain acyl-carnitines (C5, C8, C10) compared with WT cells under glucose-free condition (KO rest vs. WT rest) (Figure 3N), suggesting alterations in FA β-oxidation metabolism. In contrast, upon glucose supplementation, an increase in glycolytic flux was highlighted by the higher abundance of glycolytic intermediates (glucose-6P, fructose-1,6 biphosphate, DHA/GAP) in Srebp1c-KO compared with WT iTregs (Figure 3N), consistent with enhanced glycolytic activity. This energetic shift was specific to Tregs, as conventional CD4+CD25– T cells from Srebp1c-KO mice exhibited a metabolic profile superimposable on that of WT cells (Supplemental Figure 5, E and F) and similar glycolytic metabolism (Supplemental Figure 5G). In line with a similar metabolic profile, in vitro proliferation of Srebp1c-KO CD4+ T cells was not different from that of WT cells (Supplemental Figure 5H).
Taken together, these results indicate that Srebp1c deficiency causes a specific energetic reprogramming of Tregs, shifting cellular metabolism toward a more glycolytic phenotype.
Srebp1c preserves immunometabolism of Tregs by controlling cellular lipid homeostasis. To elucidate the molecular mechanisms involved, we performed RNA-seq from Srebp1c WT and -KO iTregs. PCA analysis revealed a different transcriptome profile in Srebp1c-KO Tregs compared with that in WT cells (Supplemental Figure 6A). We detected 2,615 differently expressed genes (DEGs), 46.4% of which were downregulated and 53.6% were upregulated genes with a log2fold change of 0.5 (Figure 4A). Among the top DEGs, we observed the downregulation of genes involved in lipid metabolism, including Srebf1, which encodes the SREBP1a and SREBP1c isoforms, and Acsl6, which encodes acyl-CoA synthetase long-chain family member 6. Conversely, several upregulated genes were associated with glycolysis, including Slc2a3 (glucose transporter 3, that supports glucose uptake), Eno1b (enolase 1b, involved in glycolysis by phosphoenolpyruvate production), and Pdk1 (pyruvate dehydrogenase kinase 1, that switches metabolism toward the Warburg effect) (Figure 4B). In parallel, genes strictly connected to Treg functionality, including Il2r (IL-2 receptor, CD25) and FoxP3 were downregulated in Srebp1c-KO Tregs, while Itga7 (integrin subunit α 7, required for cell migration) and Il7r (IL 7 receptor, required for T cell development and proliferation) were upregulated (Figure 4B). Overall, these findings confirmed — at transcriptional level — a shift from lipid to glycolytic metabolism and to impaired Treg phenotype. Gene Ontology of Biological process analysis of DEGs identified pathways belonging to glucose homeostasis and lipid metabolism as well as immune function, such as IL-10 production, T cell activation, signal transduction, and migration, among the most affected by Srebp1c deficiency (Figure 4C). In more detail, genes related to lipid metabolism pathways (FA transport, lipid biosynthetic process, PL homeostasis and FA metabolic process) were mostly downregulated (Supplemental Figure 6B), while those related to energetic metabolism (glycolysis, response to insulin and carbohydrate metabolic process) (Supplemental Figure 6B) were upregulated in Srebp1c-KO compared with WT Tregs. In line with the findings presented above, genes involved in cell migration and T cell activation were mostly upregulated (Supplemental Figure 5B), while those related to Treg differentiation and IL-10 production were mostly downregulated (Supplemental Figure 6C). Unsupervised canonical pathway analysis by Ingenuity Pathway Analysis (IPA) showed a predicted activation (z score >2) of pathways associated with translocation of SLC2A4 to plasma membrane, glycolysis, leukocyte extravasation, and focal adhesion kinase signaling (a tyrosin kinase that mediates intracellular signal transduction and regulates cell migration) (Figure 4D), with the latter in line with previously reported data on migration of Srebp1c-KO Tregs (Figure 2, L and M, and Supplemental Figure 4, A and B). In contrast, CTLA-4 and interferon signaling, together with fatty acyl-CoA biosynthesis and activation of SREBF gene pathways (Figure 4D), were predicted to be downregulated (z score < –2), further supporting that Srebp1c-dependent circuits are normally activated in Tregs. Other pathways that emerged to be downregulated by IPA canonical pathway analysis were the ribo- and deoxynucleotide synthesis. Given that the pentose phosphate pathway (PPP) is essential for nucleotide synthesis — providing ribose-5-phosphate for purine and pyrimidine production — and that its rate-limiting glucose-6-phosphate dehydrogenase is regulated by SREBP1c, we investigated whether PPP impairment contributed to the metabolic phenotype of Srebp1c-deficient Tregs. For this purpose, we traced D-glucose-1,2-13C2 flux to specifically track the PPP (Supplemental Figure 6D). Srebp1c-KO iTregs exhibited increased incorporation of labeled glucose-derived carbons (Supplemental Figure 6E) and accumulation of glycolytic intermediates, such as dihydroxyacetone phosphate/glyceraldehyde 3 phosphate (DHAP/GAP) and phosphoenolpyruvate (Supplemental Figure 6E) compared with WT iTregs, confirming increased glucose uptake and glycolytic pathway under Srebp1c deficiency. In addition, we detected increased labeled carbons in the metabolites of the nonoxidative branch of the PPP, such as sedoheptulose 7 phosphate (S7P) and erythrose 4-phosphate (E4P) (Supplemental Figure 6E), while no differences were detected in the metabolites of the oxidative phase (gluconate-6 phosphate and ribulose-5 phosphate, data not shown). These findings indicate that the increased nonoxidative branch of the PPP likely resulted from the GAP shunt due to heightened glycolytic flux, rather than direct impairment of the PPP. Additionally, elevated ribo- and deoxynucleotides in Srebp1c-KO iTregs suggest more purine and pyrimidine precursors, possibly suggesting an impaired de novo nucleotide synthesis.
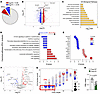 Figure 4
SREBP1c is an intrinsic determinant of Treg immunometabolic phenotype. (A) Pie chart of the distribution of significantly (colored) or not (gray) different expressed genes (DEGs) between upregulated (log2FC > 0.05, red) and downregulated (log2FC < 0.05, blue) genes. (B) Volcano plot of RNA-seq showing the most relevant DEGs (upregulated genes are in red, and downregulated genes are in blue). (C) Gene ontology analysis of biological process (GO BP) from David database analysis of DEGs from RNA-seq of Srebp1c-KO iTregs compared with WT Tregs. Enriched pathways in Srebp1c-KO iTregs are expressed as –log10FDR > 1.3. (D) Z score analysis using IPA software of canonical pathways from IPA analysis of significant DEGs. (E) Z score analysis using IPA software of upstream regulators analysis of IPA analysis of significant DEGs. (F) Volcano plot showing the quantified lipid species (sum notation) in iTregs. Blue and red represent the downregulated and upregulated lipid species in Srebp1c-KO iTregs, respectively [log2FC ± 0.5 and –log10(P value) > 1.3]. (G) Bubble plot of TG species compared by number of carbons (chain length) and number of double bonds (N double bonds). Bubble dimension is a function of –log10 of P value, while colors represent log2FC (increase in red, decrease in blue). In the red box are TGs with fewer than 54 carbons and 3 double bonds as indicators of de novo lipogenesis (DNL). (H) De novo lipogenesis index is calculated as the sum of TGs with fewer than 54 carbons and 3 double bonds in Srebp1c-KO and WT iTregs normalized to the WT mean. Lipidomics and RNA-seq were performed on 5 biological replicates/group. In H, data are presented as mean ± SEM, and statistical analysis has been performed with unpaired nonparametric t test.
In line with previous findings, analysis of upstream regulators by IPA (Figure 4E) identified Treg-suppressive function signaling pathways (z score < 2 for STAT5a/b and TGF-β) and lipid metabolism (z score < 2 for FASN and > 2 for INSIG2, involved in the retention of SREBP isoforms in the endoplasmatic reticulum) inhibited, while, in contrast, STAT3/4 and MAPK1 pathways were predicted to be activated with a z score > 2, together with glycolysis (z score > 2 for PKM, pyruvate kinase involved in glycolysis) and catabolic pathway (z score > 2 for AMPK activation) (Figure 4E). Instead, CD36 was predicted to be inhibited (z score < 2), and this was confirmed with analysis of mRNA and protein expression (Supplemental Figure 6, H and I), suggesting an impaired compensation from FA uptake. Indeed, when glycolytic activity was tested in the presence of palmitate, with or without etomoxir, an inhibitor of CTP1α (at a concentration of 5 μM that does not affect Treg polarization and viability, ref. 15; Supplemental Figure 6J), supplementation with palmitate reduced glycolysis in WT cells, an effect driven by increased FAO, as suggested by the reversion of the energetic phenotype in the presence of etomoxir (Supplemental Figure 6K). However, in Srebp1c-KO iTregs, palmitate supplementation, with or without etomoxir, was similar to that of control cells (Srebp1c-KO iTregs in the presence of BSA), functionally limiting compensation for extracellular FA uptake under Srebp1c-deficient conditions (Supplemental Figure 6K).
To clarify how Srebp1c deficiency affected Treg lipid metabolism, we conducted lipidomics analysis on Srebp1c-WT and KO iTregs. 1,255 lipid species were detected in WT and Srebp1c-KO iTregs (Supplemental Figure 7A), with the most abundant belonging to the family of phosphatidylethanolamines (PE; 24.9%), PC (20.6%), TG (16.4%), and phosphatidylinositols (PI; 11.4%) (Supplemental Figure 7B). Srebp1c-KO iTregs showed a profound difference in lipidome composition compared with WT cells (Supplemental Figure 7C), and, despite no difference in the total lipid abundance (Supplemental Figure 7D), 21.75% of lipid species were differently expressed (265 lipids), with 16.50% being upregulated and 5.25% downregulated (Supplemental Figure 7E). Within the lipid species, PLs, such as LPC and PI species, were increased, while TGs were reduced (Figure 4F) in Srebp1c-KO iTregs compared with WT cells. Focusing on downregulated lipid species, we noticed that several TGs consisted mostly of chains with fewer than 54 carbons and 3 saturations, indicating FA chains derived from de novo synthesis (Figure 4G). Therefore, we compared the sum of these TGs, as an indicator of de novo lipid synthesis (DNL index); it showed a significant reduction in FA synthesis in Srebp1c-KO iTregs compared with WT iTregs (Figure 4H), thus confirming the crucial role of SREBP1c as a modulator of FA metabolism in Tregs. By combining transcriptomics and lipidomics, we concluded that Srebp1c deficiency profoundly affects Treg immunometabolism, impairing suppressive function and shifting the energetic machinery toward glycolysis as a possible compensatory response to impaired FA synthesis.
Srebp1c deficiency remodels Treg PL composition and metabolism. In parallel with a reduction of TGs, we also observed an accumulation of PL species in Srebp1c-KO compared with WT iTregs (Figure 4F). This evidence aligns with previous observations showing that PLs are enriched in human Tregs and are associated with their suppressive phenotype (16). To better explore this difference, we investigated lipid distribution at the level of lipid classes, reporting a significant increase of several PL classes, such as glycophospholipids (LPC, PC, and PI) and ceramides (CER and LacCer), with a reduction in phosphatidylserines (PS) in Srebp1c-KO compared with WT iTregs (Figure 5A). Furthermore, we observed a general reduction of the 16:1/16:0 and C18:1/C18:0 desaturation index, particularly evident in LPC, PG, PI, and PS as well as LPC, PC, PE, and SM lipid classes, respectively (Supplemental Figure 7, F and G), indicating a reduced activity of desaturase enzymes that are controlled by SREBP1c and have been shown to contribute to Treg phenotype (17). Given that most of the observed differences were among upregulated PLs, we delved into the mechanisms that control their metabolism in Tregs. To this end, we screened RNA-seq data from iTregs for genes associated with the phospholipid metabolic process term (GO:0006644), identifying 185 DEGs shared across both datasets (Figure 5B), belonging to pathways related to glycosylphosphatidylinositol (GPI) anchors, PI and PC biosynthetic process, and PC acyl-chain remodeling (Figure 5C), supporting a contribution of SREBP1c to PL metabolism in Tregs.
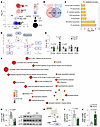 Figure 5
Srebp1c deficiency affects phospholipid metabolism. (A) Bubble plot of lipid classes presented as log2FC of their abundance (ng/mmol DNA of lipid species sum) versus the –log10 of P value. Color represents the –log10 of P value, while the size represents the number of lipid species for each class. (B) The Venn diagram represents the shared genes between our RNA-seq dataset on Tregs and the list of genes listed under the term “phospholipid metabolic process” (GO term 0006644). (C) GO BP analysis of B. Enriched pathways are expressed as –log10FDR > 1.3. (D) Representation of phospholipid metabolism; squares represent lipid classes from lipidomics (light blue indicates reductions in KO, while light red increases; gray indicates no difference). (E) Fold difference in phospholipid classes from lipidomic analysis. The ratio between the sum of lipid species for each class is presented and normalized to the mean of the WT values. (F) Enrichment analysis from a RaMP-DB pathway–based (https://www.metaboanalyst.ca/) library by MetaboAnalyst of pathways affected by significantly different lipid species. (G) Quantification of AKT activation as pAKT versus AKT ratio from Western blot analysis. Data are corrected on β-actin abundance; a representative Western blot for pAKT, AKT, and β-actin is shown. (H) Graphic representation of GPCR intracellular activation leading to cAMP generation from ATP through the activation of adenylate cyclase (AC). cAMP can be degraded to AMP by phosphodiesterase (PDE) enzymes. (I) Ratio between cAMP/ATP normalized to WT from metabolomic analysis of iTregs (AC activation). (J) Ratio between AMP/cAMP normalized to WT from metabolomic analysis of iTregs (PDE activation). Data in A, E, and F derive from lipidomic analysis (5 biological replicates/group); data in B and C are from RNA-seq analysis (5 biological replicates/group); G, n = 8 samples/group; data in I and J derive from metabolomics of iTregs (3 biological replicates/group). Data are presented as mean ± SEM. Statistical analysis has been performed using 2-way ANOVA (E) and unpaired nonparametric t tests (G–J).
PL homeostasis is a complex and coordinated process, controlled at different levels of PL de novo synthesis, conversion, and remodeling (18) (Figure 5D). To understand whether SREBP1c modulates these processes, we analyzed PL relative abundance and observed a significant increase in PC/PE and PE/PS ratios in Srebp1c-KO compared with WT iTregs (Figure 5E), indicating an enhanced conversion of PL to PC. In contrast, the ratio between PC and their respective Lyso-PC forms (LPC), but not PE/LPE, was significantly reduced in Srebp1c-KO compared with WT cells (Figure 5E), suggesting that Srebp1c deficiency might be associated with an impaired recycling of PC from LPC, resulting in an imbalanced PL homeostasis. To determine how this altered balance in PL composition would affect Treg biology, we performed enrichment analysis on significantly different lipid species. In parallel to enriched pathways related to PL metabolism (PL biosynthesis, catabolism, acyl chain remodeling; Figure 5F), this analysis showed the enrichment of specific pathways associated with Treg metabolism and function, such as insulin signaling, T cell receptor (TCR), and adenosine receptors signaling pathways, among the pathways most affected by Srebp1c deficiency (Figure 5F). To functionally prove this prediction, we investigated the activation of AKT, a downstream target of both insulin receptor and TCR and costimulatory signaling; pAKT/AKT was significantly reduced in Srebp1c-KO iTregs compared with WT iTregs (Figure 5G). In line with this, several intracellular pathways associated with TCR signaling, such as LCK, LAT, and PIK3R2, were predicted to be downregulated in KO Tregs by RNA-seq (Supplemental Figure 8A). More importantly, a key Treg immunosuppressive mechanism, the adenosine pathway, was predicted to be affected by lipid remodeling induced by Srebp1c deficiency through the G protein–coupled receptors (GPCRs) ADORA2a and ADORA2b intracellular signaling (Figure 5F). To explore this, we measured the ratio between cAMP and ATP, an indicator of adenylate cyclase (AC) activity, that is activated downstream to ADORA2a and ADORA2b activation (Figure 5H). Our findings showed that the cAMP/ATP ratio was reduced in Srebp1c-KO iTregs (Figure 5I), suggesting reduced adenosine signaling through these receptors compared with WT cells. Notably, this reduction was associated with increased phosphodiesterase (PDE) activity, measured as the AMP/cAMP ratio, which was elevated in Srebp1c-KO compared with WT iTregs (Figure 5J). To corroborate these findings, we investigated genes associated with adenosine metabolism (Supplemental Figure 8B) in the RNA-seq dataset. We reported that genes involved in adenosine synthesis (Nte, Entpd1, Dpp4) and transport (Slc29a3, Slc28a2) were upregulated, whereas genes mediating adenosine catabolism (Pnp, Ampd, Ada) were downregulated, with the exception of Akd, which was upregulated (Supplemental Figure 8C). In line with the predicted reduced activity of AC and increased PDE activity (Figure 5, I and J), the expression of Adcy9, an isoform of AC involved in immunosuppressive cAMP production (19), was reduced, while that of Pde3b, an enzyme that degrades cAMP to AMP and associated with Treg-suppressive function (20, 21), was upregulated (Supplemental Figure 8C).
Collectively, these results suggest that SREBP1c preserves PL homeostasis in Tregs and that remodeling of PL metabolism and composition impairs the metabolism of the immunosuppressive adenosine pathway.
SREBP1c-dependent modulation of membrane PL affects extracellular adenosine metabolism. Considering the effect of Srebp1c deficiency on the PC-to-LPC balance, we focused on the mechanism of PC remodeling via the Lands cycle. In this process, LPC acyltransferase (LPCAT) enzymes add an acyl-CoA to LPC, and the phospholipases A2 (PLA2) in turn release an acyl chain from PC to generate a LPC (22–25) (Figure 6A). Compared with WT iTregs, Srebp1c-KO iTregs presented an increased expression of the cPLA2α, the dominant member of the PLA2 family, with a 95% homology with the human protein and activated after cell stimulation (26) (Figure 6B), suggesting an increased release of an acyl-CoA from a PC to generate an LPC, in line with results from lipidomics (Figure 5A). No difference was instead reported in the expression of LPCAT3 (Supplemental Figure 9A), which controls the reacylation step in the Lands cycle (Figure 6A). Therefore, to establish a link between increased cPLA2α activity and impaired adenosine metabolism (Supplemental Figure 8, B and C), we measured the levels of extracellular adenosine in the culture supernatant of iTregs. This was performed in the presence or not of a specific inhibitor of cPLA2α activity (27). Srebp1c-KO iTregs showed a reduced extracellular concentration of adenosine compared with WT cells, and cPLA2α inhibition increased adenosine levels in the supernatant of both WT and Srebp1c-KO iTregs (Figure 6C). As extracellular adenosine mainly derives from the consecutive conversion of ATP to AMP and to adenosine by the enzymatic activity of the ectonucleotidases CD39 and CD73, respectively (Figure 6D), we evaluated their abundance on iTregs. Expression of CD73, but not CD39, was significantly reduced in Srebp1c-KO compared with WT iTregs (Supplemental Figure 9B). Notably, a similar pattern was observed in vivo, with a significant reduction in CD73 — but not CD39 — expression on CD4+CD25hiFOXP3+ Tregs from Srebp1c-deficient mice compared with WT mice (Figure 2J and Supplemental Figure 9, C and D), whereas conventional CD4+CD25– T cells showed no changes (Supplemental Figure 9, E and F). Pharmacological inhibition of cPLA2α restored CD73 surface expression in Srebp1c-KO iTregs to levels comparable to those of WT cells (Figure 6E), providing a mechanistic basis for the increased adenosine levels observed under these conditions. More importantly, cPLA2α inhibition rescued the suppressive function of Srebp1c-deficient iTregs to similar levels of WT cells, when iTregs treated or not with cPLA2α inhibitor were cocultured with Tconv (Figure 6F). This result linked the reduced CD73-adenosine metabolism to the decreased suppressive function of Srebp1c-KO iTregs driven by impaired PL remodeling. Finally, cPLA2α inhibition also reduced the glycolytic flux of Srebp1c-KO iTregs to levels comparable to those of WT cells (Figure 6G), possibly as a consequence of restored CD36 expression on the plasma membrane after cPLA2α inhibition, suggesting that PL remodeling can also modulate the energetic phenotype of Tregs.
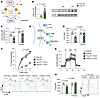 Figure 6
Srebp1c-mediated phospholipid homeostasis supports adenosine metabolism. (A) Graphic representation of acyl-chain remodeling of phospholipids by the Lands cycle: phospholipase A2 (PLA2) removes an acyl-CoA from a phosphatidylcholine (PC), generating a lysophosphatidylcholine (LPC); then, the LPC acyltransferase (LPCAT) transfers an Acyl-Coa to an LPC to form a PC. (B) Quantification of p-cPLA2α by Western Blot analysis. Data are corrected on β-actin abundance; a representative Western blot for p-cPLA2α and β-actin is shown. (C) Concentration of adenosine in the supernatants of iTregs treated or not with the cPLA2α inhibitor pyrrophenone (10 nM for 3 h). (D) Graphic representation of adenosine metabolism: extracellular ATP is hydrolyzed by CD39 to AMP (via an ADP intermediate), which is then converted to adenosine by CD73. (E) Expression of CD73 by flow cytometry in iTregs treated or not with the cPLA2α inhibitor pyrrophenone (10 nM for 3 h). (F) Suppression of Tconv proliferation by iTregs pretreated or not with the cPLAα inhibitor MAFP (5 μM for 3 h) at increasing ratios with T conventional cells (0:1 indicates that no Tregs were used, while 1:4, 1:2, and 1:1 indicate the proportion of iTregs to Tconv) for 3 days. Representative histograms from flow cytometry are shown. (G) ECAR analysis by glucose stress test tested by Seahorse on iTregs pretreated or not with the cPLA2α inhibitor pyrrophenone (10 nM for 3 h). (H) Expression of CD36 in iTreg pretreated or not with the cPLA2α inhibitor pyrrophenone (10 nM for 3 h). Representative histograms from flow cytometry analysis are shown. N = 3–8/group. Data are presented as mean ± SEM. Statistical analysis has been performed with unpaired nonparametric t test (B) or 2-way ANOVA (C, E, F, and H).
Together, these results indicated that altered PL metabolism affects the energetic and suppressive phenotypes of Tregs by modulating the adenosine pathway, a mechanism controlled by SREBP1c.


Copyright © 2026 American Society for Clinical Investigation
ISSN: 0021-9738 (print), 1558-8238 (online)