
Advertisement
Research ArticleInflammationOncology
Open Access |  10.1172/JCI200550
Convection-enhanced delivery of dexamethasone in glioma models suppresses myeloid inflammation while avoiding systemic toxicities
Nathaniel W. Rolfe,1 Nicholas B. Dadario,1 Liang Lei,1 Anthony J. Tang,1 Misha Amini,1 Damian E. Teasley,1 Nkechime Ifediora,2 Peter J. Chabot,1 Nathan J. Winans,1 Nina Yoh,1 Julia Furnari,1 Corina Kotidis,1 Clara H. Stucke,1 Nivia M. Urena,3 Yanping Sun,4 Abby L. Brand,2 Ashwin Viswanathan,2 Pavan Upadhyayula,1 Michael G. Argenziano,1 Colin P. Sperring,1 Nadine Khoury,1 Nelson Humala,1 Shikun Wang,5 Justin Neira,1 Peter A. Sims,6 Brian J.A. Gill,1 Peter Canoll,2 and Jeffrey N. Bruce1
1Department of Neurological Surgery,
2Department of Pathology and Cell Biology,
3Insititue of Comparative Medicine (ICM), and
4Oncology Precision Therapeutics and Imaging Core (OPTIC), Columbia University Irving Medical Center and NY-Presbyterian Hospital, New York, New York, USA.
5Department of Biostatistics and
6Department of Systems Biology, Columbia University Irving Medical Center, New York, New York, USA.
Address correspondence to: Jeffrey N. Bruce, Department of Neurological Surgery, Columbia University Medical Center, 710 W. 168th St., New York, New York 10032, USA. Phone: 212.305.7346; Email: jnb2@cumc.columbia.edu.
Authorship note: NWR, NBD, LL, and AJT are co–first authors.
Find articles by Rolfe, N. in: PubMed | Google Scholar
1Department of Neurological Surgery,
2Department of Pathology and Cell Biology,
3Insititue of Comparative Medicine (ICM), and
4Oncology Precision Therapeutics and Imaging Core (OPTIC), Columbia University Irving Medical Center and NY-Presbyterian Hospital, New York, New York, USA.
5Department of Biostatistics and
6Department of Systems Biology, Columbia University Irving Medical Center, New York, New York, USA.
Address correspondence to: Jeffrey N. Bruce, Department of Neurological Surgery, Columbia University Medical Center, 710 W. 168th St., New York, New York 10032, USA. Phone: 212.305.7346; Email: jnb2@cumc.columbia.edu.
Authorship note: NWR, NBD, LL, and AJT are co–first authors.
Find articles by Dadario, N. in: PubMed | Google Scholar
1Department of Neurological Surgery,
2Department of Pathology and Cell Biology,
3Insititue of Comparative Medicine (ICM), and
4Oncology Precision Therapeutics and Imaging Core (OPTIC), Columbia University Irving Medical Center and NY-Presbyterian Hospital, New York, New York, USA.
5Department of Biostatistics and
6Department of Systems Biology, Columbia University Irving Medical Center, New York, New York, USA.
Address correspondence to: Jeffrey N. Bruce, Department of Neurological Surgery, Columbia University Medical Center, 710 W. 168th St., New York, New York 10032, USA. Phone: 212.305.7346; Email: jnb2@cumc.columbia.edu.
Authorship note: NWR, NBD, LL, and AJT are co–first authors.
Find articles by Lei, L. in: PubMed | Google Scholar
1Department of Neurological Surgery,
2Department of Pathology and Cell Biology,
3Insititue of Comparative Medicine (ICM), and
4Oncology Precision Therapeutics and Imaging Core (OPTIC), Columbia University Irving Medical Center and NY-Presbyterian Hospital, New York, New York, USA.
5Department of Biostatistics and
6Department of Systems Biology, Columbia University Irving Medical Center, New York, New York, USA.
Address correspondence to: Jeffrey N. Bruce, Department of Neurological Surgery, Columbia University Medical Center, 710 W. 168th St., New York, New York 10032, USA. Phone: 212.305.7346; Email: jnb2@cumc.columbia.edu.
Authorship note: NWR, NBD, LL, and AJT are co–first authors.
Find articles by Tang, A. in: PubMed | Google Scholar
1Department of Neurological Surgery,
2Department of Pathology and Cell Biology,
3Insititue of Comparative Medicine (ICM), and
4Oncology Precision Therapeutics and Imaging Core (OPTIC), Columbia University Irving Medical Center and NY-Presbyterian Hospital, New York, New York, USA.
5Department of Biostatistics and
6Department of Systems Biology, Columbia University Irving Medical Center, New York, New York, USA.
Address correspondence to: Jeffrey N. Bruce, Department of Neurological Surgery, Columbia University Medical Center, 710 W. 168th St., New York, New York 10032, USA. Phone: 212.305.7346; Email: jnb2@cumc.columbia.edu.
Authorship note: NWR, NBD, LL, and AJT are co–first authors.
Find articles by Amini, M. in: PubMed | Google Scholar
1Department of Neurological Surgery,
2Department of Pathology and Cell Biology,
3Insititue of Comparative Medicine (ICM), and
4Oncology Precision Therapeutics and Imaging Core (OPTIC), Columbia University Irving Medical Center and NY-Presbyterian Hospital, New York, New York, USA.
5Department of Biostatistics and
6Department of Systems Biology, Columbia University Irving Medical Center, New York, New York, USA.
Address correspondence to: Jeffrey N. Bruce, Department of Neurological Surgery, Columbia University Medical Center, 710 W. 168th St., New York, New York 10032, USA. Phone: 212.305.7346; Email: jnb2@cumc.columbia.edu.
Authorship note: NWR, NBD, LL, and AJT are co–first authors.
Find articles by Teasley, D. in: PubMed | Google Scholar
1Department of Neurological Surgery,
2Department of Pathology and Cell Biology,
3Insititue of Comparative Medicine (ICM), and
4Oncology Precision Therapeutics and Imaging Core (OPTIC), Columbia University Irving Medical Center and NY-Presbyterian Hospital, New York, New York, USA.
5Department of Biostatistics and
6Department of Systems Biology, Columbia University Irving Medical Center, New York, New York, USA.
Address correspondence to: Jeffrey N. Bruce, Department of Neurological Surgery, Columbia University Medical Center, 710 W. 168th St., New York, New York 10032, USA. Phone: 212.305.7346; Email: jnb2@cumc.columbia.edu.
Authorship note: NWR, NBD, LL, and AJT are co–first authors.
Find articles by Ifediora, N. in: PubMed | Google Scholar
1Department of Neurological Surgery,
2Department of Pathology and Cell Biology,
3Insititue of Comparative Medicine (ICM), and
4Oncology Precision Therapeutics and Imaging Core (OPTIC), Columbia University Irving Medical Center and NY-Presbyterian Hospital, New York, New York, USA.
5Department of Biostatistics and
6Department of Systems Biology, Columbia University Irving Medical Center, New York, New York, USA.
Address correspondence to: Jeffrey N. Bruce, Department of Neurological Surgery, Columbia University Medical Center, 710 W. 168th St., New York, New York 10032, USA. Phone: 212.305.7346; Email: jnb2@cumc.columbia.edu.
Authorship note: NWR, NBD, LL, and AJT are co–first authors.
Find articles by Chabot, P. in: PubMed | Google Scholar
1Department of Neurological Surgery,
2Department of Pathology and Cell Biology,
3Insititue of Comparative Medicine (ICM), and
4Oncology Precision Therapeutics and Imaging Core (OPTIC), Columbia University Irving Medical Center and NY-Presbyterian Hospital, New York, New York, USA.
5Department of Biostatistics and
6Department of Systems Biology, Columbia University Irving Medical Center, New York, New York, USA.
Address correspondence to: Jeffrey N. Bruce, Department of Neurological Surgery, Columbia University Medical Center, 710 W. 168th St., New York, New York 10032, USA. Phone: 212.305.7346; Email: jnb2@cumc.columbia.edu.
Authorship note: NWR, NBD, LL, and AJT are co–first authors.
Find articles by Winans, N. in: PubMed | Google Scholar
1Department of Neurological Surgery,
2Department of Pathology and Cell Biology,
3Insititue of Comparative Medicine (ICM), and
4Oncology Precision Therapeutics and Imaging Core (OPTIC), Columbia University Irving Medical Center and NY-Presbyterian Hospital, New York, New York, USA.
5Department of Biostatistics and
6Department of Systems Biology, Columbia University Irving Medical Center, New York, New York, USA.
Address correspondence to: Jeffrey N. Bruce, Department of Neurological Surgery, Columbia University Medical Center, 710 W. 168th St., New York, New York 10032, USA. Phone: 212.305.7346; Email: jnb2@cumc.columbia.edu.
Authorship note: NWR, NBD, LL, and AJT are co–first authors.
Find articles by Yoh, N. in: PubMed | Google Scholar
1Department of Neurological Surgery,
2Department of Pathology and Cell Biology,
3Insititue of Comparative Medicine (ICM), and
4Oncology Precision Therapeutics and Imaging Core (OPTIC), Columbia University Irving Medical Center and NY-Presbyterian Hospital, New York, New York, USA.
5Department of Biostatistics and
6Department of Systems Biology, Columbia University Irving Medical Center, New York, New York, USA.
Address correspondence to: Jeffrey N. Bruce, Department of Neurological Surgery, Columbia University Medical Center, 710 W. 168th St., New York, New York 10032, USA. Phone: 212.305.7346; Email: jnb2@cumc.columbia.edu.
Authorship note: NWR, NBD, LL, and AJT are co–first authors.
Find articles by Furnari, J. in: PubMed | Google Scholar
1Department of Neurological Surgery,
2Department of Pathology and Cell Biology,
3Insititue of Comparative Medicine (ICM), and
4Oncology Precision Therapeutics and Imaging Core (OPTIC), Columbia University Irving Medical Center and NY-Presbyterian Hospital, New York, New York, USA.
5Department of Biostatistics and
6Department of Systems Biology, Columbia University Irving Medical Center, New York, New York, USA.
Address correspondence to: Jeffrey N. Bruce, Department of Neurological Surgery, Columbia University Medical Center, 710 W. 168th St., New York, New York 10032, USA. Phone: 212.305.7346; Email: jnb2@cumc.columbia.edu.
Authorship note: NWR, NBD, LL, and AJT are co–first authors.
Find articles by Kotidis, C. in: PubMed | Google Scholar
1Department of Neurological Surgery,
2Department of Pathology and Cell Biology,
3Insititue of Comparative Medicine (ICM), and
4Oncology Precision Therapeutics and Imaging Core (OPTIC), Columbia University Irving Medical Center and NY-Presbyterian Hospital, New York, New York, USA.
5Department of Biostatistics and
6Department of Systems Biology, Columbia University Irving Medical Center, New York, New York, USA.
Address correspondence to: Jeffrey N. Bruce, Department of Neurological Surgery, Columbia University Medical Center, 710 W. 168th St., New York, New York 10032, USA. Phone: 212.305.7346; Email: jnb2@cumc.columbia.edu.
Authorship note: NWR, NBD, LL, and AJT are co–first authors.
Find articles by Stucke, C. in: PubMed | Google Scholar
1Department of Neurological Surgery,
2Department of Pathology and Cell Biology,
3Insititue of Comparative Medicine (ICM), and
4Oncology Precision Therapeutics and Imaging Core (OPTIC), Columbia University Irving Medical Center and NY-Presbyterian Hospital, New York, New York, USA.
5Department of Biostatistics and
6Department of Systems Biology, Columbia University Irving Medical Center, New York, New York, USA.
Address correspondence to: Jeffrey N. Bruce, Department of Neurological Surgery, Columbia University Medical Center, 710 W. 168th St., New York, New York 10032, USA. Phone: 212.305.7346; Email: jnb2@cumc.columbia.edu.
Authorship note: NWR, NBD, LL, and AJT are co–first authors.
Find articles by Urena, N. in: PubMed | Google Scholar
1Department of Neurological Surgery,
2Department of Pathology and Cell Biology,
3Insititue of Comparative Medicine (ICM), and
4Oncology Precision Therapeutics and Imaging Core (OPTIC), Columbia University Irving Medical Center and NY-Presbyterian Hospital, New York, New York, USA.
5Department of Biostatistics and
6Department of Systems Biology, Columbia University Irving Medical Center, New York, New York, USA.
Address correspondence to: Jeffrey N. Bruce, Department of Neurological Surgery, Columbia University Medical Center, 710 W. 168th St., New York, New York 10032, USA. Phone: 212.305.7346; Email: jnb2@cumc.columbia.edu.
Authorship note: NWR, NBD, LL, and AJT are co–first authors.
Find articles by Sun, Y. in: PubMed | Google Scholar
1Department of Neurological Surgery,
2Department of Pathology and Cell Biology,
3Insititue of Comparative Medicine (ICM), and
4Oncology Precision Therapeutics and Imaging Core (OPTIC), Columbia University Irving Medical Center and NY-Presbyterian Hospital, New York, New York, USA.
5Department of Biostatistics and
6Department of Systems Biology, Columbia University Irving Medical Center, New York, New York, USA.
Address correspondence to: Jeffrey N. Bruce, Department of Neurological Surgery, Columbia University Medical Center, 710 W. 168th St., New York, New York 10032, USA. Phone: 212.305.7346; Email: jnb2@cumc.columbia.edu.
Authorship note: NWR, NBD, LL, and AJT are co–first authors.
Find articles by Brand, A. in: PubMed | Google Scholar
1Department of Neurological Surgery,
2Department of Pathology and Cell Biology,
3Insititue of Comparative Medicine (ICM), and
4Oncology Precision Therapeutics and Imaging Core (OPTIC), Columbia University Irving Medical Center and NY-Presbyterian Hospital, New York, New York, USA.
5Department of Biostatistics and
6Department of Systems Biology, Columbia University Irving Medical Center, New York, New York, USA.
Address correspondence to: Jeffrey N. Bruce, Department of Neurological Surgery, Columbia University Medical Center, 710 W. 168th St., New York, New York 10032, USA. Phone: 212.305.7346; Email: jnb2@cumc.columbia.edu.
Authorship note: NWR, NBD, LL, and AJT are co–first authors.
Find articles by Viswanathan, A. in: PubMed | Google Scholar
1Department of Neurological Surgery,
2Department of Pathology and Cell Biology,
3Insititue of Comparative Medicine (ICM), and
4Oncology Precision Therapeutics and Imaging Core (OPTIC), Columbia University Irving Medical Center and NY-Presbyterian Hospital, New York, New York, USA.
5Department of Biostatistics and
6Department of Systems Biology, Columbia University Irving Medical Center, New York, New York, USA.
Address correspondence to: Jeffrey N. Bruce, Department of Neurological Surgery, Columbia University Medical Center, 710 W. 168th St., New York, New York 10032, USA. Phone: 212.305.7346; Email: jnb2@cumc.columbia.edu.
Authorship note: NWR, NBD, LL, and AJT are co–first authors.
Find articles by Upadhyayula, P. in: PubMed | Google Scholar
1Department of Neurological Surgery,
2Department of Pathology and Cell Biology,
3Insititue of Comparative Medicine (ICM), and
4Oncology Precision Therapeutics and Imaging Core (OPTIC), Columbia University Irving Medical Center and NY-Presbyterian Hospital, New York, New York, USA.
5Department of Biostatistics and
6Department of Systems Biology, Columbia University Irving Medical Center, New York, New York, USA.
Address correspondence to: Jeffrey N. Bruce, Department of Neurological Surgery, Columbia University Medical Center, 710 W. 168th St., New York, New York 10032, USA. Phone: 212.305.7346; Email: jnb2@cumc.columbia.edu.
Authorship note: NWR, NBD, LL, and AJT are co–first authors.
Find articles by Argenziano, M. in: PubMed | Google Scholar
1Department of Neurological Surgery,
2Department of Pathology and Cell Biology,
3Insititue of Comparative Medicine (ICM), and
4Oncology Precision Therapeutics and Imaging Core (OPTIC), Columbia University Irving Medical Center and NY-Presbyterian Hospital, New York, New York, USA.
5Department of Biostatistics and
6Department of Systems Biology, Columbia University Irving Medical Center, New York, New York, USA.
Address correspondence to: Jeffrey N. Bruce, Department of Neurological Surgery, Columbia University Medical Center, 710 W. 168th St., New York, New York 10032, USA. Phone: 212.305.7346; Email: jnb2@cumc.columbia.edu.
Authorship note: NWR, NBD, LL, and AJT are co–first authors.
Find articles by Sperring, C. in: PubMed | Google Scholar
1Department of Neurological Surgery,
2Department of Pathology and Cell Biology,
3Insititue of Comparative Medicine (ICM), and
4Oncology Precision Therapeutics and Imaging Core (OPTIC), Columbia University Irving Medical Center and NY-Presbyterian Hospital, New York, New York, USA.
5Department of Biostatistics and
6Department of Systems Biology, Columbia University Irving Medical Center, New York, New York, USA.
Address correspondence to: Jeffrey N. Bruce, Department of Neurological Surgery, Columbia University Medical Center, 710 W. 168th St., New York, New York 10032, USA. Phone: 212.305.7346; Email: jnb2@cumc.columbia.edu.
Authorship note: NWR, NBD, LL, and AJT are co–first authors.
Find articles by Khoury, N. in: PubMed | Google Scholar
1Department of Neurological Surgery,
2Department of Pathology and Cell Biology,
3Insititue of Comparative Medicine (ICM), and
4Oncology Precision Therapeutics and Imaging Core (OPTIC), Columbia University Irving Medical Center and NY-Presbyterian Hospital, New York, New York, USA.
5Department of Biostatistics and
6Department of Systems Biology, Columbia University Irving Medical Center, New York, New York, USA.
Address correspondence to: Jeffrey N. Bruce, Department of Neurological Surgery, Columbia University Medical Center, 710 W. 168th St., New York, New York 10032, USA. Phone: 212.305.7346; Email: jnb2@cumc.columbia.edu.
Authorship note: NWR, NBD, LL, and AJT are co–first authors.
Find articles by Humala, N. in: PubMed | Google Scholar
1Department of Neurological Surgery,
2Department of Pathology and Cell Biology,
3Insititue of Comparative Medicine (ICM), and
4Oncology Precision Therapeutics and Imaging Core (OPTIC), Columbia University Irving Medical Center and NY-Presbyterian Hospital, New York, New York, USA.
5Department of Biostatistics and
6Department of Systems Biology, Columbia University Irving Medical Center, New York, New York, USA.
Address correspondence to: Jeffrey N. Bruce, Department of Neurological Surgery, Columbia University Medical Center, 710 W. 168th St., New York, New York 10032, USA. Phone: 212.305.7346; Email: jnb2@cumc.columbia.edu.
Authorship note: NWR, NBD, LL, and AJT are co–first authors.
Find articles by Wang, S. in: PubMed | Google Scholar
1Department of Neurological Surgery,
2Department of Pathology and Cell Biology,
3Insititue of Comparative Medicine (ICM), and
4Oncology Precision Therapeutics and Imaging Core (OPTIC), Columbia University Irving Medical Center and NY-Presbyterian Hospital, New York, New York, USA.
5Department of Biostatistics and
6Department of Systems Biology, Columbia University Irving Medical Center, New York, New York, USA.
Address correspondence to: Jeffrey N. Bruce, Department of Neurological Surgery, Columbia University Medical Center, 710 W. 168th St., New York, New York 10032, USA. Phone: 212.305.7346; Email: jnb2@cumc.columbia.edu.
Authorship note: NWR, NBD, LL, and AJT are co–first authors.
Find articles by Neira, J. in: PubMed | Google Scholar
1Department of Neurological Surgery,
2Department of Pathology and Cell Biology,
3Insititue of Comparative Medicine (ICM), and
4Oncology Precision Therapeutics and Imaging Core (OPTIC), Columbia University Irving Medical Center and NY-Presbyterian Hospital, New York, New York, USA.
5Department of Biostatistics and
6Department of Systems Biology, Columbia University Irving Medical Center, New York, New York, USA.
Address correspondence to: Jeffrey N. Bruce, Department of Neurological Surgery, Columbia University Medical Center, 710 W. 168th St., New York, New York 10032, USA. Phone: 212.305.7346; Email: jnb2@cumc.columbia.edu.
Authorship note: NWR, NBD, LL, and AJT are co–first authors.
Find articles by
Sims, P.
in:
PubMed
|
Google Scholar
|

1Department of Neurological Surgery,
2Department of Pathology and Cell Biology,
3Insititue of Comparative Medicine (ICM), and
4Oncology Precision Therapeutics and Imaging Core (OPTIC), Columbia University Irving Medical Center and NY-Presbyterian Hospital, New York, New York, USA.
5Department of Biostatistics and
6Department of Systems Biology, Columbia University Irving Medical Center, New York, New York, USA.
Address correspondence to: Jeffrey N. Bruce, Department of Neurological Surgery, Columbia University Medical Center, 710 W. 168th St., New York, New York 10032, USA. Phone: 212.305.7346; Email: jnb2@cumc.columbia.edu.
Authorship note: NWR, NBD, LL, and AJT are co–first authors.
Find articles by Gill, B. in: PubMed | Google Scholar
1Department of Neurological Surgery,
2Department of Pathology and Cell Biology,
3Insititue of Comparative Medicine (ICM), and
4Oncology Precision Therapeutics and Imaging Core (OPTIC), Columbia University Irving Medical Center and NY-Presbyterian Hospital, New York, New York, USA.
5Department of Biostatistics and
6Department of Systems Biology, Columbia University Irving Medical Center, New York, New York, USA.
Address correspondence to: Jeffrey N. Bruce, Department of Neurological Surgery, Columbia University Medical Center, 710 W. 168th St., New York, New York 10032, USA. Phone: 212.305.7346; Email: jnb2@cumc.columbia.edu.
Authorship note: NWR, NBD, LL, and AJT are co–first authors.
Find articles by Canoll, P. in: PubMed | Google Scholar
1Department of Neurological Surgery,
2Department of Pathology and Cell Biology,
3Insititue of Comparative Medicine (ICM), and
4Oncology Precision Therapeutics and Imaging Core (OPTIC), Columbia University Irving Medical Center and NY-Presbyterian Hospital, New York, New York, USA.
5Department of Biostatistics and
6Department of Systems Biology, Columbia University Irving Medical Center, New York, New York, USA.
Address correspondence to: Jeffrey N. Bruce, Department of Neurological Surgery, Columbia University Medical Center, 710 W. 168th St., New York, New York 10032, USA. Phone: 212.305.7346; Email: jnb2@cumc.columbia.edu.
Authorship note: NWR, NBD, LL, and AJT are co–first authors.
Find articles by Bruce, J. in: PubMed | Google Scholar
Published August 18, 2026 - More info
J Clin Invest. 2026;136(19):e200550. https://doi.org/10.1172/JCI200550.
© 2026 Rolfe et al. This work is licensed under the Creative Commons Attribution 4.0 International License. To view a copy of this license, visit http://creativecommons.org/licenses/by/4.0/.
Received: September 24, 2025; Accepted: August 4, 2026

-
Results
Convection-enhanced delivery of dexamethasone is well tolerated in glioma-bearing mice. Local delivery of a high dose of dexamethasone (0.24 mg/d) has been shown to prolong survival in a leporine metastatic carcinoma model (43). Therefore, we performed a survival study to determine the tolerability and potential benefit of locally delivered dexamethasone in a syngeneic glioma model. Mice were randomized to receive either a PBS control or PBS solution containing 100 ng/μL of dexamethasone via a 7-day Alzet pump (1007D). An intrapump concentration of 100 ng/μL of dexamethasone was chosen as it was below the level affecting tumor cell viability in our PDGFA-driven syngeneic murine glioma cell line (APCL) and GL261 cells (Supplemental Figure 1A; supplemental material available online with this article; https://doi.org/10.1172/JCI200550DS1). This was important, as we wanted to explore dexamethasone’s effects on the inflammatory microenvironment rather than its direct cytotoxic effects. Additionally, mice that received an intrapump concentration of 200 ng/μL of dexamethasone exhibited nearly 10% weight loss 1 day after pump implantation (Supplemental Figure 1B), suggesting that 100 ng/μL is near the murine maximally tolerated dose when delivered via a 7-day Alzet pump. Mice receiving systemic dexamethasone received daily i.p. injections of 10 mg/kg of dexamethasone, a dose tolerable in previous survival studies (8).
All mice demonstrated adequate intraparenchymal distribution of the drug or vehicle as assessed by coinfused gadolinium (1% Omniscan), and a consistent volume of distribution was observed between groups (Figure 1A). CED-dexamethasone treatment for 7 days was well tolerated without significant changes in weight compared with control mice or mice receiving systemic dexamethasone (Figure 1B) or outward signs of distress.
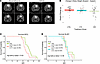 Figure 1
CED-dexamethasone demonstrated intracranial drug distribution without significant weight loss, and prolonged survival in mice with APCL tumors, but did not significantly improve survival in the GL261 model. (A) Representative MRI images from mice demonstrating the volume of gadolinium distribution between control and CED-dexamethasone treatment conditions. (B) The majority of mice gained or lost a negligible amount of weight in our 3 treatment conditions. Mice receiving PBS (vehicle control) gained 0.7 ± 1.0 g (mean ± SD), mice receiving systemic dexamethasone gained 0.4 ± 0.8 g, and mice receiving CED-dexamethasone lost 0.1 ± 1.7 g. There was no significant difference in weight change between treatment groups (Kruskal-Wallis, P = 0.15). (C) Survival curves of vehicle-treated or CED-dexamethasone–treated mice with APCL tumors. Mean survival for control mice was 35 days while median survival for CED-dexamethasone–treated mice was 41 days (log-rank P = 0.03). (D) Survival curves of vehicle-, CED-dexamethasone–, and systemic dexamethasone–treated mice with GL261 tumors. Mean survival for control mice was 23 days, mean survival for systemically treated mice was 22 days, and mean survival for CED-dexamethasone–treated mice was 25 days (log-rank P = 0.39).
Kaplan-Meier survival analysis demonstrated a modest but statistically significant survival advantage in our APCL model for mice treated with CED of dexamethasone compared with vehicle-treated control mice (mean survival 41 days post tumor injection [DPI] vs. 35 DPI, respectively; log-rank P = 0.03) (Figure 1C). This survival effect did not generalize to the GL261 model, where mice receiving CED-dexamethasone, systemic dexamethasone, and vehicle control did not demonstrate a statistically significant change in overall survival (mean survival 25 DPI, 22 DPI, and 23 DPI, respectively; log-rank P = 0.39) (Figure 1D).
CED of dexamethasone improves drug delivery to the brain while minimizing systemic exposure. Using high-performance liquid chromatography-tandem mass spectrometry (HPLC-MS/MS), we quantified dexamethasone concentrations in tissue and plasma under various delivery conditions in both murine and human specimens. We first showed that dexamethasone is stable at 37°C for up to 10 days in the Alzet pump (Supplemental Table 1). After 5 days of local dexamethasone delivery in mice, the average concentration of dexamethasone in the tumor-bearing quadrant was 196.2 ng/g (Figure 2A). The concentration of dexamethasone in the liver of CED-treated mice was 6.1 ng/g, which likely resulted from dexamethasone efflux from the brain (Figure 2A). The dexamethasone concentrations in the liver, brain, and serum of mice were measured 1 hour after i.p. injection of 10 mg/kg of dexamethasone (Figure 2B). When delivered systemically, dexamethasone preferentially partitions in the liver (10,998.9 ng/g versus 2,410.9 ng/mL of serum), with a relatively lower concentration in the brain (124.8 ng/g). The partitioning coefficient between brain and liver parenchyma of Kbrain,liver,ip = 0.011 ± 0.010, whereas local delivery allows for preferential partitioning in the brain with a Kbrain,liver,ced = 29.2 (Figure 2C).
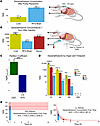 Figure 2
CED of dexamethasone leads to preferential and sustained drug exposure in the tumor-bearing brain with minimal peripheral distribution compared with systemic administration. (A) Dexamethasone concentrations in the tumor-bearing right frontal quadrant (RFQ) (196.2 ± 56.4 ng/g) and liver (6.7 ± 3.1 ng/g) in mice treated with CED of dexamethasone. Values were obtained after 5 days of treatment with an Alzet osmotic pump (1007D). (B) Dexamethasone concentration in the tumor-bearing quadrant (124.8 ± 93.4 ng/g), liver (10,999 ± 5,486 ng/g), and serum (2,411 ± 1,248 ng/g) of mice 1 hour after i.p. injection of 10 mg/kg of dexamethasone. (C) The partitioning of dexamethasone between the brain and liver depends on the route of administration. CED of dexamethasone allowed for preferential partitioning of the drug in the brain. Intraperitoneal injection led to a partitioning coefficient of Kbrain,liver = 0.011 ± 0.010. CED led to a partitioning coefficient of Kbrain,liver = 29.2 ± 15.8. (D) Dexamethasone concentrations in the brain, liver, and serum were determined 1, 4, 8, and 24 hours after i.p. injection of 10 mg/kg dexamethasone. (E) Areas under the curve were calculated for once-daily 10 mg/kg dexamethasone i.p. and for CED of dexamethasone (100 ng/μL). Assuming CED leads to a steady-state concentration over 24 hours, we found that CED delivery gave an AUC of 4,709 (95% CI 3,382, 6,036) (ng/g)·h, whereas systemic delivery had an AUC of 375 (95% CI 300, 467) (ng/g)·h. Values are reported as mean ± SEM.
Additionally, we collected tissue at 1, 4, 8, and 24 hours after i.p. dexamethasone injection and observed a first-order rate of elimination in the liver, brain, and serum consistent with a half-life of approximately 1.1 hours in all 3 compartments (Figure 2D). We estimated the area under the curve (AUC) for the dexamethasone concentration over time when given via CED and via daily i.p. dosing. The AUC with CED of dexamethasone was 10-fold higher compared with systemic delivery: 4,709 ± 1,327 vs. 375 ± 75 (ng/g)·h, respectively (Figure 2E).
We also quantified dexamethasone partitioning in human brains and plasma from intraoperative GBM samples (Supplemental Figure 2A). Contrast-enhancing tumor samples had a concentration of dexamethasone of 73% ± 20% of the corresponding plasma concentrations. Nonenhancing samples, however, had a dexamethasone concentration of 20% ± 10% of the plasma concentration. In our murine studies, mice that received systemic dexamethasone had a dexamethasone concentration in the tumor-bearing quadrant of 6% ± 2% of the plasma concentration.
CED of dexamethasone avoids side effects that accompany systemic administration of dexamethasone. Next, we demonstrated that CED of dexamethasone was a viable strategy to avoid systemic side effects. Systemically treated mice were given 10 mg/kg/d of dexamethasone via i.p. injection, while locally treated mice were given dexamethasone via an Alzet pump (1007D) at an intrapump concentration of 100 ng/μL.
Systemically delivered dexamethasone (SYS) led to several measurable physiological side effects in our mice. Blood glucose levels, taken 24 hours after i.p. dexamethasone dosing (a trough level), were decreased from their pretreatment baseline in systemically treated mice (Figure 3A), and a similar decrease was still seen on day 7 of treatment (Figure 3B). When dexamethasone was given via CED, no change in blood glucose level was seen (Figure 3, A and B).
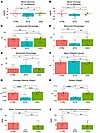 Figure 3
Systemic dexamethasone, but not CED, induces systemic changes consistent with glucocorticoid toxicity. (A and B) Systemic dexamethasone lowered blood glucose from pretreatment baseline on days 1 and 7, whereas CED-dexamethasone did not. On day 1, systemic dexamethasone reduced glucose versus CTRL and CED (Kruskal-Wallis P = 0.002), while CED did not differ from CTRL. On day 7, systemic dexamethasone remained lower than CTRL and CED (Kruskal-Wallis P = 0.01), with no difference between CED and CTRL. (C–E) After 7 days, systemic dexamethasone reduced lymphocyte percentages (CTRL: 59% ± 21%, CED: 59% ± 30%, SYS: 38% ± 27%; Kruskal-Wallis P = 0.008) and monocyte percentages (CTRL: 5.1% ± 2.9%, CED: 5.8% ± 4.9%, SYS: 2.4% ± 2.4%; Kruskal-Wallis P = 0.01) and increased neutrophil percentages (CTRL: 29% ± 25%, CED: 31% ± 31%, SYS: 50% ± 33%; Kruskal-Wallis P = 0.02). CED did not differ from CTRL. (F–H) Mean platelet volume did not differ among groups (CTRL: 5.3 ± 1.1 fL, CED: 5.3 ± 0.9 fL, SYS: 5.9 ± 0.6 fL; Kruskal-Wallis P = 0.06). Systemic dexamethasone decreased adrenal weight (CTRL: 0.010 ± 0.003 g, CED: 0.011 ± 0.003 g, SYS: 0.004 ± 0.004 g; Kruskal-Wallis P = 0.0004) and spleen weight (CTRL: 0.084 ± 0.037 g, CED: 0.082 ± 0.022 g, SYS: 0.034 ± 0.010 g; Kruskal-Wallis P = 0.0004). (I and J) Endogenous corticosterone was ablated by systemic dexamethasone but preserved with CED. Liver corticosterone was 75.9 ± 35.4 ng/g (CTRL), 46.6 ± 46.6 ng/g (CED), and 0 ± 0 ng/g (SYS); brain corticosterone concentrations were 56.8 ± 36.0 ng/g, 45.1 ± 15.2 ng/g, and 0 ± 0 ng/g, respectively. Differences were analyzed using Kruskal-Wallis test followed by post hoc t test (*P < 0.05; **P < 0.01, ****P < 0.0001).
SYS also led to a significant decrease in lymphocyte percentages (CTRL: 59% ± 21%, CED: 59% ± 30%, SYS: 38% ± 27%) and monocyte percentages (CTRL: 5.1% ± 2.9%, CED: 5.8% ± 4.9%, SYS: 2.4% ± 2.4%) after 7 days of treatment (Figure 3, C and D). Similarly, neutrophil percentages (CTRL: 29% ± 25%, CED: 31% ± 31%, SYS: 50% ± 33%) and mean platelet volume (CTRL: 5.3 ± 1.1 fL, CED: 5.3 ± 0.9 fL, SYS: 5.9 ± 0.6 fL) were increased following systemic treatment (Figure 3, C and D). No significant alterations in blood counts were observed when dexamethasone was given by CED (Figure 3, C–F). Additionally, splenic and adrenal atrophy were observed after 7 days of systemic delivery of dexamethasone and not with CED (Figure 3, G and H). In line with the above findings, we observed a complete ablation of endogenous corticosterone in the brain and liver in mice with systemic dexamethasone that was not observed with CED of dexamethasone (Figure 3, I and J).
Analysis of murine tissue immediately after CED of dexamethasone shows an antiinflammatory effect. In vitro studies showed that the concentration of dexamethasone delivered by CED is below the level affecting murine tumor cell viability (Supplemental Figure 1A). Therefore, we performed posttreatment tissue analyses to determine the effects of CED of dexamethasone on the tumor microenvironment. Histological analysis and single-nucleus RNA-seq (snRNA-seq) of tissue were performed immediately following 7 days of CED of dexamethasone or vehicle with an Alzet osmotic pump, starting at 21 days postinjection. A systemic delivery group was included for histological analysis utilizing dosages used in previous studies of glioma-bearing mice (10 mg/kg/d i.p. dexamethasone) (8, 17, 23, 24) (Figure 4A).
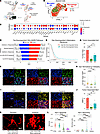 Figure 4
CED-dexamethasone suppresses inflammatory myeloid programs in glioma, reduces IBA1/MSR1-associated myeloid cells, and promotes a less activated morphology. (A) Tumors were implanted on DPI 0. On DPI 21, mice received CED-dexamethasone (100 ng/μL), systemic dexamethasone (10 mg/kg daily i.p.), or vehicle. After 7 days of treatment, mice were euthanized for snRNA-seq or histology. (B) UMAP of myeloid nuclei showing macrophage-like (Msr1+, Cd74+) and microglial-like (P2ry12+, Tmem119+) clusters. (C) CED-dexamethasone reduced immune activation gene expression in myeloid nuclei. (D) Hallmark GSEA showed inflammatory and immune-related pathways enriched in vehicle-treated mice and suppressed after CED-dexamethasone, including IL-6, IL-1β, and TNF-α signaling. (E) In TCGA and CGGA GBM cohorts, above-median expression of the 50 most downregulated myeloid genes following CED-dexamethasone was associated with worse overall survival (P = 0.0018). (F) Representative immunofluorescence images showing ionized calcium-binding adapter molecule 1 (IBA1) positivity in CRE-positive tumor fields; scale bar: 20 μm. (G) IBA1-positive area was decreased in dexamethasone-treated tumors (CTRL vs. SYS, P = 0.018; CTRL vs. CED, P = 0.0031; CED vs. SYS, P = 0.031). (H) IBA1-positive area remained reduced with CED-dexamethasone after normalization to total cellularity as a proxy for tumor burden (P < 0.0001). (I) Representative immunofluorescence images showing IBA1 and MSR1 in the tumor core; scale bar: 20 μm. (J) CED-dexamethasone reduced MSR1-positive cells versus control (P = 0.0032); systemic dexamethasone showed a nonsignificant trend (P = 0.24). (K) Representative ramified and ameboid myeloid cell; scale bar: 5 μm. (L) Morphological analysis showed that CED-dexamethasone made tumor-associated IBA1-positive cells less spherical and more branched; statistics computed per cell. Statistical differences were analyzed using Kruskal-Wallis test followed by post hoc t test (H, I, and K). (*P < 0.05; **P < 0.01, ***P < 0.001, ****P < 0.0001.)
We performed snRNA-seq of tumor-containing brain tissue from the CED-dexamethasone–treated and vehicle-treated samples. These nuclei were projected in uniform manifold approximation and projection (UMAP) space and assigned cell lineages using canonical marker genes, which were validated with SingleR (Supplemental Figure 3, A and B). Shifts in transcriptional patterns between treatment conditions in myeloid cells, the predominant inflammatory cell type captured in our analysis, were assessed. UMAP visualization demonstrated that myeloid cells clustered into resting microglial (P2ry12, Hexb, Sall1) and activated macrophage/monocyte-like subpopulations (Msr1, Cd206/Mrc1, Lyz2) (Figure 4B and Supplemental Figure 3C) (44). Microglial-like nuclei were enriched in P2ry12 and Hexb expression, while the macrophage/monocyte-like nuclei were enriched in Msr1 (Supplemental Figure 3C). Analysis of a broad set of inflammatory genes showed that CED of dexamethasone reduced reactive microglial and macrophage genes, including markers of interferon signaling (Irf7, Ifit2, Ifit3) (45), phagocytosis and antigen presentation (H2-Aa, H2-Ab1) (46), and chemokine/cytokine signaling (Tlr4, Il1b, Il6, Tnf) (47) (Figure 4C).
The antiinflammatory transcriptional effects of CED of dexamethasone were further examined by performing gene set enrichment analysis (GSEA) (48) on our treatment groups. Analysis of significant Hallmark pathways revealed that the most significantly downregulated pathways were all related to inflammation, including interferon response, IL2-STAT5 and IL6 signaling, and immune rejection pathways (Figure 4D).
To assess the prognostic importance of the reduction of inflammatory transcriptional signatures, we performed log-rank testing on the human homologs of the top 50 significantly downregulated myeloid cell genes after CED of dexamethasone (Supplemental Table 2). Using variance-stabilizing transformation–normalized (VST-normalized) The Cancer Genome Atlas (TCGA) and Chinese Glioma Genome Atlas (CGGA) bulk sequencing data from patients with IDH-WT primary GBM (25), a significantly improved survival in patients with low expression of these inflammatory genes was observed (log-rank, P = 0.0018; Figure 4E).
Immunohistochemical staining of posttreatment tumors demonstrated a significant decrease in IBA1 staining within the tumors of mice treated with CED-dexamethasone compared with control mice and mice treated with systemic dexamethasone (Figure 4, F–H). This decrease in IBA1 positivity was also observed when normalized to tumor cellularity (Figure 4I). We also examined MSR1, a marker of tumor-associated macrophages that has been associated with a poor prognosis in GBM (49, 50) (Figure 4J). We observed that MSR1 labeled a distinct subset of myeloid cells within the tumor core, which was nonoverlapping with P2RY12-positive microglia at the tumor margin (Supplemental Figure 4). This supports the idea that MSR1 is labeling a subset of “activated” myeloid cells that emerge in the setting of chronic tumor inflammation. We found a significant (P = 0.0032) decrease in MSR1-positive cells with CED-dexamethasone over control, whereas the effects of systemic dexamethasone were not significant (P = 0.24) (Figure 4J).
In addition to a decrease in the overall abundance of IBA1-positive and MSR1-positive myeloid cells after CED of dexamethasone, the morphology of IBA1-positive cells was significantly more ramified in mice treated with CED of dexamethasone (Figure 4K). It has been suggested that microglial morphology (i.e., a hypertrophic, amoeboid appearance) is a sign of activated microglia, while resting microglia take on a ramified appearance (51–53). Using a previously developed and validated automated morphological analysis toolkit (54), we quantified sphericity and branching in a subset of IBA1-positive cells from mice treated with systemic dexamethasone, CED-dexamethasone, and vehicle. Tumor-associated IBA1-positive cells were less spherical and had more branching nodes in mice treated with CED of dexamethasone than in the SYS- or vehicle-treated conditions (Figure 4L).
To explore whether vascular changes might contribute to changes in myeloid recruitment, we also quantified CD34-positive tissue across treatment groups (Supplemental Figure 5A). CD34-positive area normalized to cellularity was reduced in CED-treated tumors relative to controls (Supplemental Figure 5B). Systemic dexamethasone showed an intermediate effect, with an average CD34-positive area lower than controls, but higher than CED-treated tumors, though pairwise differences with systemic dexamethasone were not statistically significant. A similar pattern was observed in end-stage tumors from our GL261 survival study (Supplemental Figure 5C). These findings suggest that prolonged local dexamethasone therapy leads to an overall reduction in tumor vascularity to a greater degree than systemic drug delivery. Posttreatment snRNA-seq supports this finding, showing a significant reduction in Vegfa expression in astrocytes following CED-dexamethasone. Systemic dexamethasone did not lead to a significant transcriptional suppression of Vegfa in astrocytes (Supplemental Figure 3D).
We investigated the differential effects of local versus systemic dexamethasone therapy by comparing snRNA-seq data from myeloid cells in each group. Differential gene expression revealed 463 differentially expressed genes (Supplemental Table 3), many of which are inflammatory in ontology. Genes such as Cd68 and Ccr2 were significantly downregulated in the CED group compared with SYS group, consistent with the broad antiinflammatory effect observed with local delivery. Immunofluorescence staining for CD68 (Supplemental Figure 5D) supported this transcriptional observation. The CD68 labeling index was reduced in the CED group relative to both control and systemic dexamethasone groups, whereas systemic treatment showed only a partial reduction relative to control (Supplemental Figure 5E). This is consistent with the observed decrease in IBA1-positive myeloid cells seen earlier. Not all inflammatory genes were downregulated, however, as evidenced by an upregulation in Ly86 and Stat1 in CED-dexamethasone mice compared with systemic dexamethasone mice (Supplemental Table 3). Prolonged high levels of dexamethasone achieved during local delivery may lead to different transcriptional changes than the peak-trough pattern achieved by systemic drug delivery.
Comparison of enrichment scores in Hallmark pathways between the systemic and local groups showed a consistent negative enrichment in inflammatory pathways in the CED group. Systemic delivery, on the other hand, showed a similar negative enrichment in some Hallmark pathways (e.g., interferon response and allograft rejection), whereas a positive enrichment was observed in some key inflammatory ontologies (e.g., IL6 and TNFα signaling) (Supplemental Figure 6A). Finally, we assessed the clinical significance of RNA expression patterns in our CED and systemic groups by comparing them with recently published myeloid cell expression programs in GBM (55). We found that systemic and local dexamethasone caused opposite enrichments (positive and negative, respectively) in 2 of these expression programs — complement immunosuppressive and systemic inflammatory (Supplemental Figure 6B).
In vitro treatment of iPSC-derived microglia with dexamethasone inhibits LPS-induced activation. To assess the direct effects of dexamethasone on microglia cells in vitro, we utilized human iPSC-derived microglia (Figure 5A) (56), which are thought to more closely represent resting, in vivo microglia than immortalized myeloid cell lines (57, 58). Bulk RNA-seq was analyzed from iPSC-derived microglia treated for 24 hours with dexamethasone or LPS, either alone or in combination.
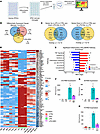 Figure 5
Dexamethasone broadly reverses the LPS-induced inflammatory transcriptional program in iPSC-derived microglia, including cytokine expression and Hallmark inflammatory pathway activation. (A) Schematic of the iPSC-derived microglial experiment. iPSCs were differentiated into microglia before being treated for 24 hours. RNA was then extracted from the cells. Differential gene expression analysis was performed. (B) Venn diagram representing the number of unique and overlapping differentially expressed (P adj < 0.05) genes in each comparison. (C) The addition of dexamethasone to LPS reversed the expression of a large number of genes that were initially differentially expressed with LPS. The number of overlapping genes that were differentially expressed in opposite directions in the LPS vs. CTRL and LPS+dexamethasone vs. LPS comparisons was significantly greater than would be expected by chance (P < 1 × 10⁻¹⁰, hypergeometric test). (D) Dexamethasone broadly reversed a large number of cytokines that were upregulated with the addition of LPS. The log2(FC) column represents the log fold-change in expression between the LPS and LPS+dexamethasone conditions. An asterisk (*) next to a gene name denotes that LPS induced a significant change in expression that was significantly reversed in the LPS+dexamethasone condition. (E) LPS induced a broad upregulation of Hallmark inflammatory genes, which were relatively downregulated when cells were treated with a combination of LPS+dexamethasone. (F–H) Normalized RNA expression for Il1b, Il6, and Tnf.
Differentially expressed genes between treatment conditions were calculated (Figure 5B). We found that LPS was a robust inflammatory stimulus with over 6,000 differentially expressed genes compared with control cells (P adj < 0.05). A significant overlap was observed between genes differentially expressed in the LPS plus dexamethasone versus LPS comparison and genes differentially expressed in the LPS versus control condition. Namely, a significant number of genes that were significantly upregulated with LPS were significantly downregulated with the addition of dexamethasone and vice versa (Figure 5C). The pool of overlapping genes was significantly greater than would be expected by random chance (P < 1 × 10⁻¹⁰ by hypergeometric testing).
Similarly, LPS significantly altered the transcription of a broad range of cytokines. When dexamethasone was added to LPS, cytokine transcription typically shifted back toward control levels (Figure 5, D and F–H). Additionally, analysis of Hallmark pathways showed significant enrichment in inflammatory pathways (e.g., complement, TNFα, interferon, IL6, and IL2 signaling pathways) that were correspondingly negatively enriched with the addition of dexamethasone in combination with LPS (Figure 5E).
To confirm that dexamethasone-mediated suppression of inflammatory cytokines generalizes across human microglial and macrophage models, we performed qPCR in HMC3 microglia with vehicle, LPS, dexamethasone, or LPS+dexamethasone. LPS significantly increased RNA expression of IL1B and TNF and induced a trend toward increased IL6 after 24 hours. Cotreatment with dexamethasone significantly attenuated IL1B, TNF, and IL6 RNA expression compared with LPS treatment alone, recapitulating what was observed in iPSC-derived microglia (Supplemental Figure 7A). Similar patterns were also observed in THP-1 cells using published bulk RNA-seq data from Ansari et al. (59). LPS induced expression of Hallmark inflammatory gene sets, which was attenuated by the addition of dexamethasone (Supplemental Figure 7B). LPS increased RNA expression of IL1B and TNF and induced a trend toward increased IL6 after 24 hours. Cotreatment with dexamethasone significantly attenuated IL1B, TNF, and IL6 RNA expression compared with LPS treatment alone, recapitulating what was observed in iPSC-derived microglia and HMC3 microglia (Supplemental Figure 7C). This suggests that the antiinflammatory patterns of dexamethasone are consistent among a variety of myeloid cell subsets.


Copyright © 2026 American Society for Clinical Investigation
ISSN: 0021-9738 (print), 1558-8238 (online)