
Advertisement
Research ArticleAIDS/HIVImmunology
Open Access |  10.1172/JCI198730
α4 Integrin blockade impairs CD8+ T cell neuroimmune surveillance following SIV infection
Pabitra B. Pal,1 Sonny R. Elizaldi,2 Giovanne B. Diniz,2 Ravi Prakash Rai,3,4 Yashavanth Shaan Lakshmanappa,2 Anil Verma,2 Daniel Rossmiller,1 Jesse Kaufman,1 Rahul Srivastava,1 Sean Ott,2 Carissa T. Erices,2 Kayla Schwartz,2 Danielle Beckman,2 Zhong-Min Ma,2 Alex Petkov,1 Daniel Newhouse,5 Dhivyaa Rajasundaram,6 John H. Morrison,2,7 Reben Raeman,3,4 and Smita S. Iyer1
1Department of Pathology, School of Medicine, University of Pittsburgh, Pittsburgh, Pennsylvania, USA.
2California National Primate Research Center, University of California, Davis, Davis, California, USA.
3Organ Pathobiology and Therapeutics Institute and
4Department of Pharmacology and Chemical Biology, School of Medicine, University of Pittsburgh, Pittsburgh, Pennsylvania, USA.
5Bruker Spatial Biology, Seattle, Washington, USA.
6Department of Pediatrics, School of Medicine, University of Pittsburgh, Pittsburgh, Pennsylvania, USA.
7Department of Neurology, School of Medicine, University of California, Davis, Davis, California, USA.
Address correspondence to: Reben Raeman, University of Pittsburgh, 200 Lothrop Street, S405 BST, Pittsburgh, Pennsylvania 15261, USA. Email: Reben.Raeman@pitt.edu. Or to: Smita S. Iyer, University of Pittsburgh, 3550 Terrace Street, S737 Scaife, Pittsburgh, Pennsylvania 15261, USA. Email: ssi13@pitt.edu.
Authorship note: PBP, SRE, GBD, and RPR are co–first authors.
Find articles by Pal, P. in: PubMed | Google Scholar
1Department of Pathology, School of Medicine, University of Pittsburgh, Pittsburgh, Pennsylvania, USA.
2California National Primate Research Center, University of California, Davis, Davis, California, USA.
3Organ Pathobiology and Therapeutics Institute and
4Department of Pharmacology and Chemical Biology, School of Medicine, University of Pittsburgh, Pittsburgh, Pennsylvania, USA.
5Bruker Spatial Biology, Seattle, Washington, USA.
6Department of Pediatrics, School of Medicine, University of Pittsburgh, Pittsburgh, Pennsylvania, USA.
7Department of Neurology, School of Medicine, University of California, Davis, Davis, California, USA.
Address correspondence to: Reben Raeman, University of Pittsburgh, 200 Lothrop Street, S405 BST, Pittsburgh, Pennsylvania 15261, USA. Email: Reben.Raeman@pitt.edu. Or to: Smita S. Iyer, University of Pittsburgh, 3550 Terrace Street, S737 Scaife, Pittsburgh, Pennsylvania 15261, USA. Email: ssi13@pitt.edu.
Authorship note: PBP, SRE, GBD, and RPR are co–first authors.
Find articles by Elizaldi, S. in: PubMed | Google Scholar
1Department of Pathology, School of Medicine, University of Pittsburgh, Pittsburgh, Pennsylvania, USA.
2California National Primate Research Center, University of California, Davis, Davis, California, USA.
3Organ Pathobiology and Therapeutics Institute and
4Department of Pharmacology and Chemical Biology, School of Medicine, University of Pittsburgh, Pittsburgh, Pennsylvania, USA.
5Bruker Spatial Biology, Seattle, Washington, USA.
6Department of Pediatrics, School of Medicine, University of Pittsburgh, Pittsburgh, Pennsylvania, USA.
7Department of Neurology, School of Medicine, University of California, Davis, Davis, California, USA.
Address correspondence to: Reben Raeman, University of Pittsburgh, 200 Lothrop Street, S405 BST, Pittsburgh, Pennsylvania 15261, USA. Email: Reben.Raeman@pitt.edu. Or to: Smita S. Iyer, University of Pittsburgh, 3550 Terrace Street, S737 Scaife, Pittsburgh, Pennsylvania 15261, USA. Email: ssi13@pitt.edu.
Authorship note: PBP, SRE, GBD, and RPR are co–first authors.
Find articles by Diniz, G. in: PubMed | Google Scholar
1Department of Pathology, School of Medicine, University of Pittsburgh, Pittsburgh, Pennsylvania, USA.
2California National Primate Research Center, University of California, Davis, Davis, California, USA.
3Organ Pathobiology and Therapeutics Institute and
4Department of Pharmacology and Chemical Biology, School of Medicine, University of Pittsburgh, Pittsburgh, Pennsylvania, USA.
5Bruker Spatial Biology, Seattle, Washington, USA.
6Department of Pediatrics, School of Medicine, University of Pittsburgh, Pittsburgh, Pennsylvania, USA.
7Department of Neurology, School of Medicine, University of California, Davis, Davis, California, USA.
Address correspondence to: Reben Raeman, University of Pittsburgh, 200 Lothrop Street, S405 BST, Pittsburgh, Pennsylvania 15261, USA. Email: Reben.Raeman@pitt.edu. Or to: Smita S. Iyer, University of Pittsburgh, 3550 Terrace Street, S737 Scaife, Pittsburgh, Pennsylvania 15261, USA. Email: ssi13@pitt.edu.
Authorship note: PBP, SRE, GBD, and RPR are co–first authors.
Find articles by Rai, R. in: PubMed | Google Scholar
1Department of Pathology, School of Medicine, University of Pittsburgh, Pittsburgh, Pennsylvania, USA.
2California National Primate Research Center, University of California, Davis, Davis, California, USA.
3Organ Pathobiology and Therapeutics Institute and
4Department of Pharmacology and Chemical Biology, School of Medicine, University of Pittsburgh, Pittsburgh, Pennsylvania, USA.
5Bruker Spatial Biology, Seattle, Washington, USA.
6Department of Pediatrics, School of Medicine, University of Pittsburgh, Pittsburgh, Pennsylvania, USA.
7Department of Neurology, School of Medicine, University of California, Davis, Davis, California, USA.
Address correspondence to: Reben Raeman, University of Pittsburgh, 200 Lothrop Street, S405 BST, Pittsburgh, Pennsylvania 15261, USA. Email: Reben.Raeman@pitt.edu. Or to: Smita S. Iyer, University of Pittsburgh, 3550 Terrace Street, S737 Scaife, Pittsburgh, Pennsylvania 15261, USA. Email: ssi13@pitt.edu.
Authorship note: PBP, SRE, GBD, and RPR are co–first authors.
Find articles by Shaan Lakshmanappa, Y. in: PubMed | Google Scholar
1Department of Pathology, School of Medicine, University of Pittsburgh, Pittsburgh, Pennsylvania, USA.
2California National Primate Research Center, University of California, Davis, Davis, California, USA.
3Organ Pathobiology and Therapeutics Institute and
4Department of Pharmacology and Chemical Biology, School of Medicine, University of Pittsburgh, Pittsburgh, Pennsylvania, USA.
5Bruker Spatial Biology, Seattle, Washington, USA.
6Department of Pediatrics, School of Medicine, University of Pittsburgh, Pittsburgh, Pennsylvania, USA.
7Department of Neurology, School of Medicine, University of California, Davis, Davis, California, USA.
Address correspondence to: Reben Raeman, University of Pittsburgh, 200 Lothrop Street, S405 BST, Pittsburgh, Pennsylvania 15261, USA. Email: Reben.Raeman@pitt.edu. Or to: Smita S. Iyer, University of Pittsburgh, 3550 Terrace Street, S737 Scaife, Pittsburgh, Pennsylvania 15261, USA. Email: ssi13@pitt.edu.
Authorship note: PBP, SRE, GBD, and RPR are co–first authors.
Find articles by Verma, A. in: PubMed | Google Scholar
1Department of Pathology, School of Medicine, University of Pittsburgh, Pittsburgh, Pennsylvania, USA.
2California National Primate Research Center, University of California, Davis, Davis, California, USA.
3Organ Pathobiology and Therapeutics Institute and
4Department of Pharmacology and Chemical Biology, School of Medicine, University of Pittsburgh, Pittsburgh, Pennsylvania, USA.
5Bruker Spatial Biology, Seattle, Washington, USA.
6Department of Pediatrics, School of Medicine, University of Pittsburgh, Pittsburgh, Pennsylvania, USA.
7Department of Neurology, School of Medicine, University of California, Davis, Davis, California, USA.
Address correspondence to: Reben Raeman, University of Pittsburgh, 200 Lothrop Street, S405 BST, Pittsburgh, Pennsylvania 15261, USA. Email: Reben.Raeman@pitt.edu. Or to: Smita S. Iyer, University of Pittsburgh, 3550 Terrace Street, S737 Scaife, Pittsburgh, Pennsylvania 15261, USA. Email: ssi13@pitt.edu.
Authorship note: PBP, SRE, GBD, and RPR are co–first authors.
Find articles by Rossmiller, D. in: PubMed | Google Scholar
1Department of Pathology, School of Medicine, University of Pittsburgh, Pittsburgh, Pennsylvania, USA.
2California National Primate Research Center, University of California, Davis, Davis, California, USA.
3Organ Pathobiology and Therapeutics Institute and
4Department of Pharmacology and Chemical Biology, School of Medicine, University of Pittsburgh, Pittsburgh, Pennsylvania, USA.
5Bruker Spatial Biology, Seattle, Washington, USA.
6Department of Pediatrics, School of Medicine, University of Pittsburgh, Pittsburgh, Pennsylvania, USA.
7Department of Neurology, School of Medicine, University of California, Davis, Davis, California, USA.
Address correspondence to: Reben Raeman, University of Pittsburgh, 200 Lothrop Street, S405 BST, Pittsburgh, Pennsylvania 15261, USA. Email: Reben.Raeman@pitt.edu. Or to: Smita S. Iyer, University of Pittsburgh, 3550 Terrace Street, S737 Scaife, Pittsburgh, Pennsylvania 15261, USA. Email: ssi13@pitt.edu.
Authorship note: PBP, SRE, GBD, and RPR are co–first authors.
Find articles by Kaufman, J. in: PubMed | Google Scholar
1Department of Pathology, School of Medicine, University of Pittsburgh, Pittsburgh, Pennsylvania, USA.
2California National Primate Research Center, University of California, Davis, Davis, California, USA.
3Organ Pathobiology and Therapeutics Institute and
4Department of Pharmacology and Chemical Biology, School of Medicine, University of Pittsburgh, Pittsburgh, Pennsylvania, USA.
5Bruker Spatial Biology, Seattle, Washington, USA.
6Department of Pediatrics, School of Medicine, University of Pittsburgh, Pittsburgh, Pennsylvania, USA.
7Department of Neurology, School of Medicine, University of California, Davis, Davis, California, USA.
Address correspondence to: Reben Raeman, University of Pittsburgh, 200 Lothrop Street, S405 BST, Pittsburgh, Pennsylvania 15261, USA. Email: Reben.Raeman@pitt.edu. Or to: Smita S. Iyer, University of Pittsburgh, 3550 Terrace Street, S737 Scaife, Pittsburgh, Pennsylvania 15261, USA. Email: ssi13@pitt.edu.
Authorship note: PBP, SRE, GBD, and RPR are co–first authors.
Find articles by Srivastava, R. in: PubMed | Google Scholar
1Department of Pathology, School of Medicine, University of Pittsburgh, Pittsburgh, Pennsylvania, USA.
2California National Primate Research Center, University of California, Davis, Davis, California, USA.
3Organ Pathobiology and Therapeutics Institute and
4Department of Pharmacology and Chemical Biology, School of Medicine, University of Pittsburgh, Pittsburgh, Pennsylvania, USA.
5Bruker Spatial Biology, Seattle, Washington, USA.
6Department of Pediatrics, School of Medicine, University of Pittsburgh, Pittsburgh, Pennsylvania, USA.
7Department of Neurology, School of Medicine, University of California, Davis, Davis, California, USA.
Address correspondence to: Reben Raeman, University of Pittsburgh, 200 Lothrop Street, S405 BST, Pittsburgh, Pennsylvania 15261, USA. Email: Reben.Raeman@pitt.edu. Or to: Smita S. Iyer, University of Pittsburgh, 3550 Terrace Street, S737 Scaife, Pittsburgh, Pennsylvania 15261, USA. Email: ssi13@pitt.edu.
Authorship note: PBP, SRE, GBD, and RPR are co–first authors.
Find articles by Ott, S. in: PubMed | Google Scholar
1Department of Pathology, School of Medicine, University of Pittsburgh, Pittsburgh, Pennsylvania, USA.
2California National Primate Research Center, University of California, Davis, Davis, California, USA.
3Organ Pathobiology and Therapeutics Institute and
4Department of Pharmacology and Chemical Biology, School of Medicine, University of Pittsburgh, Pittsburgh, Pennsylvania, USA.
5Bruker Spatial Biology, Seattle, Washington, USA.
6Department of Pediatrics, School of Medicine, University of Pittsburgh, Pittsburgh, Pennsylvania, USA.
7Department of Neurology, School of Medicine, University of California, Davis, Davis, California, USA.
Address correspondence to: Reben Raeman, University of Pittsburgh, 200 Lothrop Street, S405 BST, Pittsburgh, Pennsylvania 15261, USA. Email: Reben.Raeman@pitt.edu. Or to: Smita S. Iyer, University of Pittsburgh, 3550 Terrace Street, S737 Scaife, Pittsburgh, Pennsylvania 15261, USA. Email: ssi13@pitt.edu.
Authorship note: PBP, SRE, GBD, and RPR are co–first authors.
Find articles by Erices, C. in: PubMed | Google Scholar
1Department of Pathology, School of Medicine, University of Pittsburgh, Pittsburgh, Pennsylvania, USA.
2California National Primate Research Center, University of California, Davis, Davis, California, USA.
3Organ Pathobiology and Therapeutics Institute and
4Department of Pharmacology and Chemical Biology, School of Medicine, University of Pittsburgh, Pittsburgh, Pennsylvania, USA.
5Bruker Spatial Biology, Seattle, Washington, USA.
6Department of Pediatrics, School of Medicine, University of Pittsburgh, Pittsburgh, Pennsylvania, USA.
7Department of Neurology, School of Medicine, University of California, Davis, Davis, California, USA.
Address correspondence to: Reben Raeman, University of Pittsburgh, 200 Lothrop Street, S405 BST, Pittsburgh, Pennsylvania 15261, USA. Email: Reben.Raeman@pitt.edu. Or to: Smita S. Iyer, University of Pittsburgh, 3550 Terrace Street, S737 Scaife, Pittsburgh, Pennsylvania 15261, USA. Email: ssi13@pitt.edu.
Authorship note: PBP, SRE, GBD, and RPR are co–first authors.
Find articles by Schwartz, K. in: PubMed | Google Scholar
1Department of Pathology, School of Medicine, University of Pittsburgh, Pittsburgh, Pennsylvania, USA.
2California National Primate Research Center, University of California, Davis, Davis, California, USA.
3Organ Pathobiology and Therapeutics Institute and
4Department of Pharmacology and Chemical Biology, School of Medicine, University of Pittsburgh, Pittsburgh, Pennsylvania, USA.
5Bruker Spatial Biology, Seattle, Washington, USA.
6Department of Pediatrics, School of Medicine, University of Pittsburgh, Pittsburgh, Pennsylvania, USA.
7Department of Neurology, School of Medicine, University of California, Davis, Davis, California, USA.
Address correspondence to: Reben Raeman, University of Pittsburgh, 200 Lothrop Street, S405 BST, Pittsburgh, Pennsylvania 15261, USA. Email: Reben.Raeman@pitt.edu. Or to: Smita S. Iyer, University of Pittsburgh, 3550 Terrace Street, S737 Scaife, Pittsburgh, Pennsylvania 15261, USA. Email: ssi13@pitt.edu.
Authorship note: PBP, SRE, GBD, and RPR are co–first authors.
Find articles by Beckman, D. in: PubMed | Google Scholar
1Department of Pathology, School of Medicine, University of Pittsburgh, Pittsburgh, Pennsylvania, USA.
2California National Primate Research Center, University of California, Davis, Davis, California, USA.
3Organ Pathobiology and Therapeutics Institute and
4Department of Pharmacology and Chemical Biology, School of Medicine, University of Pittsburgh, Pittsburgh, Pennsylvania, USA.
5Bruker Spatial Biology, Seattle, Washington, USA.
6Department of Pediatrics, School of Medicine, University of Pittsburgh, Pittsburgh, Pennsylvania, USA.
7Department of Neurology, School of Medicine, University of California, Davis, Davis, California, USA.
Address correspondence to: Reben Raeman, University of Pittsburgh, 200 Lothrop Street, S405 BST, Pittsburgh, Pennsylvania 15261, USA. Email: Reben.Raeman@pitt.edu. Or to: Smita S. Iyer, University of Pittsburgh, 3550 Terrace Street, S737 Scaife, Pittsburgh, Pennsylvania 15261, USA. Email: ssi13@pitt.edu.
Authorship note: PBP, SRE, GBD, and RPR are co–first authors.
Find articles by Ma, Z. in: PubMed | Google Scholar
1Department of Pathology, School of Medicine, University of Pittsburgh, Pittsburgh, Pennsylvania, USA.
2California National Primate Research Center, University of California, Davis, Davis, California, USA.
3Organ Pathobiology and Therapeutics Institute and
4Department of Pharmacology and Chemical Biology, School of Medicine, University of Pittsburgh, Pittsburgh, Pennsylvania, USA.
5Bruker Spatial Biology, Seattle, Washington, USA.
6Department of Pediatrics, School of Medicine, University of Pittsburgh, Pittsburgh, Pennsylvania, USA.
7Department of Neurology, School of Medicine, University of California, Davis, Davis, California, USA.
Address correspondence to: Reben Raeman, University of Pittsburgh, 200 Lothrop Street, S405 BST, Pittsburgh, Pennsylvania 15261, USA. Email: Reben.Raeman@pitt.edu. Or to: Smita S. Iyer, University of Pittsburgh, 3550 Terrace Street, S737 Scaife, Pittsburgh, Pennsylvania 15261, USA. Email: ssi13@pitt.edu.
Authorship note: PBP, SRE, GBD, and RPR are co–first authors.
Find articles by Petkov, A. in: PubMed | Google Scholar
1Department of Pathology, School of Medicine, University of Pittsburgh, Pittsburgh, Pennsylvania, USA.
2California National Primate Research Center, University of California, Davis, Davis, California, USA.
3Organ Pathobiology and Therapeutics Institute and
4Department of Pharmacology and Chemical Biology, School of Medicine, University of Pittsburgh, Pittsburgh, Pennsylvania, USA.
5Bruker Spatial Biology, Seattle, Washington, USA.
6Department of Pediatrics, School of Medicine, University of Pittsburgh, Pittsburgh, Pennsylvania, USA.
7Department of Neurology, School of Medicine, University of California, Davis, Davis, California, USA.
Address correspondence to: Reben Raeman, University of Pittsburgh, 200 Lothrop Street, S405 BST, Pittsburgh, Pennsylvania 15261, USA. Email: Reben.Raeman@pitt.edu. Or to: Smita S. Iyer, University of Pittsburgh, 3550 Terrace Street, S737 Scaife, Pittsburgh, Pennsylvania 15261, USA. Email: ssi13@pitt.edu.
Authorship note: PBP, SRE, GBD, and RPR are co–first authors.
Find articles by Newhouse, D. in: PubMed | Google Scholar
1Department of Pathology, School of Medicine, University of Pittsburgh, Pittsburgh, Pennsylvania, USA.
2California National Primate Research Center, University of California, Davis, Davis, California, USA.
3Organ Pathobiology and Therapeutics Institute and
4Department of Pharmacology and Chemical Biology, School of Medicine, University of Pittsburgh, Pittsburgh, Pennsylvania, USA.
5Bruker Spatial Biology, Seattle, Washington, USA.
6Department of Pediatrics, School of Medicine, University of Pittsburgh, Pittsburgh, Pennsylvania, USA.
7Department of Neurology, School of Medicine, University of California, Davis, Davis, California, USA.
Address correspondence to: Reben Raeman, University of Pittsburgh, 200 Lothrop Street, S405 BST, Pittsburgh, Pennsylvania 15261, USA. Email: Reben.Raeman@pitt.edu. Or to: Smita S. Iyer, University of Pittsburgh, 3550 Terrace Street, S737 Scaife, Pittsburgh, Pennsylvania 15261, USA. Email: ssi13@pitt.edu.
Authorship note: PBP, SRE, GBD, and RPR are co–first authors.
Find articles by Rajasundaram, D. in: PubMed | Google Scholar
1Department of Pathology, School of Medicine, University of Pittsburgh, Pittsburgh, Pennsylvania, USA.
2California National Primate Research Center, University of California, Davis, Davis, California, USA.
3Organ Pathobiology and Therapeutics Institute and
4Department of Pharmacology and Chemical Biology, School of Medicine, University of Pittsburgh, Pittsburgh, Pennsylvania, USA.
5Bruker Spatial Biology, Seattle, Washington, USA.
6Department of Pediatrics, School of Medicine, University of Pittsburgh, Pittsburgh, Pennsylvania, USA.
7Department of Neurology, School of Medicine, University of California, Davis, Davis, California, USA.
Address correspondence to: Reben Raeman, University of Pittsburgh, 200 Lothrop Street, S405 BST, Pittsburgh, Pennsylvania 15261, USA. Email: Reben.Raeman@pitt.edu. Or to: Smita S. Iyer, University of Pittsburgh, 3550 Terrace Street, S737 Scaife, Pittsburgh, Pennsylvania 15261, USA. Email: ssi13@pitt.edu.
Authorship note: PBP, SRE, GBD, and RPR are co–first authors.
Find articles by Morrison, J. in: PubMed | Google Scholar
1Department of Pathology, School of Medicine, University of Pittsburgh, Pittsburgh, Pennsylvania, USA.
2California National Primate Research Center, University of California, Davis, Davis, California, USA.
3Organ Pathobiology and Therapeutics Institute and
4Department of Pharmacology and Chemical Biology, School of Medicine, University of Pittsburgh, Pittsburgh, Pennsylvania, USA.
5Bruker Spatial Biology, Seattle, Washington, USA.
6Department of Pediatrics, School of Medicine, University of Pittsburgh, Pittsburgh, Pennsylvania, USA.
7Department of Neurology, School of Medicine, University of California, Davis, Davis, California, USA.
Address correspondence to: Reben Raeman, University of Pittsburgh, 200 Lothrop Street, S405 BST, Pittsburgh, Pennsylvania 15261, USA. Email: Reben.Raeman@pitt.edu. Or to: Smita S. Iyer, University of Pittsburgh, 3550 Terrace Street, S737 Scaife, Pittsburgh, Pennsylvania 15261, USA. Email: ssi13@pitt.edu.
Authorship note: PBP, SRE, GBD, and RPR are co–first authors.
Find articles by Raeman, R. in: PubMed | Google Scholar
1Department of Pathology, School of Medicine, University of Pittsburgh, Pittsburgh, Pennsylvania, USA.
2California National Primate Research Center, University of California, Davis, Davis, California, USA.
3Organ Pathobiology and Therapeutics Institute and
4Department of Pharmacology and Chemical Biology, School of Medicine, University of Pittsburgh, Pittsburgh, Pennsylvania, USA.
5Bruker Spatial Biology, Seattle, Washington, USA.
6Department of Pediatrics, School of Medicine, University of Pittsburgh, Pittsburgh, Pennsylvania, USA.
7Department of Neurology, School of Medicine, University of California, Davis, Davis, California, USA.
Address correspondence to: Reben Raeman, University of Pittsburgh, 200 Lothrop Street, S405 BST, Pittsburgh, Pennsylvania 15261, USA. Email: Reben.Raeman@pitt.edu. Or to: Smita S. Iyer, University of Pittsburgh, 3550 Terrace Street, S737 Scaife, Pittsburgh, Pennsylvania 15261, USA. Email: ssi13@pitt.edu.
Authorship note: PBP, SRE, GBD, and RPR are co–first authors.
Find articles by Iyer, S. in: PubMed | Google Scholar
Published February 24, 2026 - More info
J Clin Invest. 2026;136(8):e198730. https://doi.org/10.1172/JCI198730.
© 2026 Pal et al. This work is licensed under the Creative Commons Attribution 4.0 International License. To view a copy of this license, visit http://creativecommons.org/licenses/by/4.0/.
Received: November 10, 2025; Accepted: February 17, 2026

Related video:
CD8+ T cell neuroimmune surveillance following SIV infection is impaired by α4 integrin
In this episode Smita Iyer describe how the manuscript's findings establish that α4 integrin governs CD8-mediated neuroimmune surveillance through coordinated cellular positioning, with blockade enabling viral seeding while disrupting spatially organized antiviral defense.

-
Results
α4 Blockade promotes lymphocytosis and transient Th1 CD4+ T cell enrichment in blood. We quantified α4 expression across CD4+ T cell subsets to identify populations licensed for CNS migration. Within the α4+CD95+ memory pool, CXCR3+ cells outnumbered CCR6+ cells, indicating preferential α4 expression on Th1 cells (Figure 1, A–G). CD28– cells, typically enriched for terminal effectors, showed higher α4 expression than CD28+ cells in blood (median 90% vs. 40%) and skull bone marrow (94% vs. 60%) (Supplemental Figure 1A; supplemental material available online with this article; https://doi.org/10.1172/JCI198730DS1). In contrast, the CSF was enriched for CD28+ T cells, making α4+CD28+ subsets the most abundant among both CD4 and CD8 compartments (Supplemental Figure 1B). CXCR3+CD28+ Th1 cells constituted the dominant α4+ CD4 population in both blood and CSF (Supplemental Figure 1, C and D). In brain and spleen, α4 was coexpressed primarily with β1 rather than β7 (Supplemental Figure 1E). Comparison of α4β1– versus α4β1+CD4+ T cells in the brain parenchyma showed higher relative expression of CCR5 and CD69 on the former, while CXCR3 and CCR6 were expressed at similar levels (Supplemental Figure 1, F and G). Together, Th1-polarized and CD28– effector populations showed enriched α4 expression, licensing them for CNS or GALT migration.
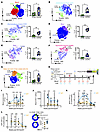 Figure 1
α4 Integrin expression and effects of blockade on T cells in blood and CSF. (A–G) T-distributed stochastic neighbor embedding (t-SNE) of CD95+α4+ CD4+ T cells across 7 tissues, color-coded by tissue. Overlays show CCR6+ (green; Th17) and CXCR3+ (blue; Th1) subsets; cells lacking CCR6 or CXCR3 retain tissue-specific coloring. Box-and-whisker plots show subset enrichment across tissues. (H) Experimental timeline. Rhesusized α4 mAb or IgG1 isotype control (25 mg/kg) administered at week –1 and every 10 days (arrows) to sustain α4 occupancy during viral eclipse. The inset shows z score–normalized mean fluorescence intensity (MFI) of infused mAb in week 3 plasma via custom autoantigen array (n = 3/group). SIV– controls (n = 4) assessed at necropsy for select indices. (I) Total lymphocyte counts after infection. (J) Blood CD4+ T cell counts after infection. CXCR3+ Th1 CD4+ T cell frequencies in (K) blood and (L) CSF. The inset in L shows CXCR3+ and CCR6+CD4+ T cell subsets in CSF at week 0. *P < 0.05; **P < 0.01; ***P < 0.001; 1-tailed paired t test (A–G) or unpaired Mann-Whitney test (L).
To evaluate α4 integrin function in vivo, we administered 25 mg/kg anti-α4 IgG1-LALA at day −7 of SIV infection (n = 4). This dose achieved serum levels exceeding the threshold for complete α4 occupancy, sustaining blockade during CNS seeding. Given the half-life of natalizumab (11 ± 4 days), we administered infusions every 10 days (32). We used an IgG1 isotype control targeting desipramine (n = 4) and SIV– controls (Figure 1H).
Weekly blood and CSF samples were collected to monitor target engagement and virologic outcomes. Plasma at week 3 after infection confirmed circulating α4 mAb in treated animals (see inset in Figure 1H). Flow cytometry confirmed anti-α4 receptor blockade on T cells in both compartments (Supplemental Figure 2A). Ex vivo incubation of preinfusion PBMCs with treated serum or CSF demonstrated α4 receptor occupancy. As expected, antibody concentrations were higher in serum than in CSF, consistent with limited IgG penetration across the blood-CSF barrier (~1,000-fold difference) (33). These findings confirm effective, sustained blockade at the time of SIV exposure.
We analyzed peripheral and CSF immune cell frequencies to assess trafficking defects. Consistent with prior reports that α4 integrin blockade impairs lymphocyte homing to GALT (29), we observed transient lymphocytosis (Figure 1I), increased circulating CD4+ T cells at weeks 1 and 3, and an increase in CD8+ T cells at week 0 (Figure 1J and Supplemental Figure 2B). Unlike α4β7 blockade, which leads to preferential accumulation of CCR6+CD4+ T cells, α4 blockade selectively increased blood Th1 CD4+ T cells at weeks 0 and 1, sparing CCR6+ CD4 and CXCR3+ CD8 populations (Figure 1K and Supplemental Figure 2B).
In CSF, Th1 cell frequencies remained stable, though a borderline increase in Th1/Th17 CXCR3+ cells at week 0 (P = 0.05) suggested transient reshaping of CNS-homing phenotypes (Figure 1L). By week 2, peripheral Th1 CD4+ T cell levels declined with progression of infection. Other immune subsets (segmented neutrophils, monocytes, eosinophils), red blood cells, and clinical parameters (hemoglobin, hematocrit, and platelet counts) remained stable between groups (Supplemental Figure 3).
α4 Blockade rewires brain immune networks impairing viral control. To define CNS-specific immune alterations following α4 blockade, we performed single-cell RNA-seq (scRNA-seq) on live CD45+ cells isolated from cryopreserved brain and spleen tissues, including SIV– control animals (3). Cell quality metrics were consistent across conditions, with low stress-related gene expression in brain and spleen CD45+ cells (Supplemental Figure 4). Uniform manifold approximation and projection (UMAP) projection confirmed leukocyte enrichment based on uniform PTPRC (CD45) expression (Figure 2A), validating integrity of sorted cells.
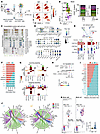 Figure 2
Single-cell transcriptomics reveals disrupted immune coordination and altered antiviral signaling in the brain following α4 blockade. (A) Single-cell RNA-seq workflow. UMAP of brain and spleen CD45+ cells show leukocyte enrichment by PTPRC expression. (B) Brain immune cluster annotation using Blueprint and ENCODE references identifies CD4+/CD8+ T cells, NK cells, and myeloid subsets. (C) ITGA4 expression across brain immune clusters. (D) Dot plots comparing α4-treated, IgG-treated, and SIV– control (Ctrl) groups: (top) CD8+ Tem gene expression, (middle) CD4+ Tcm gene expression, (bottom) Myeloid gene expression. (E) CellChat shows preserved interaction number but reduced strength for secreted signaling between CD8+ Tem and monocytes under α4-blockade. (F) Cytokine pathways enriched in IgG-treated brains (IL-1, BAFF, APRIL, BAG) versus α4-treated brains (IL-2, TNF-α, CSF), with altered CD8+ Tem-monocyte directionality. (G) Aggregate signaling shows reduced cytokine output and increased receptor input in α4-treated monocytes. (H) Ligand-receptor analysis shows increased NAMPT and reduced MIF-CD74/CD44 and TGFβ1-TGFβR1/TGFβR2 interactions with α4-blockade. (I and J) CD6 signaling is diminished in CD8+ Tem cells while LCK signaling is preserved. CD80, SELPLG, NECTIN, and SEMA7 pathways are maintained or increased. (K) SIV RNA+ cell frequencies in CD4+ T cell and monocyte clusters.
Unsupervised clustering using the Blueprint and ENCODE reference identified 5 major immune populations among 20 subclusters in the brain: CD8+ T cells (3 effector memory [Tem], 5 central memory [Tcm] clusters), myeloid cells (6, mono), NK cells (2), and CD4+ T cells. Subclusters were aggregated by lineage for UMAP projection (Figure 2B). ITGA4 was broadly expressed, highest in Tem clusters 1 and 2, monocyte cluster 5, and CD8+ Tcm cluster 15. Consolidated expression is shown in Figure 2C, and treatment-specific expression is shown in Supplemental Figure 5. In the spleen, 22 clusters were identified, including B cells absent from brain (Supplemental Figure 6, A–C).
We focused on CD8+ Tem, CD4+ Tcm, and monocyte clusters, populations linked to viral seeding and antiviral control. Dot plots compared differentially expressed genes between α4-blockade and IgG-treated animals, with SIV– controls shown as a reference. In CD8+ Tem cells, NFKB1 (2.6-fold), GNLY (3.6-fold), IL12RB2 (2-fold), and CCL5 (2.7-fold) increased with α4 treatment, indicating preserved effector priming. However, concurrent KLRB1 upregulation (3.7-fold) and downregulation of KLF2 (1.8-fold), CD6 (3.0-fold), and TNFRSF18/ICOS (4.0-fold) suggested impaired tissue residency and costimulation (Figure 2D, top). In CD4+ T cells, α4 blockade increased expression of ITGA1 (1.7-fold) and THEMIS (1.6-fold), genes associated with adhesion and TCR signaling. Downregulation of ITGB1 (1.7-fold) and TGFBR3 (1.8-fold) suggested altered cytoskeletal regulation and reduced sensitivity to TGF-β signaling. BTF3 suppression in both brain and spleen indicated broader transcriptional disruption (Figure 2D, middle). In monocytes, α4-blockade induced PD-L1 (CD274, 2.0-fold), IRF1 (1.8-fold), and SOD2 (2.4-fold), indicating enhanced checkpoint signaling and oxidative stress responses. MAMU-E (2.1-fold), DQ-A1 (2.5-fold), and RPL37 (2.4-fold) downregulation indicated reduced antigen presentation and translational activity (Figure 2D, bottom). Brain NK cells showed increased expression of GNLY (4.2-fold), IL12RB2 (4.2-fold), and SAMHD1 (2.4-fold) but reduced expression of CD226 (2.4-fold), ICOS (3.9-fold), and ITGA4 (1.6-fold), indicating cytotoxic readiness and reduced costimulation (Supplemental Figure 6D).
To assess how α4 blockade altered immune cell communication, we inferred ligand-receptor signaling from single-cell transcriptomes. Predicted interactions remained stable, but overall strength declined. The sharpest decline was at the monocyte-CD8+ Tem interface (Figure 2E and Supplemental Figure 7A). Cytokine signaling showed higher IL-1, BAFF, APRIL, and BAG activity in IgG-treated animals, reflecting greater monocyte cytokine output (Figure 2, F and G). With α4-blockade, IL-2, TNF-α, and CSF signaling increased, driven by increased IL-2 input to CD8+ Tem cells, TNF-α input to CD4/CD8 clusters and monocytes, and CSF signaling from CD8+ Tcm cells to monocytes. Ligand-receptor analysis showed selective CD4+ Tcm-monocyte remodeling, with increased NAMPT but reduced MIF-CD74+CD44 and TGFβ1-TGFβR1+TGFβR2 signaling, indicating diminished monocyte immune regulation and tissue repair (Figure 2H).
Contact-mediated signaling revealed numerically higher predicted interactions following α4 blockade (134 [a4] vs. 90 [1gG]), with similar overall strength (Supplemental Figure 7B). CD6 signaling decreased in CD8+ Tem cells, suggesting impaired synapse formation. LCK signaling remained intact across T cell subsets, reflecting preserved proximal TCR activation (Figure 2I). CD80, SELPLG, NECTIN, and SEMA7 pathways were maintained or increased, suggesting compensatory adhesion and costimulation. Chord plots showed a shift in network topology: ALCAM-CD6 interactions between myeloid cells and CD4+ Tcm cells replaced CD8+ Tem-monocyte interactions seen with IgG treatment (Figure 2J). This shift coincided with higher SIV RNA+ cell frequencies in CD4+ T cell and monocyte clusters in α4-treated brains (Figure 2K), linking disrupted CD8+ Tem-monocyte connectivity to impaired viral control.
α4 Blockade amplifies neuroimmune activation in SIV+ hippocampal brain regions. To investigate regional effects of α4 blockade on brain inflammation, we performed spatial transcriptomic profiling of the prefrontal cortex (PFC) and hippocampus (Hp) from α4- and IgG-treated macaques (n = 3/group). RNAscope-guided selection of SIV RNA+ areas informed sampling of 275 regions of interest (ROIs) for Nanostring Whole Transcriptome Atlas analysis (Figure 3A and Supplemental Figure 8). Dimensionality reduction showed that SIV RNA status, not treatment, drove most variance (Supplemental Figure 9, A and B).
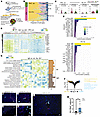 Figure 3
Neuroimmune activation and spatial immune organization in prefrontal cortex and hippocampus following α4 blockade. (A) Spatial transcriptomic workflow. RNAscope identified SIV RNA+ regions in prefrontal cortex (PFC) and hippocampus (Hp), guiding region of interest (ROI) selection for NanoString whole-transcriptome analysis (WTA). (B) Representative spatial deconvolution of SIV+ PFC ROI using a scRNA-seq–derived CD45+ brain reference. (C) Violin plots of immune subsets in SIV+ ROIs. α4-treated animals show reduced Tcm cells in PFC and Hp, with increased CD8+ Tem cells and monocytes in Hp versus IgG-treated animals. (D) Heatmap of differentially expressed genes across SIV+ and SIV– PFC ROIs from α4-treated animals (P < 0.05, |log2FC| > 0.5). (E) CellChat ligand-receptor interactions in SIV– PFC and Hp ROIs from α4-treated animals. (F) Volcano plot of pathway differences in PFC comparing α4-treated and IgG-treated groups. (G) Heatmap of top upregulated pathways in SIV+ Hp ROIs comparing α4-treated and IgG-treated animals. (H–L) RNAscope detection of SIV RNA in brain parenchyma and perivascular regions. Representative PFC images show SIV RNA+ signal (cyan) and CD3+ T cells (red). Yellow arrow indicates CD3+ SIV RNA+ cell; cyan arrowheads indicate SIV RNA+ cells near perivascular spaces. Magnified views of H and J on the left are shown in I and K. Scale bars: 50 μm (H, J, and L); 20 μm (I and K). (M) SIV RNA+ cells per cm² in PFC and Hp (mean ± SD). *P < 0.05, 2-tailed Welch’s t test.
Spatial deconvolution using the CD45+ brain scRNA-seq reference (3) showed comparable marker detection across groups within SIV– and SIV+ regions, validating immune cell representation (Supplemental Figure 9C). We focused on immune subsets relevant to viral entry and control from the scRNA-seq analysis: CD4+ Tcm, CD8+ Tem, and monocyte cells. These subsets were detected in both SIV– and SIV+ regions across groups (Figure 3B and Supplemental Figure 9D). Within α4-treated animals, SIV+ regions showed reduced CD4+ Tcm cells in both PFC and Hp, with increased CD8+ Tem cells and monocytes in SIV+ Hp (Figure 3C), patterns absent in IgG-treated animals (data not shown)
Differential expression analysis between SIV+ and SIV– PFC ROIs identified n = 269 significantly differentially expressed genes in α4-treated animals (P < 0.05, log2 fold change [FC] > 0.5) (Figure 3D and Supplemental Figure 9E). SIV+ regions upregulated genes for neuronal structure (MAP2), synaptic activity (SNAP25), metabolism (COX6C), and antiviral responses (SAMHD1, IRF1), alongside IL-17, TLR, and inflammasome signaling. SIV– regions were enriched for transcriptional and oxidative stress regulators. In Hp, 311 differentially expressed genes were enriched for neuronal, synaptic, and stress response pathways (Supplemental Figure 9F).
Within SIV– regions, CellChat predicted reduced monocyte-CD8+ Tem interactions following α4 blockade, with enriched alternative adhesion pathways. Ligand-receptor analysis of SIV– regions confirmed preserved antigen recognition and compensatory adhesion in α4-treated animals (Figure 3E), though these were insufficient to restore antiviral immunity in SIV+ regions.
We next examined transcriptional responses in SIV+ ROIs, beginning with the PFC. Between-group comparison revealed distinct PFC signatures: α4 blockade induced HIV late-phase, IL-17, and NLRP3-associated genes, while IgG treatment enhanced IRF7 and IL-10 signaling (Figure 3F). In SIV+ Hp, α4 blockade induced TLR7/8 transcripts, whereas IgG treatment preserved CD28 signaling (Figure 3G). In situ hybridization confirmed SIV+CD3+ T cells in perivascular and parenchymal compartments (Figure 3, H–L), with increased SIV RNA signal in α4-blockade regions (Figure 3M). Together, α4 blockade shifted neuroimmune responses from coordinated adaptive immunity toward innate immune activation, particularly in Hp, creating conditions permissive for viral persistence.
α4 Blockade elevates viral load in cortical gm regions. To assess the effect of α4 blockade on viral kinetics, we quantified plasma and CSF vRNA longitudinally. Peak viremia at week 2 was similar between α4- and IgG-treated animals (plasma: α4, 1.1 × 10⁸ vs. IgG, 3.2 × 10⁸; CSF: α4, 4.7 × 10⁵ vs. IgG, 9.7 × 10⁵), with similar viral trajectories (Figure 4, A and B, and Supplemental Figure 10). One α4-treated macaque (ID 41217) showed transient suppression of CSF vRNA at week 1, but CNS entry was consistently achieved across treatment groups.
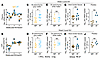 Figure 4
α4 Integrin blockade increases viral burden in brain parenchymal gray matter. (A) Plasma and (B) cerebrospinal fluid (CSF) viral RNA levels over time. (C) SIV RNA and (D) SIV DNA levels in gray matter regions, including hippocampus (Hp) and superior temporal sulcus (STS), demonstrating increased viral burden in α4-treated animals. (E) SIV RNA and (F) SIV DNA levels in neocortical white matter showing no significant differences between groups. (G and I) SIV RNA and (H and J) SIV DNA levels in border-associated tissues, including pituitary and dura. *P < 0.05 by unpaired t test.
We next examined whether α4 blockade increased tissue viral burden, as predicted by the scRNA-seq and spatial transcriptomic data. SIV RNA and DNA were significantly increased in gm regions, including the Hp and superior temporal sulcus (P < 0.05; Figure 4, C and D), implicating enhanced parenchymal seeding or reduced clearance. In contrast, vRNA in neocortical white matter (wm), dura, and pituitary were comparable across groups (Figure 4, E–J), with modest but nonsignificant pituitary vDNA increase with blockade. These data show that α4 blockade does not restrict CNS entry of SIV+ cells and instead permits viral accumulation in select gm regions where immune containment may be disrupted.
α4 Blockade does not attenuate SIV-induced microglial activation in hippocampal gm. To determine whether microglial activation was affected with blockade, we examined the hippocampal formation (HF) and PFC gm and wm matter. Quantitative morphometry revealed a significant SIV effect on IBA1 volume in the HF (ANOVA P = 0.0006), but no difference between α4 and IgG-treated animals (P = 0.48). These effects remained significant when normalized to slice volume (Figure 5, A–M). Despite reduced IBA1 volume, SIV infection did not impact microglial somas number or size in the HF (Figure 5, H and I). Multiple morphometric indices supported microglial simplification in HF. SIV infection significantly decreased microglial branchpoints (ANOVA: P = 0.0004), with reduced branching complexity in both α4 and IgG animals versus controls (IgG vs. SIV–, P = 0.0008; α4 vs. SIV–, P = 0.001) (Figure 5J). Similarly, microglial endpoints (ANOVA: P = 0.0005) and average arbor length (ANOVA: P = 0.0003) were significantly reduced. Tukey’s post hoc comparisons confirmed that α4- and IgG-treated animals (Figure 5, K and L) had significantly shorter arbors than controls (IgG vs. SIV–, P = 0.0007; α4 vs. SIV–, P = 0.0008). Thus, pronounced simplification of microglial morphology and process retraction ensued after SIV, consistent with activation (34, 35). The absence of significant infection effects on soma or territory volume (Kruskal-Wallis: H = 1.65, P = 0.48) suggests that microglia did not fully transition to an ameboid morphology associated with phagocytic activation (Figure 5M). Importantly, microglia in α4- and IgG-treated animals were morphologically indistinguishable, indicating limited effects of α4 blockade. No significant changes in microglial spatial distribution were observed across multiple metrics (Clark-Evans R: P = 0.066; Clark-Evans Z: P = 0.28; Hopkins H: P = 0.24; L–r AUC: P = 0.76).
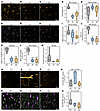 Figure 5
α4 Blockade does not attenuate SIV-induced microglial activation in hippocampal gray matter. (A–C) Hippocampal CA1 IBA1 immunolabeling. SIV– controls show ramified microglia with organized territorial distribution. SIV-infected animals (α4- and IgG-treated) show reduced arborization, fewer branches, and irregular soma morphology, indicating persistent activation; α4 blockade did not restore resting morphology. (D–F) Maximum intensity projection of 3D segmentation masks for morphometric analysis. (G–M) Microglial morphology quantification in hippocampal formation (n = 4/group; mean of 24 fields/animal). Infected animals show reduced complexity: decreased relative IBA1 volume without reduced microglial number, fewer branch points and endpoints, and reduced arbor length. (N–P) PFC gray matter HLA-DR immunolabeling. α4-Treated animals show increased HLA-DR signal with vessel-associated morphology versus SIV– controls. (Q) HLA-DR quantification in PFC gray matter shows no significant differences due to high intra-animal variability (n = 4/group; mean of 12 fields/animal). (R–T) PFC white matter IBA1/HLA-DR coimmunolabeling. In SIV– animals, HLA-DR colocalizes with IBA1+ microglia; in α4- and IgG-treated animals, HLA-DR associates more with IBA1– vessel-shaped structures. (U) HLA-DR/IBA1 colocalization quantification shows no significant differences between treatments (n = 4/group; mean of 12 fields/animal). **P < 0.01; ***P < 0.001 by 1-way ANOVA with Tukey’s HSD. Scale bar: 50 μm.
HLA-DR immunolabeling revealed high interanimal and intersectional variability, consistent with focal rather than widespread expression changes. SIV infection did not significantly alter HLA-DR metrics in the HF (HLA-DR total volume: P = 0.44; number of HLA-DR+ objects: P = 0.54; HLA-DR object size: P = 0.36; HLA-DR+/IBA1– volume: P = 0.44; HLADR+/IBA1+ volume: P = 0.55). Across animals, HLA-DR expression increased in PFC gm blood vessels (Figure 5, N–Q), but no significant SIV effect was detected on mean HLA-DR+/IBA1– volume (ANOVA: P = 0.24). Similarly, no group differences were observed in HF (ANOVA: P = 0.44) or PFC wm (ANOVA: P = 0.41). A trend toward reduced microglial HLA-DR in PFC wm did not reach statistical significance (ANOVA: P = 0.16). Colocalization analyses showed no effect of blockade on HLA-DR+/IBA1+ volume in HF (ANOVA: P = 0.55) or PFC gm (Kruskal-Wallis: P = 0.36). Thus, SIV-associated alterations in HLA-DR were spatially heterogeneous in the PFC wm, where localized downregulation was not corrected by blockade (Figure 5, R–U).
α4 Blockade reduces α4β1+ CD4 entry while preserving Th1 access. To determine whether α4 blockade altered local immune surveillance, we profiled parenchymal immune composition at week 3 after infection. Myeloid cell frequencies, including microglia and macrophages, were unchanged between groups (Supplemental Figure 11, A and B), corroborating microscopy findings that innate surveillance remained intact. In contrast, α4 blockade mitigated SIV-associated CD4+ T cell depletion in the brain parenchyma (Figure 6A) but not in the spinal cord, skull marrow, or femur (Figure 6B). A compensatory increase in CD8+ T cells in spinal cord and skull marrow was observed, indicating compartment-specific dependence on α4 integrin for T cell access.
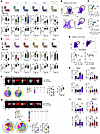 Figure 6
α4 Blockade selectively reduces integrin-dependent T cell recruitment to the brain parenchyma. (A) Frequencies of total CD4+ T cells in brain parenchyma of α4- and IgG-treated macaques at week 3 after infection. (B) CD4+ T cell frequencies in spinal cord, skull marrow, and femur. Total PBMCs were stimulated with phorbol 12-myristate 13-acetate (PMA) plus ionomycin for 5 hours. Representative intracellular staining profiles shown for cytokine and cytolytic molecules in (C) CD4+ T cells and (D) CD8+ T cells (n = 3, IgG; n = 4, α4). (E) Flow plot of CCR5/CXCR3 expression in CD28– and CD28+ CD4+ T cells in brain. (F) Correlation between CD28–CXCR3+CD4+ T cell frequency and vRNA copies in hippocampal and PFC gray matter (Spearman). (G) Inverse correlation between α4β7+CD8+ T cell frequency and hippocampal vRNA (Spearman). (H and I) Frequencies of (I) α4β7+ and (H) α4β1+ CD4+ and CD8+ T cells in brain parenchyma and spleen Chr, chronic SIV. Data represent individual animals; lines indicate medians. *P < 0.05, unpaired t test. Experiments are representative of at least 3 independent replicates.
To assess whether cytokine production in T cells was decreased following blockade, we measured T cell responses to Gag, Env, and Pol in blood, as sufficient cells for stimulation were unavailable from the brain. Conventional ICS detected no Env-specific responses, and Pol or Gag responses were observed in only 1 animal (37164, IgG) and were restricted to CD8+ T cells (Supplemental Figure 11C). This pattern is consistent with antigen-specific T cell responses, typically peaking around week 8 after infection (36, 37).
To determine whether the absence of detectable antigen-specific responses reflected impaired cytokine production capacity rather than limited generation of antigen-specific T cells, we assessed cytokine production together with CD107a/b and granzyme B expression following PMA and ionomycin stimulation. CD4+ and CD8+ T cells in both groups exhibited preserved cytokine and effector responses to PMA and ionomycin. In CD4+ T cells, responses were dominated by TNF-α and IL-2, with minimal IFN-γ and limited polyfunctionality (Figure 6C). CD8+ T cells showed high granzyme B expression, largely independent of stimulation, together with readily detectable CD107a/b, IFN-γ, and TNF-α responses, indicating intact cytotoxic effector potential during α4 blockade (Figure 6D).
Within the brain, blockade mitigated Th1 depletion, increasing CXCR3+CD4+ T cell frequencies while maintaining stable CD28 and CCR5/CCR7 subset proportions (Supplemental Figure 11, D and E). Because CCR5+CD4+ T cells concentrate within the Th1 pool (Figure 6E), we reasoned that their enrichment could sustain viral replication. Given elevated α4 expression on CD28– effectors, we examined CD28-defined subsets and found that CD28–CXCR3+CD4+ T cell frequencies, but not CD28+ cells, correlated positively with vRNA in hippocampal and PFC gm, though not in PFC wm (Figure 6F).
To assess associations between CD8+ T cells and viral load, we examined integrin-defined subsets. In the Hp, α4β7+ but not α4β1+ CD8+ T cell frequencies correlated inversely with vRNA, implicating α4β7-mediated trafficking in local cytotoxic containment (Figure 6G). These correlations, however, being based on small group sizes should be interpreted with caution. α4 Blockade significantly reduced α4β1+CD4+ T cells in the brain parenchyma (Figure 6H), while α4β7+CD8+ T cells were similarly diminished, indicating selective impairment of integrin-dependent recruitment (Figure 6I).
In summary, α4 blockade preserved high Th1 frequencies in the brain rather than restricting CD4+ T cell access, suggesting early viral seeding proceeded unimpeded. The concomitant increase in parenchymal viral burden, coupled with loss of α4β7+CD8+ T cells, implicates α4 integrin in recruiting CD8 effectors to the CNS. To directly test this requirement, we employed a conditional knockout mouse model with α4 selectively deleted in CD4+ or CD8+ T cells, using LPS-induced neuroinflammation to define lineage-specific α4 dependence for CNS trafficking.
α4 Integrin permits CD4+ T cell access to CNS borders but is dispensable for parenchymal entry. To test the requirement for α4 in CNS T cell entry, we generated CD4CreItga4fl/fl:mT/mG (CD4ΔItga4) and CD8CreItga4fl/fl:mT/mG (CD8ΔItga4) mice, dual-reporter strains enabling lineage tracing via tdTomato-to-GFP switch upon α4 deletion. GFP+tdTomato–CD4+ T cells lacked α4, confirming efficient deletion (Figure 7A). CD4ΔItga4 T cell development was intact, consistent with prior reports in global Itga4–/– mice (38, 39). CD4ΔItga4 T cells accumulated in blood and spleen and were reduced in Peyer’s patches (Figure 7B and Supplemental Figure 12A), mirroring redistribution observed with α4 blockade in macaques. Blood CD4ΔItga4 T cells showed increased CD44, CXCR3, and LFA-1 expression (Figure 7C), consistent with compensatory adhesion and chemotactic programs (40, 41). PSGL-1, PD-1, Foxp3, cytokine production, and memory subsets were unchanged (Supplemental Figure 12, B and C). CD4ΔItga4 T cell frequencies in brain and liver were preserved (Figure 7, D and E), and brain myeloid composition was unchanged (Supplemental Figure 12D), indicating that α4 is dispensable for constitutive CD4+ T cell entry into the brain parenchyma.
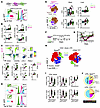 Figure 7
α4 Integrin is dispensable for CD4+ T cell access to the brain parenchyma at homeostasis. (A) CD4ΔItga4 dual-reporter system: Cre-mediated Itga4 deletion induces tdTomato-to-GFP switch. Flow plots identify GFP+tdTomato– CD4+ T cells lacking surface α4. (B) CD4+ T cell frequencies in blood and spleen at steady state. (C) Phenotypic profiling of circulating and splenic CD4+ T cells; color intensity reflects α4 MFI. (D) Flow plots and quantification of GFP+CD4+ T cells in brain parenchyma and liver at steady state. (E) t-SNE of CD45+ brain cells identifying CD4+ T cell populations by reporter status (tdTomato+, pink; GFP+, green) and myeloid cells (brown). Scatterplots show CD3 and CD4 frequencies in brain and liver. (F) Experimental design for LPS-induced systemic inflammation (i.p.). (G) Body weight loss from days 1–5 after LPS (solid line, LPS; dashed line, PBS). (H) t-SNE of blood CD4+ T cells after LPS showing genotypes, highlighting clustering of CD29+ (blue) and Foxp3+ (green) populations. (I) Phenotypic profiling of blood CD4+ T cells after LPS showing comparable induction of activation and trafficking markers across genotypes. (J) Boolean analysis of CXCR3, LFA-1, and PSGL-1 in blood CD4+ T cells showing preserved CNS-trafficking profiles. n = 3–8 animals per group from ≥3 independent experiments. **P < 0.01; ***P < 0.001, 1-tailed unpaired t test (B); *P < 0.05, paired t test (G) *P < 0.05, **P < 0.01; ***P < 0.001; ****P < 0.0001. One-tailed, unpaired t-test was used in C and I. Experiments are representative of at least 3 independent replicates.
To isolate α4-dependent trafficking mechanisms during neuroinflammation while avoiding confounding CD4 depletion in HIV infection models, we used LPS-induced neuroinflammation, which recapitulates systemic and CNS immune activation seen in acute HIV (42–44) (Figure 7F). CD4ΔItga4 and Itga4fl/fl mice exhibited comparable weight loss (Figure 7G). Blood T cell activation and induction of β1 (CD29), Foxp3, and effector markers (CD44, Ki-67, PD-1, CXCR3) (Figure 7, H and I) were similar across genotypes, indicating that α4 is dispensable for CD4+ T cell effector differentiation during systemic inflammation. To test whether α4 contributes to acquisition of a CNS-trafficking phenotype, we performed Boolean analysis of CXCR3, LFA-1, and PSGL-1. Most circulating CD4+ T cells expressed PSGL-1, with subsets coexpressing LFA-1 and/or CXCR3. These profiles were preserved or modestly enriched in CD4ΔItga4 T cells (Figure 7J), indicating that activation and migratory programing proceed independently of α4 signaling. In the spleen, LPS induced CD44, LFA-1, CD29, CXCR3, PD-1, and Foxp3 expression in both genotypes; however, CD44 and CXCR3 frequencies were higher in CD4ΔItga4 mice, whereas Foxp3 frequencies were lower, indicating partial α4 dependence in helper T cell differentiation (Figure 8A).
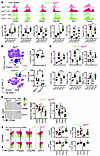 Figure 8
α4 Integrin is dispensable for CD4+ T cell access to the brain parenchyma during systemic inflammation. (A) Activation and trafficking marker expression in splenic CD4+ T cells after LPS. Histograms: GFP+ (green) and tdTomato+ (pink) CD4+ T cells; scatterplots quantify marker frequencies. (B) t-SNE of CD3+ brain cells showing CD4+ T cells by reporter status (tdTomato+, pink; GFP+, green) with CD29 overlay (blue). Scatterplots show CD4 frequencies and counts in brain. (C) Phenotypic profiling of brain-infiltrating CD4+ T cells after LPS across genotypes. (D) Heatmap showing α4 MFI across CD4+ T cell populations in skull marrow and dura. Scatterplots show CD4 frequencies in PBS- and LPS-treated mice. (E) Flow plots and quantification of CD4+ T cell phenotype in skull marrow (GFP+, green; tdTomato+, pink). n = 3–5 animals per group from ≥3 independent experiments. *P < 0.05; **P < 0.01; ***P < 0.001; ****P < 0.0001, unpaired t test unless otherwise indicated. Experiments are representative of at least 3 independent replicates.
Within the brain, CD4ΔItga4 T cells infiltrated the brain parenchyma comparably to α4fl/fl controls (Figure 8B). Ki-67 and CXCR3 expression confirmed CD4ΔItga4 effector access to inflamed parenchyma (Figure 8, B and C). Although CD29 (β1) and LFA-1 were reduced, PSGL-1 was upregulated, suggesting compensatory selectin-mediated adhesion. This aligned with CellChat-inferred selectin pathway enrichment in macaque data α4 blockade (Figure 2I and Figure 3C), supporting cross-species concordance.
In contrast, CD4ΔItga4 T cell frequencies were reduced in CNS border compartments, skull marrow, and dura, where α4 expression was high (Figure 8D and Supplemental Figure 12E), mirroring macaque α4-blockade findings and indicating compartment-specific α4 requirements. Residual skull marrow CD4+ T cells retained a Th1-like phenotype with CXCR3 expression (Figure 8E).
Liver recruitment was unaffected (Supplemental Figure 12F), indicating that α4 selectively regulates CNS border access rather than general tissue homing. Together, these data show that α4 integrin is dispensable for CD4+ T cell infiltration of brain parenchyma during inflammation but required for skull marrow access.
CD8+ T cell effectors require α4 integrin for CNS entry during inflammation. To define α4 requirements for CD8+ T cell CNS trafficking, we analyzed CD8ΔItga4 mice. In contrast to that seen in CD4ΔItga4 mice, fully recombined α4-deleted CD8+ T cells were significantly reduced in brain parenchyma compared with that in Itga4fl/fl controls (Figure 9A), indicating impaired steady-state CNS entry. CD8ΔItga4 mice displayed mosaic recombination (70% fully, 20% partially, 10% nonrecombined; Figure 9B and Supplemental Figure 13). Despite this heterogeneity, total brain CD8+ T cell frequencies were reduced, supporting a cell-intrinsic requirement for α4 in parenchymal access.
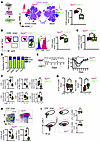 Figure 9
α4 Integrin regulates CD8+ T cell migration into the CNS and its borders. (A) CD8ΔItga4 dual-reporter system. Cre-mediated Itga4 deletion induces tdTomato-to-GFP switch. t-SNE of CD45+ brain leukocytes identifies CD8+ T cells by reporter status. Scatterplots show frequencies of fully recombined (GFP+tdTomato–) CD8+ T cells in brain. (B) Mosaic recombination pattern in CD8ΔItga4 mice and corresponding reduction in total brain CD8+ T cell frequencies. (C) CD8+ T cell frequencies in spleen. (D) CD8+ T cell recombination state distribution across blood, spleen, brain, and liver. (E) LPS-induced systemic inflammation (i.p.) and body weight loss from days 1–5 after LPS. (F) Reduced accumulation of fully recombined CD8+ T cells in brain parenchyma, skull marrow, and dura, despite preserved blood frequencies. (G) Ki-67 and PD-1 expression on circulating CD8+ T cells after LPS. (H) Total Ki-67+ and PD-1+CD8+ T cell numbers in brain. (I) LFA-1 and PSGL-1 expression on brain-infiltrating CD8+ T cells. n = 3–5 animals per group from ≥3 independent experiments. *P < 0.05; **P < 0.01; ***P < 0.001; ****P < 0.0001, unpaired t test unless otherwise indicated; *P < 0.05 by paired comparison of day 0 to subsequent time points (E). Experiments are representative of at least 3 independent replicates.
Splenic CD8ΔItga4 T cell frequencies were preserved (Figure 9C). Contingency analysis revealed similar proportions of recombination states across blood, spleen, brain, and liver (Figure 9D), indicating intact peripheral distribution and selective CNS trafficking defect rather than developmental impairment.
During LPS-induced neuroinflammation (Figure 9E), fully recombined CD8ΔItga4 T cells failed to accumulate in brain parenchyma, dura, and skull marrow, despite normal frequencies in circulation (Figure 9F), indicating a persistent cell-intrinsic trafficking defect. Following LPS, CD8ΔItga4 T cells upregulated Ki-67 and PD-1 in the blood with no differences in the former across genotypes (Figure 9G), confirming intact activation. Reduced CNS frequencies of CD8ΔItga4 T cell effectors (Figure 9H) therefore reflect impaired effector recruitment rather than defective differentiation. LFA-1 and PSGL-1 expression remained unchanged (Figure 9I), suggesting no compensatory engagement of alternative adhesion pathways.
Together with these findings from CD4ΔItga4 T cells, these data define a lineage- and compartment-specific role for α4 in CNS immune surveillance. α4 is dispensable for CD4+ T cell parenchymal entry but required for CNS border access. In contrast, CD8 effector recruitment to all CNS compartments depends on α4 at steady state and during inflammation. This framework explains the macaque phenotype, where preserved CD4 entry coincides with impaired CD8 access, compromising antiviral control in the inflamed brain.


Copyright © 2026 American Society for Clinical Investigation
ISSN: 0021-9738 (print), 1558-8238 (online)