Advertisement
Research ArticleHepatologyMetabolism
Open Access | ![]() 10.1172/JCI191021
10.1172/JCI191021
Ketogenesis mitigates metabolic dysfunction–associated steatotic liver disease through mechanisms that extend beyond fat oxidation
Eric D. Queathem,1,2,3 David B. Stagg,1 Alisa B. Nelson,1 Alec B. Chaves,4 Scott B. Crown,4 Kyle Fulghum,1 D. Andre d’Avignon,1 Justin R. Ryder,5,6 Patrick J. Bolan,7 Abdirahman Hayir,1 Jacob R. Gillingham,1,2 Shannon Jannatpour,8 Ferrol I. Rome,1 Ashley S. Williams,4 Deborah M. Muoio,4,9,10 Sayeed Ikramuddin,8 Curtis C. Hughey,1 Patrycja Puchalska,1 and Peter A. Crawford1,2
1Division of Molecular Medicine, Department of Medicine,
2Department of Biochemistry, Molecular Biology and Biophysics, and
3Department of Integrative Biology and Physiology, University of Minnesota Medical School, Minneapolis, Minnesota, USA.
4Duke Molecular Physiology Institute and Sarah W. Stedman Nutrition and Metabolism Center, Duke University Medical Center, Durham, North Carolina, USA.
5Department of Surgery, Lurie Children’s Hospital, Chicago, Illinois, USA.
6Department of Surgery, Northwestern University Feinberg School of Medicine, Chicago, Illinois, USA.
7Department of Radiology, University of Minnesota Medical School, Minneapolis, Minnesota, USA.
8Department of Surgery, University of Minnesota, Minneapolis, Minnesota, USA.
9Division of Endocrinology, Metabolism, and Nutrition, Department of Medicine, and
10Department of Pharmacology and Cancer Biology, Duke University Medical Center, Durham, North Carolina, USA.
Address correspondence to: Patrycja Puchalska or Peter A. Crawford, Division of Molecular Medicine, Department of Medicine, University of Minnesota Medical School, 425 E. River Parkway, Dwan Building, Minneapolis, Minnesota 55455-0368, USA. Phone: 612.301.2202; Email: ppuchals@umn.edu (PP); Email: crawforp@umn.edu (PAC).
Find articles by Queathem, E. in: PubMed | Google Scholar
1Division of Molecular Medicine, Department of Medicine,
2Department of Biochemistry, Molecular Biology and Biophysics, and
3Department of Integrative Biology and Physiology, University of Minnesota Medical School, Minneapolis, Minnesota, USA.
4Duke Molecular Physiology Institute and Sarah W. Stedman Nutrition and Metabolism Center, Duke University Medical Center, Durham, North Carolina, USA.
5Department of Surgery, Lurie Children’s Hospital, Chicago, Illinois, USA.
6Department of Surgery, Northwestern University Feinberg School of Medicine, Chicago, Illinois, USA.
7Department of Radiology, University of Minnesota Medical School, Minneapolis, Minnesota, USA.
8Department of Surgery, University of Minnesota, Minneapolis, Minnesota, USA.
9Division of Endocrinology, Metabolism, and Nutrition, Department of Medicine, and
10Department of Pharmacology and Cancer Biology, Duke University Medical Center, Durham, North Carolina, USA.
Address correspondence to: Patrycja Puchalska or Peter A. Crawford, Division of Molecular Medicine, Department of Medicine, University of Minnesota Medical School, 425 E. River Parkway, Dwan Building, Minneapolis, Minnesota 55455-0368, USA. Phone: 612.301.2202; Email: ppuchals@umn.edu (PP); Email: crawforp@umn.edu (PAC).
Find articles by
Stagg, D.
in:
PubMed
|
Google Scholar
|

1Division of Molecular Medicine, Department of Medicine,
2Department of Biochemistry, Molecular Biology and Biophysics, and
3Department of Integrative Biology and Physiology, University of Minnesota Medical School, Minneapolis, Minnesota, USA.
4Duke Molecular Physiology Institute and Sarah W. Stedman Nutrition and Metabolism Center, Duke University Medical Center, Durham, North Carolina, USA.
5Department of Surgery, Lurie Children’s Hospital, Chicago, Illinois, USA.
6Department of Surgery, Northwestern University Feinberg School of Medicine, Chicago, Illinois, USA.
7Department of Radiology, University of Minnesota Medical School, Minneapolis, Minnesota, USA.
8Department of Surgery, University of Minnesota, Minneapolis, Minnesota, USA.
9Division of Endocrinology, Metabolism, and Nutrition, Department of Medicine, and
10Department of Pharmacology and Cancer Biology, Duke University Medical Center, Durham, North Carolina, USA.
Address correspondence to: Patrycja Puchalska or Peter A. Crawford, Division of Molecular Medicine, Department of Medicine, University of Minnesota Medical School, 425 E. River Parkway, Dwan Building, Minneapolis, Minnesota 55455-0368, USA. Phone: 612.301.2202; Email: ppuchals@umn.edu (PP); Email: crawforp@umn.edu (PAC).
Find articles by
Nelson, A.
in:
PubMed
|
Google Scholar
|
1Division of Molecular Medicine, Department of Medicine,
2Department of Biochemistry, Molecular Biology and Biophysics, and
3Department of Integrative Biology and Physiology, University of Minnesota Medical School, Minneapolis, Minnesota, USA.
4Duke Molecular Physiology Institute and Sarah W. Stedman Nutrition and Metabolism Center, Duke University Medical Center, Durham, North Carolina, USA.
5Department of Surgery, Lurie Children’s Hospital, Chicago, Illinois, USA.
6Department of Surgery, Northwestern University Feinberg School of Medicine, Chicago, Illinois, USA.
7Department of Radiology, University of Minnesota Medical School, Minneapolis, Minnesota, USA.
8Department of Surgery, University of Minnesota, Minneapolis, Minnesota, USA.
9Division of Endocrinology, Metabolism, and Nutrition, Department of Medicine, and
10Department of Pharmacology and Cancer Biology, Duke University Medical Center, Durham, North Carolina, USA.
Address correspondence to: Patrycja Puchalska or Peter A. Crawford, Division of Molecular Medicine, Department of Medicine, University of Minnesota Medical School, 425 E. River Parkway, Dwan Building, Minneapolis, Minnesota 55455-0368, USA. Phone: 612.301.2202; Email: ppuchals@umn.edu (PP); Email: crawforp@umn.edu (PAC).
Find articles by Chaves, A. in: PubMed | Google Scholar
1Division of Molecular Medicine, Department of Medicine,
2Department of Biochemistry, Molecular Biology and Biophysics, and
3Department of Integrative Biology and Physiology, University of Minnesota Medical School, Minneapolis, Minnesota, USA.
4Duke Molecular Physiology Institute and Sarah W. Stedman Nutrition and Metabolism Center, Duke University Medical Center, Durham, North Carolina, USA.
5Department of Surgery, Lurie Children’s Hospital, Chicago, Illinois, USA.
6Department of Surgery, Northwestern University Feinberg School of Medicine, Chicago, Illinois, USA.
7Department of Radiology, University of Minnesota Medical School, Minneapolis, Minnesota, USA.
8Department of Surgery, University of Minnesota, Minneapolis, Minnesota, USA.
9Division of Endocrinology, Metabolism, and Nutrition, Department of Medicine, and
10Department of Pharmacology and Cancer Biology, Duke University Medical Center, Durham, North Carolina, USA.
Address correspondence to: Patrycja Puchalska or Peter A. Crawford, Division of Molecular Medicine, Department of Medicine, University of Minnesota Medical School, 425 E. River Parkway, Dwan Building, Minneapolis, Minnesota 55455-0368, USA. Phone: 612.301.2202; Email: ppuchals@umn.edu (PP); Email: crawforp@umn.edu (PAC).
Find articles by Crown, S. in: PubMed | Google Scholar
1Division of Molecular Medicine, Department of Medicine,
2Department of Biochemistry, Molecular Biology and Biophysics, and
3Department of Integrative Biology and Physiology, University of Minnesota Medical School, Minneapolis, Minnesota, USA.
4Duke Molecular Physiology Institute and Sarah W. Stedman Nutrition and Metabolism Center, Duke University Medical Center, Durham, North Carolina, USA.
5Department of Surgery, Lurie Children’s Hospital, Chicago, Illinois, USA.
6Department of Surgery, Northwestern University Feinberg School of Medicine, Chicago, Illinois, USA.
7Department of Radiology, University of Minnesota Medical School, Minneapolis, Minnesota, USA.
8Department of Surgery, University of Minnesota, Minneapolis, Minnesota, USA.
9Division of Endocrinology, Metabolism, and Nutrition, Department of Medicine, and
10Department of Pharmacology and Cancer Biology, Duke University Medical Center, Durham, North Carolina, USA.
Address correspondence to: Patrycja Puchalska or Peter A. Crawford, Division of Molecular Medicine, Department of Medicine, University of Minnesota Medical School, 425 E. River Parkway, Dwan Building, Minneapolis, Minnesota 55455-0368, USA. Phone: 612.301.2202; Email: ppuchals@umn.edu (PP); Email: crawforp@umn.edu (PAC).
Find articles by Fulghum, K. in: PubMed | Google Scholar
1Division of Molecular Medicine, Department of Medicine,
2Department of Biochemistry, Molecular Biology and Biophysics, and
3Department of Integrative Biology and Physiology, University of Minnesota Medical School, Minneapolis, Minnesota, USA.
4Duke Molecular Physiology Institute and Sarah W. Stedman Nutrition and Metabolism Center, Duke University Medical Center, Durham, North Carolina, USA.
5Department of Surgery, Lurie Children’s Hospital, Chicago, Illinois, USA.
6Department of Surgery, Northwestern University Feinberg School of Medicine, Chicago, Illinois, USA.
7Department of Radiology, University of Minnesota Medical School, Minneapolis, Minnesota, USA.
8Department of Surgery, University of Minnesota, Minneapolis, Minnesota, USA.
9Division of Endocrinology, Metabolism, and Nutrition, Department of Medicine, and
10Department of Pharmacology and Cancer Biology, Duke University Medical Center, Durham, North Carolina, USA.
Address correspondence to: Patrycja Puchalska or Peter A. Crawford, Division of Molecular Medicine, Department of Medicine, University of Minnesota Medical School, 425 E. River Parkway, Dwan Building, Minneapolis, Minnesota 55455-0368, USA. Phone: 612.301.2202; Email: ppuchals@umn.edu (PP); Email: crawforp@umn.edu (PAC).
Find articles by d’Avignon, D. in: PubMed | Google Scholar
1Division of Molecular Medicine, Department of Medicine,
2Department of Biochemistry, Molecular Biology and Biophysics, and
3Department of Integrative Biology and Physiology, University of Minnesota Medical School, Minneapolis, Minnesota, USA.
4Duke Molecular Physiology Institute and Sarah W. Stedman Nutrition and Metabolism Center, Duke University Medical Center, Durham, North Carolina, USA.
5Department of Surgery, Lurie Children’s Hospital, Chicago, Illinois, USA.
6Department of Surgery, Northwestern University Feinberg School of Medicine, Chicago, Illinois, USA.
7Department of Radiology, University of Minnesota Medical School, Minneapolis, Minnesota, USA.
8Department of Surgery, University of Minnesota, Minneapolis, Minnesota, USA.
9Division of Endocrinology, Metabolism, and Nutrition, Department of Medicine, and
10Department of Pharmacology and Cancer Biology, Duke University Medical Center, Durham, North Carolina, USA.
Address correspondence to: Patrycja Puchalska or Peter A. Crawford, Division of Molecular Medicine, Department of Medicine, University of Minnesota Medical School, 425 E. River Parkway, Dwan Building, Minneapolis, Minnesota 55455-0368, USA. Phone: 612.301.2202; Email: ppuchals@umn.edu (PP); Email: crawforp@umn.edu (PAC).
Find articles by Ryder, J. in: PubMed | Google Scholar
1Division of Molecular Medicine, Department of Medicine,
2Department of Biochemistry, Molecular Biology and Biophysics, and
3Department of Integrative Biology and Physiology, University of Minnesota Medical School, Minneapolis, Minnesota, USA.
4Duke Molecular Physiology Institute and Sarah W. Stedman Nutrition and Metabolism Center, Duke University Medical Center, Durham, North Carolina, USA.
5Department of Surgery, Lurie Children’s Hospital, Chicago, Illinois, USA.
6Department of Surgery, Northwestern University Feinberg School of Medicine, Chicago, Illinois, USA.
7Department of Radiology, University of Minnesota Medical School, Minneapolis, Minnesota, USA.
8Department of Surgery, University of Minnesota, Minneapolis, Minnesota, USA.
9Division of Endocrinology, Metabolism, and Nutrition, Department of Medicine, and
10Department of Pharmacology and Cancer Biology, Duke University Medical Center, Durham, North Carolina, USA.
Address correspondence to: Patrycja Puchalska or Peter A. Crawford, Division of Molecular Medicine, Department of Medicine, University of Minnesota Medical School, 425 E. River Parkway, Dwan Building, Minneapolis, Minnesota 55455-0368, USA. Phone: 612.301.2202; Email: ppuchals@umn.edu (PP); Email: crawforp@umn.edu (PAC).
Find articles by Bolan, P. in: PubMed | Google Scholar
1Division of Molecular Medicine, Department of Medicine,
2Department of Biochemistry, Molecular Biology and Biophysics, and
3Department of Integrative Biology and Physiology, University of Minnesota Medical School, Minneapolis, Minnesota, USA.
4Duke Molecular Physiology Institute and Sarah W. Stedman Nutrition and Metabolism Center, Duke University Medical Center, Durham, North Carolina, USA.
5Department of Surgery, Lurie Children’s Hospital, Chicago, Illinois, USA.
6Department of Surgery, Northwestern University Feinberg School of Medicine, Chicago, Illinois, USA.
7Department of Radiology, University of Minnesota Medical School, Minneapolis, Minnesota, USA.
8Department of Surgery, University of Minnesota, Minneapolis, Minnesota, USA.
9Division of Endocrinology, Metabolism, and Nutrition, Department of Medicine, and
10Department of Pharmacology and Cancer Biology, Duke University Medical Center, Durham, North Carolina, USA.
Address correspondence to: Patrycja Puchalska or Peter A. Crawford, Division of Molecular Medicine, Department of Medicine, University of Minnesota Medical School, 425 E. River Parkway, Dwan Building, Minneapolis, Minnesota 55455-0368, USA. Phone: 612.301.2202; Email: ppuchals@umn.edu (PP); Email: crawforp@umn.edu (PAC).
Find articles by Hayir, A. in: PubMed | Google Scholar
1Division of Molecular Medicine, Department of Medicine,
2Department of Biochemistry, Molecular Biology and Biophysics, and
3Department of Integrative Biology and Physiology, University of Minnesota Medical School, Minneapolis, Minnesota, USA.
4Duke Molecular Physiology Institute and Sarah W. Stedman Nutrition and Metabolism Center, Duke University Medical Center, Durham, North Carolina, USA.
5Department of Surgery, Lurie Children’s Hospital, Chicago, Illinois, USA.
6Department of Surgery, Northwestern University Feinberg School of Medicine, Chicago, Illinois, USA.
7Department of Radiology, University of Minnesota Medical School, Minneapolis, Minnesota, USA.
8Department of Surgery, University of Minnesota, Minneapolis, Minnesota, USA.
9Division of Endocrinology, Metabolism, and Nutrition, Department of Medicine, and
10Department of Pharmacology and Cancer Biology, Duke University Medical Center, Durham, North Carolina, USA.
Address correspondence to: Patrycja Puchalska or Peter A. Crawford, Division of Molecular Medicine, Department of Medicine, University of Minnesota Medical School, 425 E. River Parkway, Dwan Building, Minneapolis, Minnesota 55455-0368, USA. Phone: 612.301.2202; Email: ppuchals@umn.edu (PP); Email: crawforp@umn.edu (PAC).
Find articles by
Gillingham, J.
in:
PubMed
|
Google Scholar
|
1Division of Molecular Medicine, Department of Medicine,
2Department of Biochemistry, Molecular Biology and Biophysics, and
3Department of Integrative Biology and Physiology, University of Minnesota Medical School, Minneapolis, Minnesota, USA.
4Duke Molecular Physiology Institute and Sarah W. Stedman Nutrition and Metabolism Center, Duke University Medical Center, Durham, North Carolina, USA.
5Department of Surgery, Lurie Children’s Hospital, Chicago, Illinois, USA.
6Department of Surgery, Northwestern University Feinberg School of Medicine, Chicago, Illinois, USA.
7Department of Radiology, University of Minnesota Medical School, Minneapolis, Minnesota, USA.
8Department of Surgery, University of Minnesota, Minneapolis, Minnesota, USA.
9Division of Endocrinology, Metabolism, and Nutrition, Department of Medicine, and
10Department of Pharmacology and Cancer Biology, Duke University Medical Center, Durham, North Carolina, USA.
Address correspondence to: Patrycja Puchalska or Peter A. Crawford, Division of Molecular Medicine, Department of Medicine, University of Minnesota Medical School, 425 E. River Parkway, Dwan Building, Minneapolis, Minnesota 55455-0368, USA. Phone: 612.301.2202; Email: ppuchals@umn.edu (PP); Email: crawforp@umn.edu (PAC).
Find articles by Jannatpour, S. in: PubMed | Google Scholar
1Division of Molecular Medicine, Department of Medicine,
2Department of Biochemistry, Molecular Biology and Biophysics, and
3Department of Integrative Biology and Physiology, University of Minnesota Medical School, Minneapolis, Minnesota, USA.
4Duke Molecular Physiology Institute and Sarah W. Stedman Nutrition and Metabolism Center, Duke University Medical Center, Durham, North Carolina, USA.
5Department of Surgery, Lurie Children’s Hospital, Chicago, Illinois, USA.
6Department of Surgery, Northwestern University Feinberg School of Medicine, Chicago, Illinois, USA.
7Department of Radiology, University of Minnesota Medical School, Minneapolis, Minnesota, USA.
8Department of Surgery, University of Minnesota, Minneapolis, Minnesota, USA.
9Division of Endocrinology, Metabolism, and Nutrition, Department of Medicine, and
10Department of Pharmacology and Cancer Biology, Duke University Medical Center, Durham, North Carolina, USA.
Address correspondence to: Patrycja Puchalska or Peter A. Crawford, Division of Molecular Medicine, Department of Medicine, University of Minnesota Medical School, 425 E. River Parkway, Dwan Building, Minneapolis, Minnesota 55455-0368, USA. Phone: 612.301.2202; Email: ppuchals@umn.edu (PP); Email: crawforp@umn.edu (PAC).
Find articles by Rome, F. in: PubMed | Google Scholar
1Division of Molecular Medicine, Department of Medicine,
2Department of Biochemistry, Molecular Biology and Biophysics, and
3Department of Integrative Biology and Physiology, University of Minnesota Medical School, Minneapolis, Minnesota, USA.
4Duke Molecular Physiology Institute and Sarah W. Stedman Nutrition and Metabolism Center, Duke University Medical Center, Durham, North Carolina, USA.
5Department of Surgery, Lurie Children’s Hospital, Chicago, Illinois, USA.
6Department of Surgery, Northwestern University Feinberg School of Medicine, Chicago, Illinois, USA.
7Department of Radiology, University of Minnesota Medical School, Minneapolis, Minnesota, USA.
8Department of Surgery, University of Minnesota, Minneapolis, Minnesota, USA.
9Division of Endocrinology, Metabolism, and Nutrition, Department of Medicine, and
10Department of Pharmacology and Cancer Biology, Duke University Medical Center, Durham, North Carolina, USA.
Address correspondence to: Patrycja Puchalska or Peter A. Crawford, Division of Molecular Medicine, Department of Medicine, University of Minnesota Medical School, 425 E. River Parkway, Dwan Building, Minneapolis, Minnesota 55455-0368, USA. Phone: 612.301.2202; Email: ppuchals@umn.edu (PP); Email: crawforp@umn.edu (PAC).
Find articles by Williams, A. in: PubMed | Google Scholar
1Division of Molecular Medicine, Department of Medicine,
2Department of Biochemistry, Molecular Biology and Biophysics, and
3Department of Integrative Biology and Physiology, University of Minnesota Medical School, Minneapolis, Minnesota, USA.
4Duke Molecular Physiology Institute and Sarah W. Stedman Nutrition and Metabolism Center, Duke University Medical Center, Durham, North Carolina, USA.
5Department of Surgery, Lurie Children’s Hospital, Chicago, Illinois, USA.
6Department of Surgery, Northwestern University Feinberg School of Medicine, Chicago, Illinois, USA.
7Department of Radiology, University of Minnesota Medical School, Minneapolis, Minnesota, USA.
8Department of Surgery, University of Minnesota, Minneapolis, Minnesota, USA.
9Division of Endocrinology, Metabolism, and Nutrition, Department of Medicine, and
10Department of Pharmacology and Cancer Biology, Duke University Medical Center, Durham, North Carolina, USA.
Address correspondence to: Patrycja Puchalska or Peter A. Crawford, Division of Molecular Medicine, Department of Medicine, University of Minnesota Medical School, 425 E. River Parkway, Dwan Building, Minneapolis, Minnesota 55455-0368, USA. Phone: 612.301.2202; Email: ppuchals@umn.edu (PP); Email: crawforp@umn.edu (PAC).
Find articles by
Muoio, D.
in:
PubMed
|
Google Scholar
|
1Division of Molecular Medicine, Department of Medicine,
2Department of Biochemistry, Molecular Biology and Biophysics, and
3Department of Integrative Biology and Physiology, University of Minnesota Medical School, Minneapolis, Minnesota, USA.
4Duke Molecular Physiology Institute and Sarah W. Stedman Nutrition and Metabolism Center, Duke University Medical Center, Durham, North Carolina, USA.
5Department of Surgery, Lurie Children’s Hospital, Chicago, Illinois, USA.
6Department of Surgery, Northwestern University Feinberg School of Medicine, Chicago, Illinois, USA.
7Department of Radiology, University of Minnesota Medical School, Minneapolis, Minnesota, USA.
8Department of Surgery, University of Minnesota, Minneapolis, Minnesota, USA.
9Division of Endocrinology, Metabolism, and Nutrition, Department of Medicine, and
10Department of Pharmacology and Cancer Biology, Duke University Medical Center, Durham, North Carolina, USA.
Address correspondence to: Patrycja Puchalska or Peter A. Crawford, Division of Molecular Medicine, Department of Medicine, University of Minnesota Medical School, 425 E. River Parkway, Dwan Building, Minneapolis, Minnesota 55455-0368, USA. Phone: 612.301.2202; Email: ppuchals@umn.edu (PP); Email: crawforp@umn.edu (PAC).
Find articles by Ikramuddin, S. in: PubMed | Google Scholar
1Division of Molecular Medicine, Department of Medicine,
2Department of Biochemistry, Molecular Biology and Biophysics, and
3Department of Integrative Biology and Physiology, University of Minnesota Medical School, Minneapolis, Minnesota, USA.
4Duke Molecular Physiology Institute and Sarah W. Stedman Nutrition and Metabolism Center, Duke University Medical Center, Durham, North Carolina, USA.
5Department of Surgery, Lurie Children’s Hospital, Chicago, Illinois, USA.
6Department of Surgery, Northwestern University Feinberg School of Medicine, Chicago, Illinois, USA.
7Department of Radiology, University of Minnesota Medical School, Minneapolis, Minnesota, USA.
8Department of Surgery, University of Minnesota, Minneapolis, Minnesota, USA.
9Division of Endocrinology, Metabolism, and Nutrition, Department of Medicine, and
10Department of Pharmacology and Cancer Biology, Duke University Medical Center, Durham, North Carolina, USA.
Address correspondence to: Patrycja Puchalska or Peter A. Crawford, Division of Molecular Medicine, Department of Medicine, University of Minnesota Medical School, 425 E. River Parkway, Dwan Building, Minneapolis, Minnesota 55455-0368, USA. Phone: 612.301.2202; Email: ppuchals@umn.edu (PP); Email: crawforp@umn.edu (PAC).
Find articles by Hughey, C. in: PubMed | Google Scholar
1Division of Molecular Medicine, Department of Medicine,
2Department of Biochemistry, Molecular Biology and Biophysics, and
3Department of Integrative Biology and Physiology, University of Minnesota Medical School, Minneapolis, Minnesota, USA.
4Duke Molecular Physiology Institute and Sarah W. Stedman Nutrition and Metabolism Center, Duke University Medical Center, Durham, North Carolina, USA.
5Department of Surgery, Lurie Children’s Hospital, Chicago, Illinois, USA.
6Department of Surgery, Northwestern University Feinberg School of Medicine, Chicago, Illinois, USA.
7Department of Radiology, University of Minnesota Medical School, Minneapolis, Minnesota, USA.
8Department of Surgery, University of Minnesota, Minneapolis, Minnesota, USA.
9Division of Endocrinology, Metabolism, and Nutrition, Department of Medicine, and
10Department of Pharmacology and Cancer Biology, Duke University Medical Center, Durham, North Carolina, USA.
Address correspondence to: Patrycja Puchalska or Peter A. Crawford, Division of Molecular Medicine, Department of Medicine, University of Minnesota Medical School, 425 E. River Parkway, Dwan Building, Minneapolis, Minnesota 55455-0368, USA. Phone: 612.301.2202; Email: ppuchals@umn.edu (PP); Email: crawforp@umn.edu (PAC).
Find articles by
Puchalska, P.
in:
PubMed
|
Google Scholar
|
1Division of Molecular Medicine, Department of Medicine,
2Department of Biochemistry, Molecular Biology and Biophysics, and
3Department of Integrative Biology and Physiology, University of Minnesota Medical School, Minneapolis, Minnesota, USA.
4Duke Molecular Physiology Institute and Sarah W. Stedman Nutrition and Metabolism Center, Duke University Medical Center, Durham, North Carolina, USA.
5Department of Surgery, Lurie Children’s Hospital, Chicago, Illinois, USA.
6Department of Surgery, Northwestern University Feinberg School of Medicine, Chicago, Illinois, USA.
7Department of Radiology, University of Minnesota Medical School, Minneapolis, Minnesota, USA.
8Department of Surgery, University of Minnesota, Minneapolis, Minnesota, USA.
9Division of Endocrinology, Metabolism, and Nutrition, Department of Medicine, and
10Department of Pharmacology and Cancer Biology, Duke University Medical Center, Durham, North Carolina, USA.
Address correspondence to: Patrycja Puchalska or Peter A. Crawford, Division of Molecular Medicine, Department of Medicine, University of Minnesota Medical School, 425 E. River Parkway, Dwan Building, Minneapolis, Minnesota 55455-0368, USA. Phone: 612.301.2202; Email: ppuchals@umn.edu (PP); Email: crawforp@umn.edu (PAC).
Find articles by
Crawford, P.
in:
PubMed
|
Google Scholar
|
Published April 24, 2025 - More info
J Clin Invest. 2025;135(12):e191021. https://doi.org/10.1172/JCI191021.
© 2025 Queathem et al. This work is licensed under the Creative Commons Attribution 4.0 International License. To view a copy of this license, visit http://creativecommons.org/licenses/by/4.0/.
Received: January 7, 2025; Accepted: April 17, 2025
-
Results
Hepatic ketogenesis correlates with NAS in humans. During the progression of MASLD, reports of hepatic oxidative fluxes have been varied, with studies reporting accelerations (22–25), no changes (26–29), or impairments (30–34) in oxidative metabolism. However, oxidative fluxes have never been quantified in vivo in humans with histologically confirmed MASH (Figure 1A). To study hepatic metabolism in humans with MASH, participants were recruited from 2 clinical trials, NCT03997422 and NCT03587831 (Supplemental Table 1; supplemental material available online with this article; https://doi.org/10.1172/JCI191021DS1). Recruited participants remained weight stable during metabolic assessments. Participants with BMI ≥ 35 were screened with magnetic resonance imaging to identify patients with a liver proton density fat fraction (PDFF) greater than 5%, indicative of hepatic steatosis, and a total of 16 participants (15 female and 1 male) were recruited to the study outlined in Figure 1B. After liver biopsy, glucose homeostasis and body composition were quantified using a frequently sampled intravenous glucose tolerance test (FSIVGTT) and dual-energy x-ray absorptiometry (DXA), respectively. The cohort’s characteristics are summarized in Table 1. During a 20-hour fast, oral 2H2O and [U-13C3]propionate tracers were delivered to enrich plasma glucose across hydrogen and carbon atoms, whose positional isotopomeric labeling distribution supports modeling of relative reaction velocities (V) (i.e., flux) through hepatic intermediary metabolic pathways. Simultaneously, the absolute rates of endogenous glucose production (EGP) (VEGP) and ketogenesis (VRaβOHB) were measured at metabolic and isotopic steady state after a 2-hour infusion of [3,4-13C2]glucose and d-[U-13C4]βOHB, respectively, thereby allowing the absolute rates of hepatic intermediary metabolic pathways to be quantified (Supplemental Figure 1) (35, 51–53). During the screening phase, and prior to flux assessments, a liver biopsy was collected and used to histologically grade liver health, which was collectively summarized by the NAS. NAS scores ranged from 1 to 8, all patients exhibited histological signs of steatosis, and 14 of 16 participants displayed signs of hepatocyte cell injury (i.e., ballooning) and/or lobular inflammation (Figure 1C). Ten of the 16 participants exhibited histopathological fibrosis. As expected, NAS strongly correlated with PDFF (r = 0.68, P < 0.01) and liver fibrosis (r = 0.79, P < 0.001) (Figure 1D), but did not correlate with BMI (Supplemental Figure 2A). NAS correlated with the acute insulin response to glucose (AIRg) (r = 0.68, P = 0.005), suggestive of a correlation between insulin resistance and NAS (Supplemental Figure 2B); however, NAS did not correlate with the homeostatic model assessment for insulin resistance (Supplemental Figure 2C).
 Figure 1
Metabolic characteristics of MASLD-MASH. (A) The initial stages of metabolic dysfunction–associated steatotic liver disease (MASLD) begin with hepatic steatosis, linked to accelerations in: de novo lipogenesis (DNL), turnover of the tricarboxylic acid (TCA) cycle, and phosphoenolpyruvate-derived (PEP-derived) gluconeogenesis (GNG). Metabolic shifts during the progression of MASLD to metabolic dysfunction–associated steatohepatitis (MASH) remain poorly understood. HCC, hepatocellular carcinoma. (B) Study design. Patients with BMI ≥ 35 and liver proton density fat fraction (PDFF) greater than 5% underwent a liver biopsy, FSIVGTT, and DXA imaging. After an overnight fast, 8 hepatic intermediary metabolic fluxes were quantified using 2H/13C stable isotope tracing. (C) Distributions of the NAFLD activity scores (NASs) in all 16 participants (15 female, 1 male). (D) Correlation matrix of NAS with histological scores for steatosis, ballooning, inflammation, fibrosis, PDFF, liver enzymes, and bilirubin. Pearson’s correlation coefficients (r) are shown in heatmap format with the magnitude of the correlation given by the right-hand legend and displayed in each square. Correlations were accepted as significant if P < 0.05. *P < 0.05, **P < 0.01, ***P < 0.001. ALP, alkaline phosphatase; AST, aspartate aminotransferase; ALT, alanine transaminase.
We then examined the metabolic flux modeling data acquired in this cohort (Figure 2, A and B). Across participants, 29% ± 8% of VEGP arose from glycogenolysis (Vglycogen), 18% ± 7% from glycerol (Vglycerol), and 52% ± 7% from PEP (VPEP) (Figure 2C). Next, by quantification of rates of (a) TCA cycle flux, VCS (where CS stands for citrate synthase); (b) total ketone body (TKB) production, VRaTKB; and (c) GNG sourcing pathways, Vglycerol and VPEP, both hepatic fat oxidation and RE production were calculated. The majority of REs produced in the fasted liver originated from β-oxidation, accounting for 52 ± 15 μmol REs/min/kg lean body mass (LBM), while REs derived from the TCA cycle accounted for 33 ± 11 μmol REs/min/kg LBM, and GNG accounted for 4 ± 3 μmol REs/min/kg LBM (Figure 2D). To determine relationships among fluxes, we performed regression analyses and obtained Pearson’s correlation coefficients (Supplemental Figure 3A). As expected, VEGP correlated with Vglycogen, VPEP, and total anaplerosis, VPEPCK (where PEPCK stands for PEP carboxykinase). Moreover, expected correlations were observed between VPEPCK and pyruvate cycling, VPK+ME (where PK stands for pyruvate kinase and ME stands for malic enzyme) (r = 0.99, P < 0.0001); between VCS and VPK+ME (r = 0.60, P = 0.014); and between VCS and VPEPCK (r = 0.65, P = 0.006) (Supplemental Figure 3B). Additional correlations were observed between VEGP and VPK+ME (r = 0.63, P = 0.009), VEGP and VPEPCK (r = 0.70, P = 0.003), and VEGP and VCS (r = 0.57, P = 0.020) (Supplemental Figure 3C), as well as VPEP and VPK+ME (r = 0.68, P = 0.004), VPEP and VPEPCK (r = 0.79, P < 0.001), and VPEP and VCS (r = 0.68, P = 0.004) (Supplemental Figure 3D). Inverse correlations were observed between the percentage of VEGP attributable to glycerol (Vglycerol) and VPK+ME, VPEPCK, and VCS (Supplemental Figure 3E). No correlations were observed between the ketogenic flux VRaβOHB and any individual flux (Supplemental Figure 3A). As expected, total hepatic ketogenesis (VRaTKB) correlated with total hepatic fat oxidation (r = 0.96, P < 0.001), suggesting a driver role of ketogenesis in determining overall rates of hepatic fat oxidation (Supplemental Figure 3F). Interestingly, total fat oxidation was not correlated with VCS (r = 0.22, P = 0.413) (Supplemental Figure 3G). Taken together, these data reflect internal consistency in the modeling data, demonstrating expected relationships between TCA cycle flux, GNG, ketogenesis, and total fat oxidation.
 or TCA cycle turnover.") Figure 2
Figure 2Liver injury does not correlate with endogenous glucose production (EGP) or TCA cycle turnover. Fluxes through hepatic intermediary metabolic pathways were quantified in humans after oral administration of heavy water (2H2O) and [U-13C3]propionate. [3,4-13C2]Glucose and d-[U-13C4]βOHB were intravenously infused, allowing whole-body glucose (VEGP) and βOHB turnover (VRaβOHB) to be quantified at metabolic and isotopic steady state. (A) Fractional sourcing of glucose can be quantified from the 2H enrichment pattern of plasma glucose using 2H NMR, which, by multiplying by VEGP, allows absolute reaction velocities (V) (i.e., flux) for hepatic glucose sourcing pathways to be quantified. (B) Administration of [U-13C3]propionate 13C-enriches TCA cycle intermediates, which sources phosphoenolpyruvate (PEP). Using 13C NMR, and the multiplet arising from the C2 resonance of plasma glucose, the resulting metabolic network models oxidative and anaplerotic nodes of the TCA cycle in parallel to glucose production. By normalizing of fluxes to VPEP, the absolute reaction velocities of the TCA cycle, anaplerosis/cataplerosis, and pyruvate cycling can be quantified. (C) Average percentage of VEGP derived from glycogen, glycerol, and PEP, highlighting that TCA cycle–sourced PEP is the major contributor to VEGP in the fasted state in humans. (D) Average reducing equivalents (REs) derived from GNG, β-oxidation, and the TCA cycle. (E and F) The correlations of NAS with VEGP (E) and TCA cycle turnover (VCS) (F). Data are either expressed as mean ± SD or shown as correlations. Pearson’s correlation coefficients (r) are shown on each group along with a line of best fit and 95% confidence intervals calculated using linear regression. Correlations were accepted as significant if P < 0.05. P values are shown on each graph.
Given the validity of the flux modeling data, we next sought to determine the relationships among these measured fluxes and MASLD-MASH progression. Surprisingly, despite the known relationship among insulin resistance, VEGP, and NAS, a correlation between VEGP and NAS was not detected (r = 0.13, P = 0.639) (Figure 2E). Moreover, VCS, Vglycogen, Vglycerol, VPEP, VPK+ME, and VPEPCK all showed no correlation with NAS (Figure 2F and Supplemental Figure 4, A and B). However, surrogates for ketogenesis correlated directly with NAS (VRaβOHB [r = 0.61, P = 0.013], Figure 3A; VRaAcAc [r = 0.58, P = 0.018], VRaTKB [r = 0.61, P = 0.013], and serum total [12C]ketone bodies [r = 0.53, P = 0.037], Supplemental Figure 4C). Consistent with the correlation between ketogenesis and total fat oxidation (Supplemental Figure 3F), both total fat oxidation (r = 0.63, P = 0.009) and total RE production (r = 0.52, P = 0.038) also correlated directly with NAS (Figure 3, B and C). The mitochondrial redox ratio of βOHB to AcAc did not correlate with NAS (Supplemental Figure 4D). VRaβOHB did not correlate with liver PDFF (r = 0.38, P = 0.143), but trended toward a positive correlation with AIRg (r = 0.46, P = 0.081) (Supplemental Figure 5, A and B). VRaβOHB also positively correlated with circulating transaminase levels (aspartate aminotransferase, r = 0.51, P = 0.041; alanine transaminase, r = 0.52, P = 0.037) (Supplemental Figure 5C). Despite the observed correlations with ketogenesis, similar correlations were not observed for circulating non-esterified fatty acids (NEFAs), a primary substrate for ketogenesis. Circulating NEFAs did not correlate with ketogenesis (VRaβOHB) or with total plasma ketone bodies (Figure 3, D and E), suggesting that variations in ketogenesis were not driven by variations in the availability of NEFAs in these participants under these conditions. Circulating NEFAs also did not correlate with NAS (r = 0.15, P = 0.572) (Figure 3F). Moreover, NEFAs also did not correlate with whole-body fat mass or percentage android fat, but did correlate with percentage gynoid fat (r = 0.50, P = 0.050) and inversely correlated with the android/gynoid ratio (r = –0.55, P = 0.028) (Supplemental Figure 5D).
 Figure 3
Liver injury correlates with endogenous ketogenesis and hepatic fat oxidation. (A–C) The correlation of NAS with endogenous ketogenesis (VRaβOHB) (A), total fat oxidation (B), and total RE turnover (C). (D–F) Correlation of serum non-esterified fatty acid (NEFA) concentrations with endogenous ketogenesis (VRaβOHB) (D), total plasma ketone bodies (AcAc + βOHB) (E), and NAS (F). Pearson’s correlation coefficients (r) are given on each graph along with a line of best fit calculated using linear regression. Correlations were accepted as significant if P < 0.05. P values are shown on each graph.
Though not included in NAS, fibrosis is also a strong indicator of MASLD progression. Total fat oxidation trended toward a correlation with fibrosis (r = 0.49, P = 0.056), and RE production was significantly correlated with fibrosis (r = 0.50, P = 0.047) (Supplemental Figure 6, A and B). Fibrosis was inversely correlated with the rate of anaplerosis relative to the TCA cycle (VPEPCK/VCS) (r = –0.63, P = 0.009), and positively correlated with the rate of the TCA cycle relative to EGP (VCS/VEGP) (r = 0.52, P = 0.038) (Supplemental Figure 6, C and D). These ratios provide insight into the distribution of REs harvested from fat oxidation, and suggest that with MASLD progression, the sourcing of REs to glucose production may wane. While these fluxes are modeled in participants at a single time point, and thus do not demonstrate longitudinal relationships, these data demonstrate that ketogenesis and total fat oxidation increase in proportion to liver injury, while TCA cycle flux remains relatively stable. These results suggest that ketogenesis and fat oxidation could accelerate during the natural history of MASLD progression to MASH. Given (a) this relationship between ketogenesis and MASLD and (b) the fact that ketogenesis is a strong predictor of total fat oxidation in the liver, we sought to determine the mechanistic connections among these indices using mouse models.
Loss of HMGCS2 predisposes the liver to steatosis and dysregulated hepatic energy metabolism. Our previous findings in ex vivo–perfused livers suggested that GNG was impaired in the setting of ketogenic insufficiency (46, 52). Because hepatic GNG is bioenergetically coupled to fat oxidation, this suggested that fat oxidation might be impaired in the absence of ketogenesis. Nonetheless, ketogenesis-insufficient mice maintained euglycemia when fasted, because of compensation from hepatic glycogenolysis and/or extrahepatic GNG (46, 52, 54). To test whether fat oxidation was impaired by ketogenic insufficiency in vivo, we fed littermate control wild-type (WT) and hepatocyte-specific HMGCS2-null (HMGCS2-Liver-KO) mice a high-fat, carbohydrate-restricted (HFCR) diet, and hypothesized that in the absence of dietary carbohydrates, hepatic GNG would fail to support glycemia (Figure 4A). We confirmed loss of HMGCS2 function (48, 55) by demonstrating that chow-fed HMGCS2-Liver-KO mice failed to mount a ketogenic response to fasting but maintained a normal ratio of βOHB to AcAc (Figure 4, B–D) (56). When littermate control WT mice were placed on HFCR diet for 1 week, 4-hour-fasted total ketone bodies were elevated 3.3 ± 0.2–fold, as expected (Student’s t test, P < 0.001); however, only βOHB was increased, and not circulating AcAc (Supplemental Figure 7A). As a result, the ratio of βOHB to AcAc was increased 10.7 ± 0.2–fold (Supplemental Figure 7B). Unexpectedly, while circulating total ketones in HFCR diet–fed HMGCS2-Liver-KO mice (662 ± 152 μM) trended lower than those in controls (1,071 ± 349 μM) (Student’s t test, P = 0.08), they were markedly elevated compared with those in chow-fed HMGCS2-Liver-KO mice (66 ± 5 μM) (Figure 4, C and E). Compared with littermate controls maintained on HFCR diet, HMGCS2-Liver-KO mice had a markedly decreased ratio of βOHB to AcAc, but a 3.8 ± 0.1–fold increased total amount of circulating l-βOHB, which does not contribute to mitochondrial NADH/NAD+ ratio (Figure 4F and Supplemental Figure 7, C and D). To address whether the ketonemia in HFCR diet–fed HMGCS2-Liver-KO mice was attributable to ketogenesis or to impairments in peripheral ketone body disposal, we quantified static abundance of ketone bodies in liver tissue and found that HFCR diet–fed HMGCS2-Liver-KO livers showed a 69% ± 14% diminution in total ketones (Student’s t test, P < 0.01), and increased liver l-βOHB, which together support impairment of ketogenesis in livers of HFCR diet–fed HMGCS2-Liver-KO mice (Supplemental Figure 7, E and F).
 Figure 4
Loss of hepatocyte HMGCS2 impairs fasting ketosis. (A) Ketogenesis-null mice were generated by deletion of the gene encoding 3-hydroxymethylglutaryl-CoA synthase 2 (HMGCS2) in hepatocytes. Littermate control (WT) and HMGCS2 hepatocyte-specific knockout (HMGCS2-Liver-KO) male and female mice were maintained on standard chow diet, switched to a high-fat carbohydrate-restricted (HFCR) diet for 1 week, and studied in the random-fed or fasted state. (B and C) Functional loss of HMGCS2 was confirmed in vivo in chow-fed mice by demonstration that HMGCS2-Liver-KO mice failed to increase fasting total ketone bodies (TKBs) (B), marked by a decrease in both AcAc and βOHB (4-hour-fasted) (n = 4–8 per group) (C). (D) Ratio of βOHB to AcAc in 4-hour-fasted WT and HMGCS2-Liver-KO mice fed chow diet (n = 4–8 per group). (E) Serum TKB analysis of WT and HMGCS2-Liver-KO mice fed HFCR diet (n = 4–6 per group). (F) The ratio of βOHB to AcAc in WT and HMGCS2-Liver-KO mice fed HFCR diet (n = 4–6 per group). Data are expressed as mean ± SD. Statistical differences were determined by Student’s t tests and accepted as significant if P < 0.05. *P < 0.05, **P < 0.01, ***P < 0.001.
To determine the physiological response to HFCR diet in HMGCS2-Liver-KO mice, we quantified gravimetric indices and metabolite concentrations 1 week after transitioning from chow. HMGCS2-Liver-KO mice lost more weight than littermate controls when fed the HFCR diet but developed severe hepatomegaly (Figure 5, A–C). This was accompanied by a 3.5 ± 0.1–fold accumulation of liver TAGs (Figure 5, D and E), which could be reversed by refeeding mice chow diet for 1 week (Figure 5F). In both the random-fed and the 4-hour-fasted state, HMGCS2-Liver-KO HFCR diet–fed mice had elevated plasma NEFAs, no difference in circulating TAGs, decreased blood glucose, and depleted hepatic glycogen (Figure 6, A–H).
 Figure 5
Ketogenic insufficiency induces hepatomegaly and steatosis. Littermate control (WT) and HMGCS2-Liver-KO male and female mice maintained on standard chow diet were switched to HFCR diet for 1 week. (A) Net change in body weight after switching of diets (n = 7 per group). (B and C) Total liver weight (grams) (B) and relative liver weight (percentage of body weight) (C) (n = 3–8 per group). (D and E) Total liver triacylglycerols (TAGs) in random-fed livers quantified colorimetrically (D) and shown histologically with H&E stain (E). Scale bars: 25 μm. (F) Total liver TAGs in HFCR diet–fed mice after 1 week of refeeding of standard chow (n = 4 per group). Data are expressed as mean ± SD. Statistical differences were determined by Student’s t tests and accepted as significant if P < 0.05. **P < 0.01, ****P < 0.0001.
 Figure 6
Ketogenic insufficiency induces relative hypoglycemia in HFCR diet–fed mice. Systemic physiological markers of whole-body metabolism in random-fed (A–D) and 4-hour-fasted (E–H) male and female littermate control (WT) and HMGCS2-Liver-KO mice, including blood non-esterified fatty acids (NEFAs), TAGs, and glucose. Also included is total liver glycogen content (n = 4–11 per group). Data are expressed as mean ± SD. Statistical differences were determined by Student’s t tests and accepted as significant if P < 0.05. *P < 0.05, **P < 0.01.
To test the hypothesis that impaired hepatic fat oxidation could be linked to diminished glycemia in HFCR diet–fed HMGCS2-Liver-KO mice, we quantified hepatic glucose and associated oxidative fluxes in vivo in conscious, unrestrained mice, using a previously established approach based on gas chromatography–mass spectrometry (GC-MS) (57–59). To accomplish this, vascular catheters were placed in the carotid artery and jugular vein of mice fed chow diet. Five days after surgery, mice were switched to HFCR diet for 2 days. Seven days after surgery, 2H2O, [U-13C3]propionate, and [6,6-2H2]glucose stable isotope tracers were infused, allowing quantification of in vivo fluxes via 2H/13C metabolic flux analysis (Figure 7A) (51, 58, 59). When fasted, HFCR diet–fed HMGCS2-Liver-KO mice had lower rates of whole-body glucose production (VEGP) (59.6 ± 8.2 μmol/min/kg body weight [BW]) compared with littermate controls (90.1 ± 12 μmol/min/kg BW; Student’s t test, P = 0.003) (Figure 7B). Body weight was not different between groups (data not shown). Both littermate control WT and HMGCS2-Liver-KO mice showed very low rates of glycogenolysis (VPYGL, where PYGL stands for glycogen phosphorylase); however, as expected, HFCR diet–fed HMGCS2-Liver-KO mice showed a 31% ± 8% (Student’s t test, P < 0.01) diminution in total GNG (VAldo, where Aldo stands for aldolase) which was linked to diminished sourcing of glucose from both glycerol (VGK) and PEP (VEnol) (Figure 7C). GNG fluxes are tightly coupled to the entry (anaplerosis) and exit (cataplerosis) of nutrients through the TCA cycle; thus we next examined glucose-linked hepatic oxidative fluxes. While anaplerosis from propionyl-CoA carboxylase (VPCC) was decreased in HMGCS2-Liver-KO mice, most anaplerotic fluxes were not different between genotypes (VPC, VLDH, and VPK+ME, where PC stands for pyruvate carboxylase and LDH stands for lactate dehydrogenase). Cataplerosis (VPCK, where PCK stands for PEP carboxykinase) was also similar between HMGCS2-Liver-KO and littermate controls (Student’s t test, P > 0.05) (Figure 7D). However, HMGCS2-Liver-KO mice showed increased TCA cycle fluxes as evidenced by higher VCS (+72% ± 6%, Student’s t test, P < 0.001) and VSDH (where SDH stands for succinate dehydrogenase; +42% ± 6%, Student’s t test, P < 0.01) (Figure 7D). Thus, the VPCK/VCS ratio was decreased 50% ± 10% (Student’s t test, P < 0.001) in HMGCS2-Liver-KO mice, and the VCS/VEGP ratio was increased 158% ± 8% (Student’s t test, P < 0.001) (Supplemental Figure 8A). Moreover, while VPC was unchanged, static concentrations of acetyl-CoA were increased 77% ± 17% (Student’s t test, P < 0.01) in livers of HFCR diet–fed HMGCS2-Liver-KO mice, indicating an absence of allosteric activation of PC by acetyl-CoA (Supplemental Figure 8B). Moreover, succinyl-CoA and propionyl-CoA were decreased, also suggestive of diminished relative anaplerosis (Supplemental Figure 8B). The total pools of energy adenylates (ATP, ADP, and AMP) were diminished 39% ± 14% in livers of HFCR diet–fed HMGCS2-Liver-KO mice, with no impairment in energy charge (Supplemental Figure 8, C–E). Static liver concentrations of redox metabolites NAD+ and NADH were also both diminished 45% ± 13% and 38% ± 14%, respectively, but no difference in liver NAD+/NADH ratio was observed in HFCR diet–fed HMGCS2-Liver-KO mice (Supplemental Figure 8, F–H). Together, these findings underscore interconnections among ketogenesis, fat oxidation, anaplerosis/cataplerosis, and EGP. Relative responses of modeled fluxes in HFCR diet–fed HMGCS2-Liver-KO mice quantified in vivo via intravenous infusions were consistent with our prior observations using ex vivo portal vein liver perfusions in chow-fed HMGCS2 knockdown mice, which revealed (a) increased mitochondrial acetyl-CoA, (b) elevated VCS, and (c) diminished VPEPCK/VCS ratio (46, 52). We next sought to quantify the contribution of ketogenesis to hepatic fat oxidation, and how this influences the course of MASLD-MASH.
 Figure 7
Ketogenic insufficiency diminishes gluconeogenesis in mice. (A) Overview of in vivo hepatic flux modeling study design. Top: Fluxes were measured in female littermate control (WT) and HMGCS2-Liver-KO mice. Five days after surgical implantation of indwelling catheters, mice were switched from standard chow to an HFCR diet, and then fluxes were measured after a 2-day acclimation period. Middle: Stable isotope tracers were administered, including [6,6-2H2]glucose, [U-13C3]propionate, and heavy water (2H2O). Red blood cells from donor mice were infused to maintain hematocrit. Samples were collected for analysis during the final 30 minutes after metabolic and isotopic steady state had been reached. Bottom: Diagram of reaction velocities (V) (i.e., fluxes) modeled using a mass isotopomer distribution analysis of derivatized plasma glucose acquired via GC-MS. (B) Rates of whole-body endogenous glucose production (VEGP) as measured via tracer dilution of [6,6-2H2]glucose (n = 4–6 per group). (C) Absolute rates of glucose sourcing pathways, including glycogenolysis (VPYGL), total gluconeogenesis (VAldo), and rates of glycerol (VGK) and phosphoenolpyruvate (PEP) (VEnol) flux to glucose (n = 4–6 per group). (D) Absolute rates for reactions in the oxidative flux network shown in A, including lactate dehydrogenase (LDH; VLDH), PEP carboxykinase (PCK; VPCK, i.e., total TCA cycle cataplerosis), anaplerosis into the TCA cycle via pyruvate carboxylase (PC; VPC) or via propionyl-CoA carboxylase (PCC; VPCC), pyruvate cycling as the sum of pyruvate kinase (PK) and malic enzyme (ME) (VPK+ME), citrate synthase (CS) flux (VCS; i.e., TCA cycle turnover), and succinate dehydrogenase (SDH) flux (VSDH) (n = 4–6 per group). Data are expressed as mean ± SD. Statistical differences were determined by Student’s t tests and accepted as significant if P < 0.05. *P < 0.05, **P < 0.01, ***P < 0.001.
Ketogenic insufficiency impairs total hepatic fat oxidation. To determine whether ketogenic insufficiency impaired hepatic fat oxidation (Figure 8A), including those components accounted for by ketogenesis and VCS, we returned to ketogenesis-insufficient ex vivo–perfused livers in carbohydrate-replete settings. Our group previously characterized the HMGCS2 antisense oligonucleotide (ASO) knockdown liver and showed (a) abrogation of liver HMGCS2 protein, but its preservation in non-hepatic tissues; (b) abrogation of fasting-induced ketogenesis; (c) elevation of VCS and VCS/VGNG ratio; and (d) increased predisposition to steatotic liver injury (46, 47, 52, 56). Compared with control mice receiving scrambled ASO, the livers of chow-fed ketogenesis-insufficient mice exhibited an 80% ± 24% diminution in total fat oxidation (Student’s t test, P < 0.001), a 76% ± 24% impairment in REs generated from β-oxidation, and a strong trend toward a decrease in total RE production rate (39% ± 23% Student’s t test, P = 0.056), despite a trend toward a 70% ± 23% increase in TCA cycle–sourced REs (Student’s t test, P = 0.1108) (Figure 8, B and C). There were no differences in REs generated through GNG. Concordantly, in livers of HMGCS2-knockdown mice fed a sucrose-enriched Western diet (WD) with 42% kcal from fat for 8 weeks, we observed that VCS was increased 155% ± 30% (Student’s t test, P = 0.03), and thus REs produced by the TCA cycle strongly trended toward a greater-than-2-fold increase (Student’s t test, P = 0.05), suggesting that loss of ketogenesis stimulates terminal fat oxidation in the TCA cycle in WD-fed mice (Figure 8, D–F). Nonetheless, the data support the hypothesis that the rate of total fat oxidation is impaired by ketogenic insufficiency.
 Figure 8
Ketogenic insufficiency impairs fat oxidation in perfused livers. (A) Prior studies have demonstrated that ketogenesis insufficiency induced by loss of HMGCS2 causes accumulation of mitochondrial acetyl-CoA and acceleration of the TCA cycle. Livers of male mice treated with scrambled control antisense oligonucleotide (ASO) or mouse Hmgcs2 ASO were perfused with octanoate (C8) and oxidative fluxes quantified using 2H/13C stable isotope tracing. (B and C) Total fat oxidation quantified as the summation of (2 × ketogenesis) + TCA cycle turnover (B), and reducing equivalent (RE) turnover (NADH + FADH2) broken down into REs from gluconeogenesis (GNG), β-oxidation, and the TCA cycle (C), in perfused livers from control and Hmgcs2 ASO mice on chow diet (n = 10–11 per group). Fat oxidation was also studied in livers perfused ex vivo with C8 from control and Hmgcs2 ASO–treated mice maintained on a 42% high-fat high-sucrose Western diet (WD) for 8 weeks. (D–F) TCA cycle turnover (D), total fat oxidation (E), and RE production rate (NADH + FADH2) (F) in perfused livers from control and Hmgcs2 ASO–treated mice on WD (n = 5–6 per group). Data are expressed as mean ± SD. Statistical differences were determined by Student’s t tests or 2-way ANOVA and accepted as significant if P < 0.05. *P < 0.05, **P < 0.01, ***P < 0.001.
To address underlying mechanisms for impaired fat oxidation, we isolated mitochondria from control C57BL/6NJ mouse livers and performed mitochondrial stress testing using our standard creatine kinase (CK) clamp protocol, allowing quantification of respiratory flux (JO2) across variations in energy demand (ΔGATP) (Figure 9A) (60). Treatment of mitochondria with hymeglusin (HG), a small-molecule inhibitor of both HMGCS isoforms (HMGCS1 is a cytoplasmic enzyme and is thus not included in our mitochondrial preparations), showed the expected diminution in HMG-CoA as well as AcAc and βOHB within mitochondria, coinciding with abrogated βOHB production rates in mitochondria stimulated with palmitoyl-l-carnitine plus α-ketoglutarate (Figure 9, B and C) (61, 62). With increasing energy demand, JO2 rates increased with a diminished slope in HG-treated mitochondria, indicating an overall respiratory impairment due to ketogenic insufficiency (Figure 9D). This coincided with an accumulation of C2–C8 acyl-CoA species, and a depletion in free CoA (Figure 9, E and F). Finally, mitochondrial redox was more reduced in HG-treated mitochondria [NAD(P)H, % reduced, Figure 9G). While this result may appear to contradict the normal redox ratio observed in livers of HFCR diet–fed HMGCS2-Liver-KO mice (Supplemental Figure 8H), static concentrations of total redox nucleotides may not reflect variations in cycling enzymatically bound pools (53, 63). Taken together, these findings show that ketogenic insufficiency impairs total hepatic fat oxidation in vivo, ex vivo, and in isolated mitochondria. One potential contributor to this impairment is free CoA trapping, which impedes procession through β-oxidation and the TCA cycle; this is supported by our prior findings (46). A second contributor to diminished fat oxidation rates is reduced mitochondrial matrix redox potential in the setting of ketogenic insufficiency, captured in this flux-based assay that quantifies redox nucleotide turnover among actively cycling enzymatic pools.
 Figure 9
Ketogenic insufficiency impairs fat oxidation in isolated mitochondria. (A) Mitochondrial diagnostics workflow. Liver mitochondria isolated by differential centrifugation and fueled by palmitoyl-l-carnitine plus α-ketoglutarate were used to assess the effects of hymeglusin (HG; HMGCS inhibitor) versus vehicle control (VCTRL) on βOHB production, respiratory kinetics, and redox potential during a creatine kinase (CK) energetic clamp, and on metabolite abundance after CK clamp. (B and C) Relative abundance of HMG-CoA, AcAc, and βOHB in mitochondria (B) and βOHB production measured in supernatant collected after CK clamp (C) (n = 4 per group). (D) Respiration (JO2) plotted as a function of energy demand (ΔGATP [kcal/mol]), with respiratory sensitivity (i.e., JO2 conductance) measured as the slope of the curve (n = 4 per group). Results of Student’s t test of slopes between VCTRL and HG are shown on the graph. (E and F) Relative abundance of acyl-CoA species (E) and free coenzyme A (F) in mitochondria (n = 4 per group). (G) Redox potential [NAD(P)H percentage reduction] plotted as a function of energy demand (ΔGATP [kcal/mol], n = 4 per group). Pool sizes are from mitochondria after incubation at a fixed energy demand (ΔGATP = –13.94 kcal/mol). Data are expressed as mean ± SD. Statistical differences were determined by Student’s t tests or 2-way ANOVA and accepted as significant if P < 0.05. *P < 0.05, **P < 0.01, ***P < 0.001, ****P < 0.0001, #significant by 2-way ANOVA (P < 0.05).
Loss of mitochondrial βOHB dehydrogenase impairs hepatic fat oxidation but does not provoke liver injury. Ketogenic insufficiency via loss of HMGCS2 function causes steatotic liver injury (45–49). Our findings show that loss of HMGCS2 diminishes rates of liver fat oxidation in a manner correlated with more reduced mitochondrial redox potential. To interrogate the role of the ketogenic reaction directly regulating mitochondrial redox potential, catalyzed by mitochondrial βOHB dehydrogenase (BDH1) (which converts AcAc and NADH to βOHB and NAD+) in (a) total hepatic fat oxidation and (b) the response to steatotic liver injury, we studied mice in which BDH1 had been deleted specifically in hepatocytes (BDH1-Liver-KO mice) (Figure 10A). Our prior studies demonstrated impairments of oxidative metabolism in BDH1-Liver-KO mice on chow diet (53). Here, we fed mice 42% kcal fat WD for 16 weeks. As expected, circulating βOHB and total ketones were diminished after an 18-hour fast (Supplemental Figure 9A). Body weights, liver weights, and blood glucose were unchanged (Supplemental Figure 9, B–D). Livers were then perfused ex vivo with a physiologically relevant mixture of long-chain fatty acids conjugated to bovine serum albumin. While there was no significant diminution in total ketogenesis in livers of BDH1-Liver-KO mice, all ketone bodies emerged as AcAc, with no hepatic βOHB production (Figure 10, B and C). VEGP was diminished 26% ± 13% (Student’s t test, P = 0.0390) in livers of BDH1-Liver-KO mice, which coincided with a 48% ± 12% and 30% ± 13% decrease in sourcing of glucose from both PEP (Student’s t test, P < 0.001) and glycogen (Student’s t test, P = 0.04), respectively (Supplemental Figure 9, E–G). Consistent with our previous findings observed in chow-fed mice, the rates of pyruvate cycling (VPK+ME), anaplerosis and cataplerosis (VPEPCK), and TCA cycle turnover (VCS) were all suppressed 42% ± 16% (Student’s t test, P = 0.0043), 15% ± 13% (Student’s t test, P = 0.0005), and 39% ± 17% (Student’s t test, P = 0.0160), respectively, in livers of BDH1-Liver-KO mice on WD (Figure 10D). Furthermore, total fat oxidation was decreased 26% ± 12% (Student’s t test, P = 0.0170), and RE production rate was decreased 20% ± 10% (Student’s t test, P = 0.0259) (Figure 10, E and F), demonstrating that loss of the NAD+ regenerating step of ketogenesis alone is sufficient to impair overall fat oxidation in the liver.
 Figure 10
Loss of hepatocyte BDH1 impairs total hepatic fat oxidation but does not exacerbate HFD-induced liver fibrosis. (A) Male hepatocyte-specific BDH1-null (BDH1-Liver-KO) and littermate control (WT) mice were maintained on standard chow diet, then were switched to a 42% high-fat high-sucrose WD for 16 weeks, after which oxidative fluxes were studied in livers perfused ex vivo with long-chain fatty acids. (B and C) Ketone body production (B) and AcAc and βOHB production (C) in livers of WT and BDH1-Liver-KO mice (n = 10–11 per group). (D) Absolute rates of oxidative pathways, including pyruvate cycling (VPK+ME), total anaplerosis and cataplerosis (VPEPCK), and TCA cycle turnover (VCS) (n = 10–11 per group). (E and F) Total fat oxidation calculated at (2 × ketogenesis) + acetogenesis + TCA cycle turnover (E), and reducing equivalent (RE) turnover (NADH + FADH2) broken down into REs generated from gluconeogenesis (GNG), β-oxidation, and the TCA cycle (F) (n = 10–11 per group). (G–I) Liver H&E and Picrosirius red histological staining (G), gene expression for fibrotic gene markers (H), and absolute levels of lipid peroxide 4-hydroxyalkenal species (I) in livers of WT and BDH1-Liver-KO mice maintained on 42% kcal fat WD (n = 10–12 per group). Scale bars: 25 μm in H&E images, 100 μm in Picrosirius red images. HHE, 4-hydroxy-2-hexenal; HNDE, 4-hydroxynona-2E, 6Z-dienal; HNE, 4-hydroxy-2-nonenal; HDTE, 4-hydroxy-2E, 6Z, 8Z-decatrienal. Data are expressed as mean ± SD. Statistical differences were determined by Student’s t tests and accepted as significant if P < 0.05. *P < 0.05, **P < 0.01, ***P < 0.001.
To determine whether the diminution in hepatic fatty acid (FA) oxidation in livers of BDH1-Liver-KO mice was linked to increased steatosis or injury in mice fed a 42% kcal fat WD for 16 weeks, we performed histological and molecular analyses. H&E staining showed normal lipid droplet storage, and no evidence of increased fibrosis via Picrosirius red staining in comparison with controls (Figure 10G). Gene expression biomarkers of fibrosis (Col1a1, Col3a1, Col4a1, Acta2) were unchanged and quantities of tissue lipid peroxides were not increased in livers of BDH1-Liver-KO mice (Figure 10, H and I). Maintenance of independent cohorts of BDH1-Liver-KO and littermate control mice on a 60% kcal high-fat diet (HFD) for 16 weeks also showed no evidence of increased steatosis, inflammation, or fibrosis — with a trend toward a diminution in fibrosis in livers of BDH1-Liver-KO mice (56% ± 30%, Student’s t test, P = 0.06) (Supplemental Figure 10, A–C). Moreover, gene expression biomarkers of fibrosis and inflammation were diminished in livers of BDH1-Liver-KO mice fed a 60% HFD (Supplemental Figure 10C). Lastly, we induced liver injury in mice by feeding a fibrogenic choline-deficient, methionine-limited high-fat (62% kcal) diet for 16 weeks, but did not detect worsened steatosis, injury, fibrosis, or inflammation in BDH1-Liver-KO mice (Supplemental Figure 10, D and E). Collectively, these findings demonstrate (a) that ketogenesis is required to maintain hepatic fat oxidation and its coupling to VEGP, with loss of either HMGCS2 or BDH1 impairing hepatic fat oxidation; and (b) that the impairment in fat oxidation does not fully explain why loss of HMGCS2 predisposes the liver to HFD-induced liver injury.


 or TCA cycle turnover.")


-
Methods
See Supplemental Methods for detailed methodology and calculations.
Sex as a biological variable. Males and females were studied, as delineated in the figure legends. However, sex as a biological variable was not addressed.
Human MASLD-MASH study design. Sixteen participants with BMI ≥ 35 and liver PDFF greater than 5% were recruited. Insulin sensitivity and body composition were assessed via frequently sampled intravenous glucose tolerance test (FSIVGTT) and DXA imaging, respectively, followed by in vivo hepatic oxidative flux measurements. Before flux measurements, a liver biopsy was obtained for determination of the NAFLD activity score (NAS).
Stable isotope delivery in humans. Fasted participants were provided with 3 equal doses of 70% deuterated water (2H2O, 5 g/kg body water), along with 0.5% 2H2O available for ad libitum consumption to enrich body water, and 2 doses of oral [U-13C3]propionate (300 mg/dose) to label TCA cycle intermediates for profiling of hepatic mitochondrial fluxes. Intravenous stable isotope infusion began with [3,4-13C2]glucose (0.563 mg/kg BW bolus, immediately followed by a 2-hour infusion [0.00563 mg/min/kg BW]) and d-[U-13C4]βOHB (1 mg/kg BW bolus, immediately followed by 2-hour infusion [0.01 mg/min/kg BW]). At the end of the 2-hour infusion, about 50 mL of blood was drawn and centrifuged to isolate plasma, and then aliquots were frozen at –80°C until further analysis.
2H/13C NMR hepatic flux modeling. The positional 13C and 2H isotopomers of plasma glucose encode quantitative information about hepatic biochemical pathways, thus allowing for noninvasive modeling of hepatic metabolism in vivo. Direct quantification of the positional isotopomer populations of plasma glucose was achieved using 13C and 2H NMR, after derivatization into 1,2-isopropylidene glucofuranose (monoacetone glucose [MAG]) as previously described (25, 36, 51, 52).
Quantification of whole-body βOHB turnover. βOHB turnover was calculated at metabolic and isotopic steady state from the dilution of intravenously infused d-[U-13C4]βOHB using the equation:
(Equation 1)
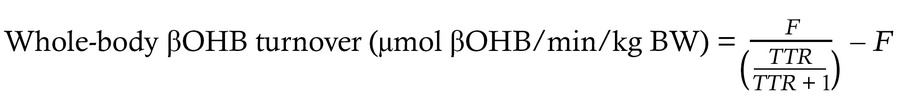
[12C]βOHB and [U-13C4]βOHB were quantified using UHPLC–tandem MS (UHPLC-MS/MS), and then the tracer/tracee ratio ([U-13C4]βOHB/[12C]βOHB) in plasma and the tracer infusion rate (F) were used to calculate whole-body βOHB turnover rates. Because the liver is the primary site of systemic ketone body production, whole-body βOHB turnover at steady state is mathematically equivalent to hepatic endogenous βOHB production rates (VRaβOHB). After flux measurements, turnover rates were corrected for LBM from DXA imaging, and expressed as μmol βOHB turned over/min/kg LBM.
Quantification of whole-body glucose turnover. Glucose turnover was calculated at metabolic and isotopic steady state from the dilution of intravenously infused [3,4-13C2]glucose using the equation:
(Equation 2)

where F is tracer infusion rate, Lp is fractional 13C enrichment of the plasma glucose pool measured via 13C NMR, and Li is the enrichment of infused glucose, assumed to be 99%. In the fasted state the majority (>90%) of whole-body glucose production is derived from the liver; therefore total glucose turnover rates are mathematically equivalent to total hepatic EGP rates (VEGP). Using the DXA scan information, final flux units were expressed as μmol glucose turned over/min/kg LBM.
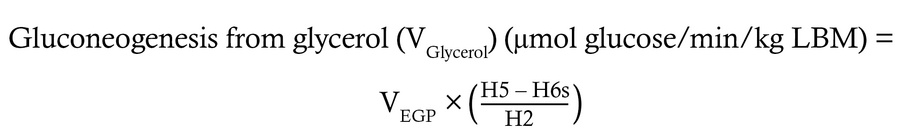
Quantification of hepatic glucose sourcing fluxes. Using the 2H enrichment patterns encoded in plasma glucose, the fractional contribution of various glucose sourcing pathways was determined, then multiplied by total EGP (VEGP) to calculate absolute flux through each hepatic glucose sourcing pathway using the following equations:
(Equation 3)

(Equation 4)
(Equation 5)
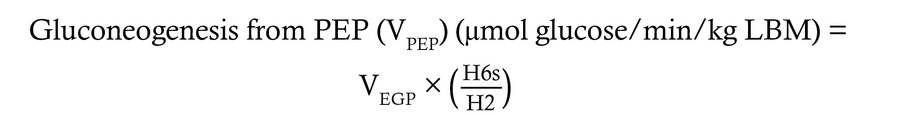
where H2, H5, and H6s correspond to the relative 2H enrichment at the 2, 5, and 6s carbons of MAG.
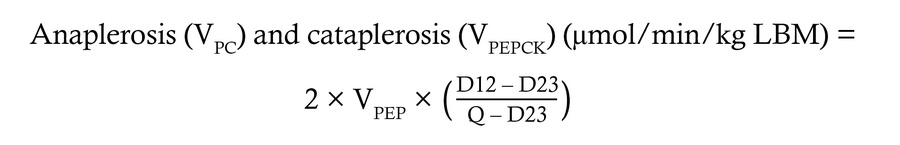
Quantification of hepatic oxidative fluxes. The rate of hepatic TCA cycle turnover, anaplerosis, cataplerosis, and pyruvate cycling can be modeled in the liver using the 13C isotopomers that arise at C2 of plasma glucose from orally administered [U-13C3]propionate using the following equations:
(Equation 6)

(Equation 7)
(Equation 8)

where D12 represents the doublet arising when C1 and C2 of glucose are labeled, D23 represents the doublet arising when C2 and C3 are labeled, and Q is the quartet arising when C1, C2, and C3 are all labeled.
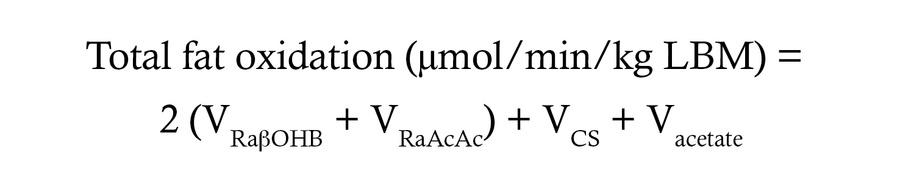
Quantification of hepatic fat oxidation rates. In the fasted liver, β-oxidation–derived acetyl-CoA is (a) principally converted to ketone bodies, which are largely released from the liver; (b) terminally oxidized in the TCA cycle; or (c) secreted as acetate. By assuming that the liver is in a metabolic steady state, the rate of acetyl-CoA production via β-oxidation can be assumed to be equal to the rate of acetyl-CoA disposal, thereby allowing total fat oxidation rates to be indirectly quantified as the sum of all disposal routes for hepatic acetyl-CoA as follows:
(Equation 9)

Fat oxidation is expressed in μmol of acetyl-CoA turned over/min/kg LBM. VRaβOHB was measured via a tracer dilution of intravenously infused d-[U-13C4]βOHB as described above. VRaAcAc was calculated from VRaβOHB turnover rates and the ratio of plasma βOHB to AcAc. VCS was measured as described above. Hepatic acetate production rate (Vacetate) was assumed to be negligible in humans.
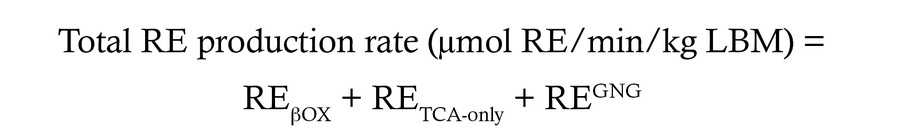
Quantification of hepatic RE production. The production of REs, principally NADH and FADH2, can be estimated from the stoichiometry of the above fluxes as previously described (35, 72) using the equations:
(REAcAc) = 3.5 × VRaAcAc
(REβOHB) = 2.5 × VRaβOHB
(REβox-CS) = 1.75 × VCS
(RETCA-only) = 4 × VCS
(REGNG) = Vglycerol-triose – (0.1 × VPEP-triose)
Total REs generated from β-oxidation were estimated as the sum of REs accounted for by ketogenesis (AcAc [REAcAc] and βOHB [REβOHB]) and TCA cycle turnover (REβox-CS) as follows:
REs generated from β-oxidation (REβOX) = REAcAc + REβOHB + REβox-CS
Total RE turnover was calculated as the sum of REs from β-oxidation (REβOX), TCA cycle dehydrogenases (RETCA-only), and the dehydrogenases of GNG (REGNG) using the equation:
(Equation 10)
Animal models and diets. Hepatocyte-specific HMGCS2-null (HMGCS2-Liver-KO), BDH1-null (BDH1-Liver-KO), and Hmgcs2 ASO–mediated null mice were generated as described previously (46, 48, 53, 55, 73, 74). Food and water were provided ad libitum. Mice were fed either a standard chow diet, a WD with 42% kcal from fat, an HFD with 60% kcal from fat, a choline-deficient methionine-limited HFD with 62% kcal from fat, or an HFCR diet with 90.5% kcal from fat.
Mouse liver health assessment. After euthanasia, mouse liver sections were frozen or fixed in 10% neutral-buffered formalin. Formalin-fixed tissue was used for histological analysis. Frozen liver tissue was assayed for total TAGs, glycogen content, oxidized lipid species, and abundance of mRNA markers.
Serum NEFAs, TAGs, and blood glucose measurements. Serum NEFAs (Wako, 633-52001) and TAGs (Thermo Fisher Scientific, TR22421) were measured spectrophotometrically using commercially available assays. Blood glucose was measured using glucose meters (Metene).
Quantification of glucose, ketone bodies, and acetate. Ketone bodies (AcAc and βOHB) were quantified using UHPLC-MS/MS as described previously (53, 56). Glucose, acetate, and βOHB were quantified during perfusions via 1H NMR.
In vivo 2H/13C metabolic flux analysis in conscious unrestrained mice. To measure hepatic metabolic fluxes in conscious mice, 2H2O, [6,6-2H2]glucose, and [U-13C]propionate were intravenously delivered into fasted mice, and then GC-MS was used to determine the isotopic enrichment of 3 glucose fragments. Using a metabolic reaction network constructed with Isotopomer Network Compartmental Analysis (INCA) software (http://mfa.vueinnovations.com/licensing/mfa-inca), which defines the carbon and hydrogen atom transitions for hepatic glucose and associated oxidative reactions, the relative reaction velocity (V) (i.e., flux) through each network reaction was determined relative to CS flux (VCS). The known [6,6-2H2]glucose infusion rate was then used to calculate absolute reaction velocities.
Quantification of energy charge, redox state, and short-chain acyl-CoAs. Energy nucleotides, redox nucleotides, and high-energy thioester containing acyl-CoAs were measured via LC-MS/MS, and energy charge and redox state were calculated (53).
Flux calculations in perfused livers. Stable isotope–based flux modeling used in vivo in humans and rodents as described above was used to study metabolism of the ex vivo–perfused liver as described previously, with minor modifications (52).
Hepatic fat oxidation and RE production calculations in perfused livers. In perfusions, total fat oxidation was calculated as:
(Equation 11)
and expressed as μmol acetyl-CoA turned over/min/g liver. The same model, assumptions, and equations used to model RE production rate in vivo in humans were used to model RE production rate in ex vivo–perfused livers, with minor modifications.
Mitochondrial respiratory control. Liver mitochondria were isolated and steady-state oxygen consumption rates (JO2) were determined using a modified version of the creatine kinase (CK) energetic clamp as described previously (75). Mitochondrial NAD(P)H to NAD(P)+ ratio, acyl-CoAs and organic acids, and βOHB production were assayed after CK clamp.
Statistics. All analyses were performed using GraphPad Prism version 9. Unpaired 2-tailed Student’s t test or 1-way ANOVA was used to determine statistically significant differences. P less than 0.05 was accepted as significant for all tests. Information about statistical analysis is included in each figure legend. Data are presented as mean ± standard deviation (SD), unless otherwise indicated.
Study approval. The University of Minnesota’s Institutional Review Board approved the human study protocol and methods. All human participants provided written informed consent. All animal experiments were approved by the Institutional Animal Care and Use Committee at the University of Minnesota.
Data availability. All data required for evaluation of conclusions are included in this article. Individual data points are plotted in each graph or included in the Supporting Data Values file.


Copyright © 2026 American Society for Clinical Investigation
ISSN: 0021-9738 (print), 1558-8238 (online)