
Advertisement
Clinical Research and Public HealthImmunologyOncology
Open Access |  10.1172/JCI200442
Divergent macrophage-regulated T cell states determine response to Bacillus Calmette-Guérin vaccine in high-risk bladder cancer
Ryan J. Brown,1,2,3 Mairah T. Khan,4,5 Andrew J. Houston,4,5 Hongshen Niu,1,2 Joseph R. Podojil,1 Bonnie Choy,2 Weiguo Cui,1,2 and Joshua J. Meeks4,5,6
1Department of Microbiology and Immunology and
2Department of Pathology, Northwestern University Feinberg School of Medicine, Chicago, Illinois, USA.
3Department of Microbiology and Immunology, Medical College of Wisconsin, Milwaukee, Wisconsin, USA.
4Department of Urology and
5Department of Biochemistry and Molecular Genetics, Northwestern University Feinberg School of Medicine, Chicago, Illinois, USA.
6Jesse Brown Department of Veterans Affairs Medical Center, Chicago, Illinois, USA.
Address correspondence to: Joshua J. Meeks, Department of Urology, Northwestern University Feinberg School of Medicine, 676 N. St. Clair, Suite 2300, Chicago, IL 60611, USA. Phone: 312.695.8146; Email: joshua.meeks@northwestern.edu.
Find articles by Brown, R. in: PubMed | Google Scholar
1Department of Microbiology and Immunology and
2Department of Pathology, Northwestern University Feinberg School of Medicine, Chicago, Illinois, USA.
3Department of Microbiology and Immunology, Medical College of Wisconsin, Milwaukee, Wisconsin, USA.
4Department of Urology and
5Department of Biochemistry and Molecular Genetics, Northwestern University Feinberg School of Medicine, Chicago, Illinois, USA.
6Jesse Brown Department of Veterans Affairs Medical Center, Chicago, Illinois, USA.
Address correspondence to: Joshua J. Meeks, Department of Urology, Northwestern University Feinberg School of Medicine, 676 N. St. Clair, Suite 2300, Chicago, IL 60611, USA. Phone: 312.695.8146; Email: joshua.meeks@northwestern.edu.
Find articles by Khan, M. in: PubMed | Google Scholar
1Department of Microbiology and Immunology and
2Department of Pathology, Northwestern University Feinberg School of Medicine, Chicago, Illinois, USA.
3Department of Microbiology and Immunology, Medical College of Wisconsin, Milwaukee, Wisconsin, USA.
4Department of Urology and
5Department of Biochemistry and Molecular Genetics, Northwestern University Feinberg School of Medicine, Chicago, Illinois, USA.
6Jesse Brown Department of Veterans Affairs Medical Center, Chicago, Illinois, USA.
Address correspondence to: Joshua J. Meeks, Department of Urology, Northwestern University Feinberg School of Medicine, 676 N. St. Clair, Suite 2300, Chicago, IL 60611, USA. Phone: 312.695.8146; Email: joshua.meeks@northwestern.edu.
Find articles by Houston, A. in: PubMed | Google Scholar
1Department of Microbiology and Immunology and
2Department of Pathology, Northwestern University Feinberg School of Medicine, Chicago, Illinois, USA.
3Department of Microbiology and Immunology, Medical College of Wisconsin, Milwaukee, Wisconsin, USA.
4Department of Urology and
5Department of Biochemistry and Molecular Genetics, Northwestern University Feinberg School of Medicine, Chicago, Illinois, USA.
6Jesse Brown Department of Veterans Affairs Medical Center, Chicago, Illinois, USA.
Address correspondence to: Joshua J. Meeks, Department of Urology, Northwestern University Feinberg School of Medicine, 676 N. St. Clair, Suite 2300, Chicago, IL 60611, USA. Phone: 312.695.8146; Email: joshua.meeks@northwestern.edu.
Find articles by Niu, H. in: PubMed | Google Scholar
1Department of Microbiology and Immunology and
2Department of Pathology, Northwestern University Feinberg School of Medicine, Chicago, Illinois, USA.
3Department of Microbiology and Immunology, Medical College of Wisconsin, Milwaukee, Wisconsin, USA.
4Department of Urology and
5Department of Biochemistry and Molecular Genetics, Northwestern University Feinberg School of Medicine, Chicago, Illinois, USA.
6Jesse Brown Department of Veterans Affairs Medical Center, Chicago, Illinois, USA.
Address correspondence to: Joshua J. Meeks, Department of Urology, Northwestern University Feinberg School of Medicine, 676 N. St. Clair, Suite 2300, Chicago, IL 60611, USA. Phone: 312.695.8146; Email: joshua.meeks@northwestern.edu.
Find articles by Podojil, J. in: PubMed | Google Scholar
1Department of Microbiology and Immunology and
2Department of Pathology, Northwestern University Feinberg School of Medicine, Chicago, Illinois, USA.
3Department of Microbiology and Immunology, Medical College of Wisconsin, Milwaukee, Wisconsin, USA.
4Department of Urology and
5Department of Biochemistry and Molecular Genetics, Northwestern University Feinberg School of Medicine, Chicago, Illinois, USA.
6Jesse Brown Department of Veterans Affairs Medical Center, Chicago, Illinois, USA.
Address correspondence to: Joshua J. Meeks, Department of Urology, Northwestern University Feinberg School of Medicine, 676 N. St. Clair, Suite 2300, Chicago, IL 60611, USA. Phone: 312.695.8146; Email: joshua.meeks@northwestern.edu.
Find articles by Choy, B. in: PubMed | Google Scholar
1Department of Microbiology and Immunology and
2Department of Pathology, Northwestern University Feinberg School of Medicine, Chicago, Illinois, USA.
3Department of Microbiology and Immunology, Medical College of Wisconsin, Milwaukee, Wisconsin, USA.
4Department of Urology and
5Department of Biochemistry and Molecular Genetics, Northwestern University Feinberg School of Medicine, Chicago, Illinois, USA.
6Jesse Brown Department of Veterans Affairs Medical Center, Chicago, Illinois, USA.
Address correspondence to: Joshua J. Meeks, Department of Urology, Northwestern University Feinberg School of Medicine, 676 N. St. Clair, Suite 2300, Chicago, IL 60611, USA. Phone: 312.695.8146; Email: joshua.meeks@northwestern.edu.
Find articles by
Cui, W.
in:
PubMed
|
Google Scholar
|

1Department of Microbiology and Immunology and
2Department of Pathology, Northwestern University Feinberg School of Medicine, Chicago, Illinois, USA.
3Department of Microbiology and Immunology, Medical College of Wisconsin, Milwaukee, Wisconsin, USA.
4Department of Urology and
5Department of Biochemistry and Molecular Genetics, Northwestern University Feinberg School of Medicine, Chicago, Illinois, USA.
6Jesse Brown Department of Veterans Affairs Medical Center, Chicago, Illinois, USA.
Address correspondence to: Joshua J. Meeks, Department of Urology, Northwestern University Feinberg School of Medicine, 676 N. St. Clair, Suite 2300, Chicago, IL 60611, USA. Phone: 312.695.8146; Email: joshua.meeks@northwestern.edu.
Find articles by Meeks, J. in: PubMed | Google Scholar
Published May 4, 2026 - More info
J Clin Invest. 2026;136(12):e200442. https://doi.org/10.1172/JCI200442.
© 2026 Brown et al. This work is licensed under the Creative Commons Attribution 4.0 International License. To view a copy of this license, visit http://creativecommons.org/licenses/by/4.0/.
Received: September 19, 2025; Accepted: April 8, 2026


-
Results
To investigate how the local and systemic immune systems evolve during intravesical BCG treatment for BCa, scRNA-seq was performed on blood and tissue biopsies from patients with high-risk NMIBC (Figure 1A). To avoid possible contribution and overrepresentation of epithelial cells from invasive BCa, tissue biopsies were taken adjacent to the tumor in visually “normal” areas of the bladder. CD45 enrichment was performed on the tissue samples during the processing before scRNA-seq (Figure 1A). To further elucidate the mechanism of an effective BCG response, data were collected from BCG-naive (n = 7), BCG-responsive (n = 6), and BCG-unresponsive (n = 8) patients among a total of 19 patients (Figure 1, B and C). In parallel, scRNA-seq was performed on PBMCs to augment the analysis of tissue specimens (Figure 1, A–C).
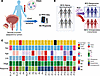 Figure 1
Study design and patient cohort for immune profiling of the BCa tumor microenvironment during BCG therapy. (A) Sample collection from patients with BCa. For most patients, whole and bladder biopsies adjacent to the tumor were collected prospectively with CD45+ isolation and analyzed by scRNA-seq using the BD Rhapsody system. (B) Patients were prospectively enrolled at 2 distinct time points: before (BCG naive) and after BCG therapy. After BCG therapy, patients were classified as either responsive or resistant, depending on the result of the bladder biopsy. (C) Metadata of each patient’s covariates were sequenced, including sex, age, tumor stage, tissue compartments, and the patient’s BCG response CIS, carcinoma in situ.
Immune landscape of the bladder and circulation of BCG-treated patients. scRNA-seq data were generated for 84,616 cells using the BD Rhapsody single-cell system, with matched tissue and blood samples multiplexed together using sample tags. The BD system was selected to allow for the preservation of fragile neutrophil populations from the bladder (22). After quality control analyses, data were analyzed for 74,651 immune cells. We utilized the R package Seurat to integrate the data from 20 blood and 20 bladder biopsies across BCG naive, BCG responder, and BCG nonresponder groups using canonical correlation analysis. After integrating the samples, we projected the immune cells in 2 dimensions by UMAP and performed unsupervised clustering (Figure 2A). We identified immune cell populations using differentially expressed genes across these identified clusters (Figure 2B and Supplemental Figure 1A; supplemental material available online with this article; https://doi.org/10.1172/JCI200442DS1). To confirm our sequencing data quality, we plotted cell counts and the distribution of cell types for each patient in the tissue (Supplemental Figure 2A) and blood (Supplemental Figure 2B) biopsies. We next examined how immune cell composition varied between the peripheral blood and the tumor site (Figure 2, C and D, and Supplemental Figure 1B). A global comparison of all CD45+ cells revealed striking compartment-specific differences of immune cells between bladder tissue (n = 32,873) and blood (n = 41,778). We identified that blood samples predominantly comprised neutrophils (81% of cells), while T cells were the primary CD45+ cells isolated from the bladder (58% of cells) (Figure 2C). Underscoring the distinct immune landscape at the tumor site, the bladder tissues exhibited significantly higher frequencies of NK cells, CD4+ and CD8+ T cells, DCs, mast cells, and B cells compared with blood (Figure 2C). To understand how BCG influences the immune profile, we categorized samples based on BCG exposure status (pre-BCG [naive] and post-BCG [BCG responsive or unresponsive]) and compared the relative frequencies of conditions across immune cell types (Figure 2D). In the bladder, BCG exposure was linked to a notable increase in CD4+ T cells (Figure 2D), while the peripheral blood showed no significant change in overall immune composition (Supplemental Figure 1C). However, this increase in CD4+ T cells was mainly driven by BCG-responsive tumors, indicating a localized, treatment-related expansion of this subset in effective immune responses (Figure 2D).
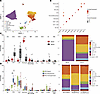 Figure 2
Comprehensive dissection and clustering of immune cells from BCG-treated bladders. (A) UMAP plot of all immune cells collected across 19 patients from the blood and bladder tissue of BCG-naive, -responsive, and -unresponsive groups. (B) Dot plot of representative genes expressed in each major cluster. Dot size represents percentage of cells expressing the gene; color represents scaled expression of the gene. (C) Proportion of immune cell types in blood and bladder. Left: Box-and-whisker plots showing the distribution of immune cell type proportions for each patient, measured by Welch’s t test. Right: Stacked bar plots summarizing immune cell type proportions after downsampling to 200 cells per sample and measured by a χ2 test. (D) Proportion of immune cell types in the bladder tissue of BCG-naive, -responsive, and -unresponsive groups, measured by Welch’s t test. Left: Box-and-whisker plots showing the distribution of immune cell type proportions. Right: Stacked bar plots summarizing immune cell type proportions after downsampling to 200 cells per sample and measured by a χ2 test. Box-and-whisker plots depict median, IQR, and whiskers extending to 1.5× IQR in C and D. *P < 0.05, **P < 0.01, ***P < 0.001, ****P < 0.0001.
Opposing Th17 and Treg signatures define response to BCG. Because they represent the greatest abundance of immune cells in the bladder, we first analyzed the lymphocyte pool including CD4+ (Figure 3), CD8+ (Figure 4), and NK cells (Supplemental Figure 3). We further examined the CD4+ T cell landscape before and after BCG administration since we identified a significant expansion of CD4+ T cells in the bladders of BCG-responsive patients. Overall, there were 11,757 CD4+ T cells across all patients and cellular compartments. To more accurately align the CD4+ T cells, we performed integration using SCTransform, followed by a UMAP projection and nearest-neighbor clustering (Figure 3A). To identify cell subtypes, we performed differential gene expression and identified previously described canonical CD4+ T cell types. The cluster with high expression of TCF7, SELL, LEF1, and CCR7 was identified as “naive/memory cluster,” while the cluster with high expression of FOXP3, IL-2RA, and IKZF2 was identified as “Tregs” (Figure 3B). Most other CD4+ T cells exhibited a Th1 phenotype, characterized by high levels of STAT4, IL-12Rβ2, and IFN-γ. However, some of these cells exhibited a more conventional Th1 profile, characterized by high expression of TNF, TBX21, and NKG7, while others displayed a unique expression of Th17-like markers, including IL-17A, IL-17F, SOX5, and IL-26 (Figure 3B). To further investigate the differences between these CD4+ T cells, we applied a cosine similarity index, which performs pairwise comparisons of gene expression between cell types. We found that Tregs and naive/memory CD4+ T cells had little similarity to all other CD4+ cell subtypes, while Th1 and Th17-like Th1 cells had high pairwise cosine similarity scores, suggesting that these Th17-like cells are still part of the Th1 lineage rather than fully differentiated Th17 cells (Supplemental Figure 4A).
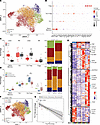 Figure 3
Opposing Th17 and Treg signatures define response to BCG. (A) UMAP plot of CD4+ T cells from the blood and bladder tissue of BCG-naive, -responsive, and -unresponsive groups. (B) Dot plot of representative genes expressed in each major cluster. Dot size represents percentage of cells expressing the gene; color represents scaled expression of the gene. (C) Proportion of CD4+ cell subsets in blood and bladder, measured by Welch’s t test. Left: Box-and-whisker plots showing the distribution of immune cell type proportions for each patient. Right: Stacked bar plots summarizing immune cell type proportions after downsampling to 100 cells per sample. (D) Proportion of CD4+ cell subsets in the bladder tissue of BCG-naive, -responsive, and -unresponsive groups, measured by Welch’s t test. Left: Box-and-whisker plots showing the distribution of CD4+ cell subset proportions. Right: Stacked bar plots summarizing CD4+ cell subset proportions after downsampling to 100 cells per sample. (E) Heatmap showing differentially expressed genes of CD4+ T cell subsets in BCG-naive (N), -responsive (R), and -unresponsive (U) groups. (F) Slingshot trajectory plot showing predicted cellular differentiation possibilities of CD4+ T cells. (G) Linear regression between a patient’s proportion of Th17-like and Treg cells. Each point represents 1 patient. Gray shaded region, 95% CI. Box-and-whisker plots depict median, IQR, and whiskers extending to 1.5× IQR in C and D. *P < 0.05, ****P < 0.0001.
 Figure 4
CD8+ T cells demonstrate increased exhaustion in BCG-unresponsive bladders. (A) UMAP plot of CD8+ T cells from the blood and bladder tissue from BCG-naive, -responsive, and -unresponsive groups. (B) Dot plot of representative genes expressed in each major cluster. Dot size represents percentage of cells expressing the gene; color represents scaled expression of the gene. (C) Proportion of CD8+ cell subsets in blood and bladder, measured by Welch’s t test. Left: Box-and-whisker plots showing the distribution of immune cell type proportions for each patient. Right: Stacked bar plots summarizing CD8+ subset proportions after downsampling to 200 cells per sample. (D) Proportion of CD8+ cell subsets in the bladder tissue of BCG-naive, -responsive, and -unresponsive groups, measured by Welch’s t test. Left: Box-and-whisker plots showing the distribution of CD8+ T cell subset proportions. Right: Stacked bar plots summarizing CD8+ cell subset proportions after downsampling to 200 cells per sample. (E) Heatmap showing differentially expressed genes of CD8+ T cell subsets categorized by BCG-naive, -responsive, and -unresponsive groups. Box-and-whisker plots depict median, IQR, and whiskers extending to 1.5× IQR in C and D. *P < 0.05, ****P < 0.0001.
To analyze the immune profile of CD4+ T cells during BCa treatment with BCG, we compared the cell types between blood and bladder tissue (Supplemental Figure 4B). While the proportion of Th1 cells was consistent between treated and untreated bladder samples (~40%), Th17-like Th1 cells were markedly enriched in the bladder, emerging as the dominant CD4+ population (~45%) (Figure 3C). This shift was accompanied by a significant relative absence of naive/memory CD4+ T cells, reflecting a transition toward a more activated immune environment in the bladder (Figure 3C). We next determined how BCG exposure status impacted CD4+ T cell distributions. While BCG exposure had minimal impact on circulating immune cell populations (Supplemental Figure 4C), we found that BCG-responsive patients had increased Th17-like Th1 cells and decreased Tregs when compared with BCG-naive patients (Figure 3D). While Th1 changes have been described after BCG exposure, the Th17-like signature in BCG-responsive patients is consistent with the activation of a Th17 CD4+ T cell population after Mtb exposure (23).
To more narrowly explore how BCG exposure and response impact tissue-specific CD4+ T cells after BCG exposure, we investigated how gene expression was altered within these identified cell states. We identified the top differentially expressed genes and performed downsampling to ensure each patient was weighted equally. We then applied k-means hierarchical clustering to determine broad gene expression signatures. We identified 4 major gene signatures corresponding to each of the 4 major cell types identified in our UMAP clustering (Figure 3E). While many cell type–specific genes were expressed uniquely in each cluster, we also observed differences in gene expression between BCG exposures. Interestingly, we observed that the BCG-responsive group exhibited high gene expression of Th17 genes, such as IL-17A and IL-26, as well as higher expression of Th1 genes, including IFNG, within the Th17-like Th1 cell cluster. Together, this suggests that the Th17-like Th1 population is not only more frequent in BCG responders but also has a greater capacity to produce critical functional markers, indicating greater activation and function on a per-cell basis. In contrast, nonresponding BCG patients had higher expression of Treg signature genes, including CTLA4, ICOS, FOXP3, and TOX. Higher expression of these immunosuppressive surface markers, cytokines, and transcription factors suggests that BCG-unresponsive patients have Tregs with more potent immunosuppressive capacity. Th17 cells and Tregs have been previously shown to have mutual antagonism, competing for TGF-β during differentiation and subsequently establishing opposing inflammatory environments, a phenomenon well established in autoimmune diseases (24). This finding aligns with past work that identified a relationship between CD4+ T cells and BCa, whereby the percentage of IL-17–producing CD4+ T cells inversely correlates with the percentage of Treg cells (25). To explore this dynamic in our BCG BCa model, we performed trajectory analysis with the slingshot algorithm and identified 3 distinct lineages (Figure 3F). We observed that these lineages originated from the naive/memory CD4+ T cell population and differentiated into the Th1, Th1/17, and Treg populations. Overall, our model suggests an early branch point prior to terminal fate commitments. Consistent with the mutual antagonism model of differentiation, we observed a negative correlation between Th1/17 and Treg populations across samples (Figure 3G). Together, our results suggest that this Th17/Treg relationship is critical for generating effective immune responses to mycobacterial infections such as BCG and Mtb.
CD8+ T cells demonstrate increased exhaustion in BCG-unresponsive bladders. While there were no significant differences in the overall proportion of CD8+ T cells between responders and nonresponders to BCG (Figure 2, C and D), we sought to identify differences in CD8+ T cell subsets using single-cell profiling. We isolated the CD8+ T cell population, reintegrated the cells, and applied unbiased UMAP clustering, where we identified 3 distinct clusters through shared nearest-neighbor optimization (Figure 4A). These CD8+ subtypes had varied cell expressions that reflected previously described cell types including naive/memory T cells (TCF7, KLF2, SELL, and CCR7), effector T cells (KLRG1, PRF1, and CXC3R1), and exhausted T cells (TOX, ENTPD1, and LAG3) (Figure 4B and Supplemental Figure 5A) (26, 27). To explore how bladder tissue affects the CD8+ T cell populations, we compared the shifts in population between the blood and bladder. We observed a higher number of effector CD8+ T cells in the blood and an enrichment of exhausted CD8+ T cells in the bladder (Figure 4C and Supplemental Figure 5B). This tissue-specific shift in CD8+ T cell profile suggests BCa promotes localized T cell exhaustion.
To determine if BCG-responsive and -unresponsive patients had differences within CD8+ T cells, we compared the frequency of CD8+ cell subtypes. While there was no difference in CD8+ cell types in the blood (Supplemental Figure 5C), we identified significantly lower effector CD8+ T cells in BCG-unresponsive bladders and significantly increased exhausted CD8+ T cells in BCG-unresponsive bladders (Figure 4D). To more specifically explore how BCG exposure impacts CD8+ T cell differentiation, we analyzed the differential expression of individual genes within each cell across both CD8+ clusters and BCG exposures, identifying 1,064 genes. To control differences in patient cell count, each patient sample was randomly downsampled to 200 cells to ensure equal weighting between patient replicates. We then applied k-means hierarchical clustering so that we could identify broad gene expression signatures (Figure 4E). We found that gene expression could be categorized into 3 main signatures, namely, Tpro, Teff, and Texh. While these signatures corresponded to CD8+ T cell clusters, the signatures were not equally shared across BCG exposures within those clusters. In the naive/memory cluster, the Tpro signature was more highly expressed in the BCG naive and BCG responders, while the BCG nonresponders indicated a lower level of expression. Notably, recent investigations of CD8+ T cells have highlighted the significance of these stem-like signatures in sustaining robust CD8+ T cell responses against tumors (28, 29). The Teff gene cluster exhibited a shared signature of effector-related genes, including GZMK, GZMH, KLRG1, S1PR1, and NKG7, across the BCG exposures. However, a second effector signature comprising cytokines such as TNF, IL-2, and IFNG was specific to the BCG-naive condition, with a significant reduction in patients exposed to BCG. Finally, we identified a third signature made up of genes related to exhaustion. Overall, we found that some genes were shared across BCG exposures in the exhausted cluster, including ENTPD1, CXCR6, and PRDM1. However, the BCG-nonresponding patients showed significantly higher expression of additional exhaustion markers, including CTLA4, TOX, and TIGIT, as well as tissue residence–related markers, including ITGAE, CD101, and ITGA1. Notably, we found that this exhausted CD8+ T cell signature was also higher in the naive/memory cluster, indicating that these precursor cells may already be undergoing exhaustion. Interestingly, the anti–PD-1 therapy function is known to operate by inhibiting PD-1 on these progenitor cells (30). These results suggest that corresponding immunotherapies may be beneficial for BCG-nonresponding patients who exhibit high levels of CD8+ T cell exhaustion. Overall, this analysis reveals that BCG-nonresponding patients exhibit altered CD8+ T cell differentiation and cellular signatures characteristic of T cell exhaustion.
To examine immune cell signatures more closely in BCG BCa, we sampled 11 separate bladder biopsies on patients not included in the scRNA-seq study. We designed a flow cytometry panel to examine NK and CD8+ T cell effector signatures and found that BCG responders had more TNF-α+CD8+ T cells, whereas nonresponders had an increased percentage of TNF-α/IFN-γ double-negative CD8+ T cells (Supplemental Figure 5D). These findings complement our single-cell findings by suggesting that CD8+ T cells exhibit increased cytotoxic function in BCG responders.
Macrophage polarization and T cell interactions. We further evaluated the myeloid populations, including macrophages (Figure 5) and neutrophils (Supplemental Figure 6). Mtb primarily infects alveolar macrophages in the lung, and numerous studies have implicated macrophage-mediated signaling as a central mechanism of tuberculosis-driven immune regulation (31, 32). Given the parallels between Mtb infection and intravesical BCG therapy, we sought to investigate how BCG influences the myeloid compartment within the bladder. To investigate this, we reintegrated all monocyte and macrophage cells, applied UMAP dimensionality reduction, and performed nearest-neighbor clustering, which revealed 4 major clusters (Figure 5A). Myeloid cell populations were primarily composed of classical monocytes (CD14 and VCAN) and nonclassical monocytes (FCGR3A, CX3CR1, and ITGAL) (Figure 5B). Some cells shared the expression signature of classical monocytes but also had a strong interferon-stimulated signature (ISG15 and ISG20) (Figure 5B). Finally, a cluster of macrophages with a primarily M2-like phenotype was identified (CD163 and MRC1), which we termed tumor-associated macrophages (TAMs) (Figure 5B). Having defined these distinct myeloid subsets, we sought to understand how their distribution differed between systemic circulation and the bladder microenvironment (Supplemental Figure 7A). Reflecting the capacity of tissue environments to drive monocyte-to-macrophage differentiation, we found that bladder tissue exhibited a reduction in circulating monocyte populations and a notable expansion of macrophages (Figure 5C). To explore how BCG influences the myeloid compartment, we compared myeloid populations between BCG-naive and BCG-exposed patients. Interestingly, classical monocytes, which are primarily involved in inflammatory responses, were increased in the blood of BCG-responsive patients (Figure 5D and Supplemental Figure 7B) (33, 34). Overall, this shift suggests that BCG responders induce a systemic bias toward an inflammatory monocyte phenotype, which in turn modulates the tumor microenvironment upon tissue infiltration and macrophage differentiation.
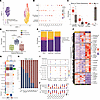 Figure 5
Macrophage polarization and T cell interactions. (A) UMAP plot of monocyte and macrophage cells from the blood and bladder tissue of BCG-naive, -responsive, and -unresponsive groups. (B) Dot plot of representative genes expressed in each major cluster. Dot size represents percentage of cells expressing the gene; color represents scaled expression of the gene. (C) Proportion of monocyte and macrophage subsets between the blood and bladder measured, by Welch’s t test. Each dot represents 1 patient. (D) Proportion of monocytes and macrophages in the blood of BCG-naive and -exposed (responsive and unresponsive) groups measured, by Welch’s t test. (E) Stacked bar plots summarizing monocyte and macrophage cell subset proportions after downsampling to 50 cells per sample in the bladder tissue. Significance measured by χ2 test. (F) Heatmap showing differentially expressed genes of monocyte and macrophage subsets categorized by BCG-naive, -responsive, and -unresponsive groups. (G) Heatmap of CellChat’s cell–cell interaction scores between BCG-responsive and-unresponsive cells. (H) Differences in TAMs to T cell interaction scores between BCG-responsive and -unresponsive cells. (I) Dot plot of macrophage ligands/cytokines to T cell receptors that are increased (lower) and decreased (upper) in BCG nonresponders. Color represents communication probability of a ligand/receptor signaling pathway. (J) Dot plot of MHCII genes in APCs. Dot size represents percentage of cells expressing the gene; color represents scaled expression of the gene. Box-and-whisker plots depict median, IQR, and whiskers extending to 1.5× IQR in C and D. *P < 0.05, **P < 0.01, ****P < 0.0001.
To explore how BCG impacts macrophage differentiation in the bladder, we examined overall macrophage populations. We found that the majority (1,071 cells) of the total macrophages (1,284 cells) were present in the BCG-unresponsive bladders, with a limited number of macrophages (213 cells, 17%) found in the BCG-responsive bladders. While we saw a trend toward greater TAMs across BCG conditions within the bladder tissue, there was a high degree of heterogeneity across patients resulting in no significant differences across groups (Supplemental Figure 7C). However, when we performed downsampling and quantified cellular differences, we noticed that BCG-unresponsive patients had the highest proportion of TAMs (Figure 5E). TAMs have been described as having both proinflammatory and immunosuppressive roles. Although we did not observe discrete subsets corresponding to classically defined M1 and M2 macrophages, we hypothesized that the overall macrophage compartment could still exhibit phenotypic polarization between BCG responders and nonresponders. To test this, we downsampled to control for interpatient differences in cell numbers and performed differential gene expression analysis between cells from BCG-naive, BCG-responsive, and BCG-unresponsive patients (Figure 5F). Notably, TAMs from BCG nonresponders had elevated expression of a distinct cluster of genes, such as SPP1, which has been implicated in regulation of T cell exhaustion, as well as PPARG, TGFBR2, and MRC2, which are associated with regulatory or immunosuppressive functions (35, 36).
To better understand whether TAMs orchestrate immune responses to BCG, we utilized the CellChat algorithm to analyze ligand–receptor interactions across various immune cell types. By weighing the total outgoing signaling from each population and comparing BCG responders to nonresponders, we observed notable shifts in cellular crosstalk (Figure 5G). While overall cell–cell interaction strength was largely comparable between groups, we identified striking differences in signaling directed toward CD8+ T cells. In BCG-unresponsive patients, CD8+ T cells received predominant input from TAMs, whereas in BCG-responsive patients, CD4+ T cells were the main signaling source (Figure 5G). This pattern aligns with recent evidence that CD4+ T cell help is essential for sustaining CD8+ T cell function and preventing exhaustion, while TAMs are implicated in regulation of CD8+ T cell dysfunction (26, 37, 38).
To dissect the pathways mediating these interactions, we compared CellChat signaling profiles between groups. PD-L1 and PD-L2 signaling were the most enriched inhibitory pathways in BCG-unresponsive patients, accompanied by elevated TIGIT, CD244A, and CD266 signaling, as well as immunosuppressive cytokines including TNFSF10 (TRAIL) and TGF-β (Figure 5, H and I). In contrast, BCG-responsive patients exhibited increased signaling through proinflammatory and recruitment pathways, including CXCL9, CXCL10, CXCL11, CXCL12, and CXCL16, along with enhanced IL-2 and MHCII pathways (Figure 5, H and I). Interestingly, BCG is known to suppress MHC expression (39), and MHCII expression was not exclusive to BCG-responding TAMs but was more highly expressed across all BCG-responding antigen-presenting cells (Figure 5J and Supplemental Figure 8A). To validate this finding, we analyzed our previously published bulk RNA-seq dataset from 103 BCG-treated stage I NMIBC tumors (40). Higher expression of antigen presentation genes such as CD74 and HLA-DOA was associated with significantly improved survival, supporting the importance of high MHC signaling for effective responses (Supplemental Figure 8B).
To further investigate how CD4+ T cells may support CD8+ T cell function in BCG responders, we specifically examined signaling between these 2 populations. While no signaling pathways were strongly enriched in unresponsive patients, we identified a significant enrichment of the CCL5 (RANTES)/CCR5 axis in BCG responders (Supplemental Figure 8C). Although IL-21 signaling is widely recognized as a central mediator of CD4+ T cells to CD8+ T cells, recent studies have shown that RANTES also contributes to the differentiation of CD8+ T cells into the effector lineage (41).
To validate some of our predicted interactions, we performed multiplex immunofluorescence using 30 markers on 3 BCG-responsive and 3 BCG-unresponsive tissue samples. We utilized QuPath to generate a single measurement classifier to determine set thresholds of signal positivity to characterize immune cell types such as DCs, macrophages, and CD4+ and CD8+ T cells. Grossly, BCG responders exhibited greater immune cell infiltration, often forming lymphoid aggregates (Supplemental Figure 9, A–C). We then used the R package Spatial Image Analysis of Tissues to determine localization differences between different cell types. We identified that CD4+ T cells were closer to TAMs in nonresponders than in responders. To control potential inherent localization differences between tissues, we also compared CD4+ T cells to DCs and found no differences in cellular distance (Supplemental Figure 9, D and E). Together, this supports the CellChat findings of a TAM-driven immunosuppressive signaling network.
Machine learning model to infer important cellular and gene characteristics of BCG responders. Having constructed a single-cell atlas of the immune landscape in BCa, we next aimed to quantify the relative contribution of each immune cell type in predicting BCG responsiveness. We applied the Precise (Predictive Response Analysis from Single-Cell Expression) machine learning framework, which leverages the XGBoost algorithm in a leave-one-out cross-validation setup (42). Feature importance was refined using Boruta selection, ultimately identifying 57 highly informative genes (Supplemental Figure 10A). To further dissect the impact of these genes on model performance, we calculated SHAP (Shapley additive explanations) values, which quantify each gene’s contribution to predicting BCG response (Supplemental Figure 10B). Notably, CD4+ T cell–derived cytokines such as IL-17A, IL-21, and IL-26, along with the receptor IL-12RB2, were among the strongest positive model-informative features of response (Figure 6A). These findings align with our earlier observations, which implicated Th17-like Th1 cells in effective immune responses. Moreover, expression of CD74, a key component of antigen presentation by APCs, also positively influenced response classification (Figure 6A and Supplemental Figure 10B). In contrast, genes enriched in suppressive myeloid populations, such as SPP1 in TAMs, contributed to classification of BCG nonresponsiveness (Figure 6A). Together, this integrative analysis highlights both molecular signatures that distinguish responders from nonresponders and provides a framework for future biomarker development.
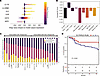 Figure 6
Machine learning model to infer important cellular and gene characteristics of BCG responders. (A) Representative Boruta-selected genes. Positive SHAP values indicate that the gene is predicative of BCG responders. (B) Reinforcement learning (RL) score averaged for each major cell type. Positive RL scores indicate that the cell type is predictive of BCG responders. (C) Proportion of a cell subtype’s RL score categorized by associated with response (>0.5) or nonresponse (<0.5) or nonassociated (–0.5, 0.5). (D) Kaplan-Meier curve of recurrence-free survival for patients expressing high and low expression of IL-21, IL-17A, and IL-26 defined by a log-rank P value.
To determine which immune cell types are most critical for therapeutic outcomes, we applied Precise’s reinforcement learning framework using the Boruta-selected gene list. In this approach, initial cell labels were assigned as +1 for cells from BCG responders and −1 for those from nonresponders. These labels were then iteratively updated based on the model’s accuracy in classifying each cell to outcome, allowing us to quantify the classification contribution of each cell type. Remarkably, CD4+ T cells emerged as the only population with a net positive classification value for BCG response, reinforcing their unique role in driving effective antitumor immunity (Figure 6B). In contrast, while multiple cell types contributed to classifying nonresponse, macrophages stood out as the strongest indicators of treatment failure (Figure 6B). This dichotomy suggests that an effective BCG response hinges on the presence of immunostimulatory CD4+ T cell subsets, whereas an immunosuppressive myeloid environment dominated by macrophages may underlie therapeutic resistance.
To better understand which immune populations are associated with BCG treatment outcomes, we evaluated each cell subtype based on categorizations of the reinforcement learning scores. We first assigned a classification to each cell individually. Cells scoring less than –0.5 were considered “associated with nonresponse” and those with a score greater than +0.5 as “associated with response.” Cells with scores near zero, indicating no predictive power, were termed “nonassociated.” Ranking cell types by these categorizations revealed patterns consistent with known biology (Figure 6C). For instance, exhausted CD8+ T cells were more strongly linked to BCG nonresponse, whereas effector CD8+ T cells were associated with response (Figure 6C). Similarly, proinflammatory classical monocytes and cytotoxic CD16+ NK cells had higher response association scores than their immunosuppressive counterparts, such as tumor-infiltrating NK cells and TAMs (Figure 6C). Notably, Th17-like Th1 cells emerged as the most important subset for classifying BCG responsiveness (Figure 6C). Together, these results underscore how the overall immune cell composition shapes the trajectory of BCG treatment response.
Given that Th17-like Th1 CD4+ T cells were the most enriched population in BCG responders and that IL-17A, IL-21, and IL-26 emerged as top predictive features in our machine learning analysis, we sought to validate this observation in an independent dataset. Using our previously published cohort of 103 BCG-treated patients, we stratified individuals based on their cytokine expression. Strikingly, patients with high expression demonstrated significantly improved recurrence-free survival over 24 months, with 18 out of 27 (66%) remaining recurrence free compared with only 32 out of 76 (42%) in the low expression group (Figure 6D). These results suggest that a robust Th17-like Th1 response may play a pivotal and previously underappreciated role in orchestrating effective antitumor immunity in the context of BCG therapy.


Copyright © 2026 American Society for Clinical Investigation
ISSN: 0021-9738 (print), 1558-8238 (online)