
Advertisement
Research ArticleImmunologyInflammationMetabolism
Open Access |  10.1172/JCI198076
GSDME–IL-18 pyroptotic axis prevents myosteatosis by expanding tissue-resident macrophages to promote muscle regeneration
Qi Cao,1 Jian Liu,2 Gang Huang,3 Su-Yuan Wang,1 Guo-Dong Lu,1 Yong Huang,1 Yi-Ting Chen,1 Zhen Zhang,4 Jiang-Tao Fu,1 Si-Jia Sun,4 Xiao-Fei Chen,1 Chunlin Zhuang,1 Chunquan Sheng,1 Fu-Ming Shen,4 Dong-Jie Li,4 and Pei Wang1
1Center for Basic Research and Innovation of Medicine and Pharmacy (MOE), School of Pharmacy, Naval Medical University, Shanghai, China.
2Department of Hepatic Surgery, Eastern Hepatobiliary Surgery Hospital, Naval Medical University, Shanghai, China.
3Department of Urology, Baoshan Renhe Hospital, Shanghai University, Shanghai, China.
4Department of Pharmacy, Shanghai Tenth People’s Hospital, School of Medicine, Tongji University, Shanghai, China.
Address correspondence to: Pei Wang, Center for Basic Research and Innovation of Medicine and Pharmacy (MOE), School of Pharmacy, Naval Medical University, Shanghai 200433, China. Phone: 86.21.81871203; Email: pwang@smmu.edu.cn.
Authorship note: QC, JL, GH, and SYW contributed equally to this work and are co–first authors.
Find articles by Cao, Q. in: PubMed | Google Scholar
1Center for Basic Research and Innovation of Medicine and Pharmacy (MOE), School of Pharmacy, Naval Medical University, Shanghai, China.
2Department of Hepatic Surgery, Eastern Hepatobiliary Surgery Hospital, Naval Medical University, Shanghai, China.
3Department of Urology, Baoshan Renhe Hospital, Shanghai University, Shanghai, China.
4Department of Pharmacy, Shanghai Tenth People’s Hospital, School of Medicine, Tongji University, Shanghai, China.
Address correspondence to: Pei Wang, Center for Basic Research and Innovation of Medicine and Pharmacy (MOE), School of Pharmacy, Naval Medical University, Shanghai 200433, China. Phone: 86.21.81871203; Email: pwang@smmu.edu.cn.
Authorship note: QC, JL, GH, and SYW contributed equally to this work and are co–first authors.
Find articles by Liu, J. in: PubMed | Google Scholar
1Center for Basic Research and Innovation of Medicine and Pharmacy (MOE), School of Pharmacy, Naval Medical University, Shanghai, China.
2Department of Hepatic Surgery, Eastern Hepatobiliary Surgery Hospital, Naval Medical University, Shanghai, China.
3Department of Urology, Baoshan Renhe Hospital, Shanghai University, Shanghai, China.
4Department of Pharmacy, Shanghai Tenth People’s Hospital, School of Medicine, Tongji University, Shanghai, China.
Address correspondence to: Pei Wang, Center for Basic Research and Innovation of Medicine and Pharmacy (MOE), School of Pharmacy, Naval Medical University, Shanghai 200433, China. Phone: 86.21.81871203; Email: pwang@smmu.edu.cn.
Authorship note: QC, JL, GH, and SYW contributed equally to this work and are co–first authors.
Find articles by Huang, G. in: PubMed | Google Scholar
1Center for Basic Research and Innovation of Medicine and Pharmacy (MOE), School of Pharmacy, Naval Medical University, Shanghai, China.
2Department of Hepatic Surgery, Eastern Hepatobiliary Surgery Hospital, Naval Medical University, Shanghai, China.
3Department of Urology, Baoshan Renhe Hospital, Shanghai University, Shanghai, China.
4Department of Pharmacy, Shanghai Tenth People’s Hospital, School of Medicine, Tongji University, Shanghai, China.
Address correspondence to: Pei Wang, Center for Basic Research and Innovation of Medicine and Pharmacy (MOE), School of Pharmacy, Naval Medical University, Shanghai 200433, China. Phone: 86.21.81871203; Email: pwang@smmu.edu.cn.
Authorship note: QC, JL, GH, and SYW contributed equally to this work and are co–first authors.
Find articles by Wang, S. in: PubMed | Google Scholar
1Center for Basic Research and Innovation of Medicine and Pharmacy (MOE), School of Pharmacy, Naval Medical University, Shanghai, China.
2Department of Hepatic Surgery, Eastern Hepatobiliary Surgery Hospital, Naval Medical University, Shanghai, China.
3Department of Urology, Baoshan Renhe Hospital, Shanghai University, Shanghai, China.
4Department of Pharmacy, Shanghai Tenth People’s Hospital, School of Medicine, Tongji University, Shanghai, China.
Address correspondence to: Pei Wang, Center for Basic Research and Innovation of Medicine and Pharmacy (MOE), School of Pharmacy, Naval Medical University, Shanghai 200433, China. Phone: 86.21.81871203; Email: pwang@smmu.edu.cn.
Authorship note: QC, JL, GH, and SYW contributed equally to this work and are co–first authors.
Find articles by Lu, G. in: PubMed | Google Scholar
1Center for Basic Research and Innovation of Medicine and Pharmacy (MOE), School of Pharmacy, Naval Medical University, Shanghai, China.
2Department of Hepatic Surgery, Eastern Hepatobiliary Surgery Hospital, Naval Medical University, Shanghai, China.
3Department of Urology, Baoshan Renhe Hospital, Shanghai University, Shanghai, China.
4Department of Pharmacy, Shanghai Tenth People’s Hospital, School of Medicine, Tongji University, Shanghai, China.
Address correspondence to: Pei Wang, Center for Basic Research and Innovation of Medicine and Pharmacy (MOE), School of Pharmacy, Naval Medical University, Shanghai 200433, China. Phone: 86.21.81871203; Email: pwang@smmu.edu.cn.
Authorship note: QC, JL, GH, and SYW contributed equally to this work and are co–first authors.
Find articles by Huang, Y. in: PubMed | Google Scholar
1Center for Basic Research and Innovation of Medicine and Pharmacy (MOE), School of Pharmacy, Naval Medical University, Shanghai, China.
2Department of Hepatic Surgery, Eastern Hepatobiliary Surgery Hospital, Naval Medical University, Shanghai, China.
3Department of Urology, Baoshan Renhe Hospital, Shanghai University, Shanghai, China.
4Department of Pharmacy, Shanghai Tenth People’s Hospital, School of Medicine, Tongji University, Shanghai, China.
Address correspondence to: Pei Wang, Center for Basic Research and Innovation of Medicine and Pharmacy (MOE), School of Pharmacy, Naval Medical University, Shanghai 200433, China. Phone: 86.21.81871203; Email: pwang@smmu.edu.cn.
Authorship note: QC, JL, GH, and SYW contributed equally to this work and are co–first authors.
Find articles by Chen, Y. in: PubMed | Google Scholar
1Center for Basic Research and Innovation of Medicine and Pharmacy (MOE), School of Pharmacy, Naval Medical University, Shanghai, China.
2Department of Hepatic Surgery, Eastern Hepatobiliary Surgery Hospital, Naval Medical University, Shanghai, China.
3Department of Urology, Baoshan Renhe Hospital, Shanghai University, Shanghai, China.
4Department of Pharmacy, Shanghai Tenth People’s Hospital, School of Medicine, Tongji University, Shanghai, China.
Address correspondence to: Pei Wang, Center for Basic Research and Innovation of Medicine and Pharmacy (MOE), School of Pharmacy, Naval Medical University, Shanghai 200433, China. Phone: 86.21.81871203; Email: pwang@smmu.edu.cn.
Authorship note: QC, JL, GH, and SYW contributed equally to this work and are co–first authors.
Find articles by Zhang, Z. in: PubMed | Google Scholar
1Center for Basic Research and Innovation of Medicine and Pharmacy (MOE), School of Pharmacy, Naval Medical University, Shanghai, China.
2Department of Hepatic Surgery, Eastern Hepatobiliary Surgery Hospital, Naval Medical University, Shanghai, China.
3Department of Urology, Baoshan Renhe Hospital, Shanghai University, Shanghai, China.
4Department of Pharmacy, Shanghai Tenth People’s Hospital, School of Medicine, Tongji University, Shanghai, China.
Address correspondence to: Pei Wang, Center for Basic Research and Innovation of Medicine and Pharmacy (MOE), School of Pharmacy, Naval Medical University, Shanghai 200433, China. Phone: 86.21.81871203; Email: pwang@smmu.edu.cn.
Authorship note: QC, JL, GH, and SYW contributed equally to this work and are co–first authors.
Find articles by Fu, J. in: PubMed | Google Scholar
1Center for Basic Research and Innovation of Medicine and Pharmacy (MOE), School of Pharmacy, Naval Medical University, Shanghai, China.
2Department of Hepatic Surgery, Eastern Hepatobiliary Surgery Hospital, Naval Medical University, Shanghai, China.
3Department of Urology, Baoshan Renhe Hospital, Shanghai University, Shanghai, China.
4Department of Pharmacy, Shanghai Tenth People’s Hospital, School of Medicine, Tongji University, Shanghai, China.
Address correspondence to: Pei Wang, Center for Basic Research and Innovation of Medicine and Pharmacy (MOE), School of Pharmacy, Naval Medical University, Shanghai 200433, China. Phone: 86.21.81871203; Email: pwang@smmu.edu.cn.
Authorship note: QC, JL, GH, and SYW contributed equally to this work and are co–first authors.
Find articles by Sun, S. in: PubMed | Google Scholar
1Center for Basic Research and Innovation of Medicine and Pharmacy (MOE), School of Pharmacy, Naval Medical University, Shanghai, China.
2Department of Hepatic Surgery, Eastern Hepatobiliary Surgery Hospital, Naval Medical University, Shanghai, China.
3Department of Urology, Baoshan Renhe Hospital, Shanghai University, Shanghai, China.
4Department of Pharmacy, Shanghai Tenth People’s Hospital, School of Medicine, Tongji University, Shanghai, China.
Address correspondence to: Pei Wang, Center for Basic Research and Innovation of Medicine and Pharmacy (MOE), School of Pharmacy, Naval Medical University, Shanghai 200433, China. Phone: 86.21.81871203; Email: pwang@smmu.edu.cn.
Authorship note: QC, JL, GH, and SYW contributed equally to this work and are co–first authors.
Find articles by Chen, X. in: PubMed | Google Scholar
1Center for Basic Research and Innovation of Medicine and Pharmacy (MOE), School of Pharmacy, Naval Medical University, Shanghai, China.
2Department of Hepatic Surgery, Eastern Hepatobiliary Surgery Hospital, Naval Medical University, Shanghai, China.
3Department of Urology, Baoshan Renhe Hospital, Shanghai University, Shanghai, China.
4Department of Pharmacy, Shanghai Tenth People’s Hospital, School of Medicine, Tongji University, Shanghai, China.
Address correspondence to: Pei Wang, Center for Basic Research and Innovation of Medicine and Pharmacy (MOE), School of Pharmacy, Naval Medical University, Shanghai 200433, China. Phone: 86.21.81871203; Email: pwang@smmu.edu.cn.
Authorship note: QC, JL, GH, and SYW contributed equally to this work and are co–first authors.
Find articles by Zhuang, C. in: PubMed | Google Scholar
1Center for Basic Research and Innovation of Medicine and Pharmacy (MOE), School of Pharmacy, Naval Medical University, Shanghai, China.
2Department of Hepatic Surgery, Eastern Hepatobiliary Surgery Hospital, Naval Medical University, Shanghai, China.
3Department of Urology, Baoshan Renhe Hospital, Shanghai University, Shanghai, China.
4Department of Pharmacy, Shanghai Tenth People’s Hospital, School of Medicine, Tongji University, Shanghai, China.
Address correspondence to: Pei Wang, Center for Basic Research and Innovation of Medicine and Pharmacy (MOE), School of Pharmacy, Naval Medical University, Shanghai 200433, China. Phone: 86.21.81871203; Email: pwang@smmu.edu.cn.
Authorship note: QC, JL, GH, and SYW contributed equally to this work and are co–first authors.
Find articles by Sheng, C. in: PubMed | Google Scholar
1Center for Basic Research and Innovation of Medicine and Pharmacy (MOE), School of Pharmacy, Naval Medical University, Shanghai, China.
2Department of Hepatic Surgery, Eastern Hepatobiliary Surgery Hospital, Naval Medical University, Shanghai, China.
3Department of Urology, Baoshan Renhe Hospital, Shanghai University, Shanghai, China.
4Department of Pharmacy, Shanghai Tenth People’s Hospital, School of Medicine, Tongji University, Shanghai, China.
Address correspondence to: Pei Wang, Center for Basic Research and Innovation of Medicine and Pharmacy (MOE), School of Pharmacy, Naval Medical University, Shanghai 200433, China. Phone: 86.21.81871203; Email: pwang@smmu.edu.cn.
Authorship note: QC, JL, GH, and SYW contributed equally to this work and are co–first authors.
Find articles by Shen, F. in: PubMed | Google Scholar
1Center for Basic Research and Innovation of Medicine and Pharmacy (MOE), School of Pharmacy, Naval Medical University, Shanghai, China.
2Department of Hepatic Surgery, Eastern Hepatobiliary Surgery Hospital, Naval Medical University, Shanghai, China.
3Department of Urology, Baoshan Renhe Hospital, Shanghai University, Shanghai, China.
4Department of Pharmacy, Shanghai Tenth People’s Hospital, School of Medicine, Tongji University, Shanghai, China.
Address correspondence to: Pei Wang, Center for Basic Research and Innovation of Medicine and Pharmacy (MOE), School of Pharmacy, Naval Medical University, Shanghai 200433, China. Phone: 86.21.81871203; Email: pwang@smmu.edu.cn.
Authorship note: QC, JL, GH, and SYW contributed equally to this work and are co–first authors.
Find articles by Li, D. in: PubMed | Google Scholar
1Center for Basic Research and Innovation of Medicine and Pharmacy (MOE), School of Pharmacy, Naval Medical University, Shanghai, China.
2Department of Hepatic Surgery, Eastern Hepatobiliary Surgery Hospital, Naval Medical University, Shanghai, China.
3Department of Urology, Baoshan Renhe Hospital, Shanghai University, Shanghai, China.
4Department of Pharmacy, Shanghai Tenth People’s Hospital, School of Medicine, Tongji University, Shanghai, China.
Address correspondence to: Pei Wang, Center for Basic Research and Innovation of Medicine and Pharmacy (MOE), School of Pharmacy, Naval Medical University, Shanghai 200433, China. Phone: 86.21.81871203; Email: pwang@smmu.edu.cn.
Authorship note: QC, JL, GH, and SYW contributed equally to this work and are co–first authors.
Find articles by
Wang, P.
in:
PubMed
|
Google Scholar
|

Published February 17, 2026 - More info
J Clin Invest. 2026;136(8):e198076. https://doi.org/10.1172/JCI198076.
© 2026 Cao et al. This work is licensed under the Creative Commons Attribution 4.0 International License. To view a copy of this license, visit http://creativecommons.org/licenses/by/4.0/.
Received: July 18, 2025; Accepted: February 10, 2026

Related article:
Abstract
Skeletal muscle has the impressive capacity to completely regenerate even after relatively severe injuries in young individuals, but this process is dysregulated in multiple cell types in the microenvironment in numerous diseases and aging. In this issue of the JCI, Cao et al., using an elegant set of genetic mouse models and pharmacological approaches, demonstrated that gasdermin E (GSDME) was required in myeloid cells after sterile muscle injury to normally regenerate muscle and that downstream IL-18 release prevented intramuscular ectopic fat deposition. GSDME expression was reduced in human muscles from aged individuals, and Gsdme was increased after muscle injury in young, but not old, mice. The ability of IL-18 to partially improve regeneration in aged GSDME-knockout mice demonstrates the potential clinical relevance of this finding in dysregulated muscle regeneration associated with aging.
Authors
Swathy Krishna, Jill A. Rafael-Fortney

-
Results
GSDME contributes to skeletal muscle injury and is required for muscle regeneration. To investigate the potential role of gasdermin family proteins in skeletal muscle during surgical stress, we analyzed rectus abdominis muscle samples obtained from 5 patients who required reoperation 5–8 days following initial biliary surgery due to bile leakage. Importantly, all cases involved only mild, localized leakage without abdominal wall infiltration, thereby ensuring that the collected muscle tissue was unaffected by the pathological process. Control samples comprised rectus abdominis muscle samples from 5 patients during initial biliary surgery, with all control tissues histologically normal. Among all gasdermin family members, GSDME mRNA showed the most pronounced upregulation in skeletal muscle (Figure 1, A and B). Based on this, we employed a cardiotoxin-induced (CTX-induced) muscle injury mouse model to study GSDME’s role. At day 4 (D4) after injury, H&E and succinate dehydrogenase (SDH) staining confirmed severe muscle damage (Supplemental Figure 1A; supplemental material available online with this article; https://doi.org/10.1172/JCI198076DS1), and electron microscopy revealed numerous cells undergoing membrane rupture near injured fibers (Figure 1C). Among gasdermin family members, Gsdme was the most upregulated in injured muscle (Figure 1D), with marked cleavage of GSDME protein and upstream caspase-3 (Figure 1E). Flow cytometry showed a substantial increase in CD45+ leukocytes (~10% to ~45%) and CD11b+ myeloid cells (6.4%–34.8%) in injured muscle (Supplemental Figure 1, B and C). IL-18 expression was elevated accordingly (Supplemental Figure 1D). O2K metabolic assay demonstrated reduced oxygen consumption in injured muscle (Supplemental Figure 1E). Bulk RNA-seq revealed upregulated genes enriched in inflammasome signaling, cytokine production, and leukocyte migration, while downregulated genes were related to muscle function and oxidative phosphorylation (Supplemental Figure 1, F and G). These data suggest a potential association between GSDME and skeletal muscle injury.
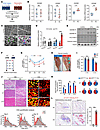 Figure 1
GSDME is activated in injured skeletal muscle, while its KO hinders tissue recovery by inducing dysmetabolism and fatty accumulation. (A) Scheme of GSDME analysis in rectus abdominis during surgical stress, comparing reoperation cases (5–8 days after initial biliary surgery for bile leakage, n = 5) with controls (initial biliary surgery, n = 5); all samples were histologically normal and unaffected by pathology. (B) Transcriptomic expression of gasdermin family members (GSDMB, GSDMC, GSDMD, and GSDME) in initial surgery (IS) versus reoperation (Ro) groups. (C) Transmission electron microscopy of CTX-injured skeletal muscle showing membrane pores and release of intracellular contents. Pink arrows: pore formation; blue arrows: released intracellular organelles; green arrows: cellular debris within the intercellular spaces of damaged muscle fibers. Scale bars: 2 mm (lower magnification), 0.5 mm (higher magnification). (D) Evaluation of gasdermin family members (Gsdmb, Gsdmc, Gsdmd, and Gsdme) in CTX-injured muscle of mice. (E) Evaluation of the cleavage of GSDME proteins in CTX-injured muscle of mice. (F) Experimental design for the CTX-induced muscle injury model and functional recovery in WT and GSDME-KO mice. (G) Gastrocnemius (Gast) weight/body weight ratio in WT and KO mice at D4, D7, and D14 after injury. Data are shown as the mean ± SD with n = 6 (from 6 WT independent mice) and n = 6 (from 6 Gsdme-KO independent mice). (H) Representative images of injured gastrocnemius in WT and KO mice. Cyan arrows indicate fatty degeneration. (I) Gastrocnemius strength at baseline (0 min) and 5 min later (5 min). (J) Representative images and quantification of CSA of myofibers stained with H&E. Scale bars: 100 μm. (K) Total ATP production and proportions of ATP produced via OXPHOS and glycolysis were calculated. (L) Representative images of Oil Red O staining and quantification of lipid accumulation. Scale bars, original images: 500 μm; enlargements: 200 μm. For B, D, and L, by unpaired 2-tailed Student’s t test; for G, I, and K, by 2-way ANOVA with Tukey’s post hoc test. Data are presented as mean ± SEM. *P < 0.05, **P < 0.01, ***P < 0.001.
We then examined muscle repair in Gsdme global KO (Supplemental Figure 2, A and B) and WT mice at 3 postinjury time points (D4, D7, and D14; Figure 1F). By D14, WT controls had achieved complete recovery, while KO mice continued to show multiple pathological manifestations, including reduced gastrocnemius muscle mass normalized to body weight (Figure 1G), substantial lipid accumulation in injured muscle tissue (Figure 1H), and compromised grip strength (Figure 1I). To evaluate muscle regeneration, we performed H&E staining and quantitative analysis of myofiber cross-sectional area (CSA). Histological examination revealed more severe tissue disruption in GSDME-KO mice compared with WT controls (Figure 1J). This observation was further supported by CSA quantification using the Cellpose algorithm for cellular segmentation (21), which demonstrated a significantly reduced myofiber size in GSDME-KO mice following CTX-induced injury (Figure 1J), indicating impaired regenerative capacity in the absence of GSDME. KO mice also showed diminished running distance, time, and maximum speed at D14 (Supplemental Figure 2C). Immunostaining for SDH revealed fewer SDH+ fibers in KO muscle (Supplemental Figure 2D). Analysis of myosin heavy chain (MyHC) fiber types showed a consistent decrease in the ratio of oxidative type-IIa to glycolytic type-IIb fibers across time points (Supplemental Figure 2E), suggesting metabolic alterations. Seahorse assays demonstrated reduced oxygen consumption rate (OCR) and total ATP content, especially ATP from oxidative phosphorylation, in KO muscle (Supplemental Figure 2F). These findings were confirmed by luminescent ATP assays (Figure 1K). Oil Red O and perilipin-1 staining indicated increased fatty replacement in KO muscle (Figure 1L and Supplemental Figure 2G). MuSCs, marked by Pax7, are the principal cellular source for myofiber regeneration following injury. Notably, flow cytometry revealed comparable Pax7+ MuSC frequencies in uninjured (D0) WT and KO mice, with both genotypes exhibiting expected activation at D4 after CTX injury but no intergenotype difference (Supplemental Figure 2H), and qPCR analysis of Pax7, Pax3, and Myf5 showed unchanged expression between genotypes at D0 and equivalent upregulation at D4 (Supplemental Figure 2I), suggesting that the impaired regeneration observed in KO mice is unlikely due to early MuSCs activation defects. Collectively, these results demonstrate that GSDME deficiency markedly impairs skeletal muscle repair process, potentially due to disrupted metabolic homeostasis and lipid accumulation.
Bulk RNA-seq and lipidomics confirm GSDME loss-driven myosteatosis. To validate the association between impaired skeletal muscle repair and intramuscular lipid accumulation, we performed a time-series bulk RNA-seq analysis on CTX-injured skeletal muscles from WT and GSDME-KO mice at D4, D7, and D14 after injury (Figure 2A). Principal component analysis revealed distinct transcriptomic profiles across time points and genotypes (Figure 2B). Differentially expressed genes between KO and WT muscles are shown in Figure 2C and detailed in Supplemental Table 1. Using the Mfuzz algorithm, we identified 6 dynamic transcriptional clusters (clusters 1–5 and cluster 7) with similar temporal expression patterns in both groups, except for cluster 6, which displayed a distinct gene signature (Figure 2D and Supplemental Figure 3). Gene network analysis showed that cluster 6 encompassed regenerative processes in WT muscle, including myogenesis and anabolic metabolism, whereas in KO muscle, it was associated with adipogenic and lipid-remodeling pathways (Figure 2E). In KO muscle, adipogenic features emerged as early as D4 but subsided at D7, indicating an early, transient enrichment of adipogenic-associated transcriptional features in the context of sustained inflammatory signatures. By D14, these signatures became prominent and coincided with overt lipid accumulation (Figure 2, D and E). Thus, these findings support that GSDME deficiency induces myosteatosis during the late phase of muscle regeneration.
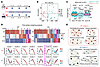 Figure 2
Time-series transcriptome analysis reveals that Gsdme deficiency enhances intramuscular adipogenesis. (A) Experimental design for time-series RNA-seq analyses of injured skeletal muscle tissue from WT and GSDME-KO mice with CTX-induced muscle injury at 3 postinjury time points (n = 3 per group at each time point). (B) Principal component analysis of transcriptome profiles in injured muscle of WT and KO mice. (C) Differentially expressed genes (DEGs) between injured muscle tissues of WT and KO mice at each time point. Cyan, adjusted P < 0.05; red, adjusted P < 0.01. (D) Time-series clustering analysis of transcriptomes using the Mfuzz algorithm in R. Cluster 6 gene signature (pink boxes) represents the most significant difference between WT and KO mice. (E) GO enrichment analysis demonstrating enriched signaling pathways in cluster 6 gene signatures of WT and KO mice.
To further understand the accumulated lipid species caused by GSDME deficiency, we performed a mass spectrometry–based untargeted lipidomic analysis (Figure 3A). The lipidomic data showed good separation and robust modeling (Figure 3B). Among lipid species identified, TAGs, phosphatidylcholine (PC), and phosphatidylethanolamine were the most abundant (Figure 3C). In KO muscle, 726 lipid species were upregulated, while 295 were downregulated (Figure 3D). KEGG pathway analysis indicated that the upregulated lipid species were primarily involved in lipid metabolism and fat digestion/absorption, whereas the downregulated lipid species were linked to linolenic acid and arachidonic acid metabolism (Figure 3E). Notably, TAG, PC, sulfur hexosylceramide hydroxy fatty acid (SHexCer), and hexosylceramide/non-hydroxy fatty acid-dihydrosphingosine (HC/NDS) were the most prominently upregulated lipid species in KO mice (Figure 3F). Saturated TAG levels were comparable between WT and KO mice, but levels of mono-, di-, and triunsaturated TAGs were significantly higher in KO muscle (Figure 3G). Among PC species, short-chain PCs showed no significant difference between WT and KO mice (Supplemental Figure 4A), whereas long-chain TAGs were significantly elevated in KO muscle (Figure 3H). The specific species of enhanced SHexCer and HC/NDS are detailed in Supplemental Figure 4, B and C. These lipidomic results confirm that GSDME deficiency exacerbates myosteatosis during the skeletal muscle regeneration from injury.
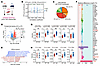 Figure 3
Lipidomics reveals increased intramuscular TAG enrichment in the absence of Gsdme. (A) Experimental design for untargeted lipidomics analysis using ultraperformance liquid chromatography–mass spectrometry in injured muscle of WT and KO mice at D14. (B) OPLS score plots assessing robustness of the mass spectrometry–based lipidomics model. (C) Lipid species identified in injured muscle of WT and KO mice: TAGs, PC, and phosphatidylethanolamine (PE). (D) Volcano plot showing the upregulated and downregulated lipid species in KO mouse muscle versus WT muscle. (E) KEGG pathway analysis of lipid-associated functions based on differential lipid species between WT and KO injured muscle; upregulated species are in red, and downregulated species are in blue. (F) Heatmap of differential lipid species in injured skeletal muscle from WT and KO mice. (G) Levels of saturated and unsaturated fatty acids in TAG species. (H) TAG levels of long-chain fatty acids with 47, 48, 49, 50, and 51 carbon atoms. Data are presented as mean ± SEM and were analyzed by unpaired 2-tailed Student’s t test. *P < 0.05, **P < 0.01.
scRNA-seq uncovers immune–stromal reprogramming in GSDME-KO muscle. To illustrate the changes in cell status and molecular events within the injured and regenerated muscle, we used 10x Genomics scRNA-seq to study the injured muscle tissue (Supplemental Figure 5A). After quality control, 13,432 cells from the injured skeletal muscles of WT and KO mice were sequenced and clustered into endothelial cells, FAPs, macrophages, monocytes, MuSCs, Schwann cells, T cells, B cells, mature skeletal muscle, and pericytes (Figure 4A and Supplemental Figure 5, B and C). KO mice had a higher proportion of FAPs and macrophages (Figure 4B). When comparing the outgoing and incoming signals of each cell population in WT and KO mice, we found that FAPs and macrophages were the major signaling sources, and further analysis revealed a significantly strengthened FAP–macrophage interaction in KO mice (Figure 4, C and D). Enhanced IL-6, TRAIL, PAR, and TNF signaling pathways were present in KO muscle (Supplemental Figure 5D). Ligand-receptor analysis showed loss of Mif- and Lgals9-mediated interactions and induction of chemokine-, Tgfb-, and Tnf-mediated interactions in KO mice (Figure 4E).
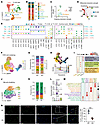 Figure 4
scRNA-seq reveals a coordinated regulation of GSDME in intramuscular TRMs and FAPs. (A) scRNA-seq UMAP plot showing clustering of endothelial cells, FAPs, macrophages, monocytes, MuSCs, Schwann cells, T cells, B cells, skeletal muscle (mature), and pericytes in the injured skeletal muscle tissue of WT and KO mice at D14. (B) Proportions of each cell cluster in injured skeletal muscle of WT and KO mice. (C) Analysis of incoming and outgoing interaction strength between the cell types in a 2-dimensional graph using the CellChat algorithm in R. (D) Circle plot showing the strength of ligand-receptor interactions between pairwise cell populations among the major cell populations in WT and KO groups. (E) Differences in ligand-receptor pairs among these cell types between WT and KO mice. (F) UMAP plot of FAP subgroups. (G) Proportions of each subcluster of FAPs in injured skeletal muscle of WT and KO mice. (H) Trajectory analysis of FAP differentiation according to pseudotime algorithms in injured skeletal muscle of WT and KO mice. (I) GO enrichment analysis of 3 crucial FAP subclusters between WT and KO muscle. (J) UMAP plot of macrophage subgroups. (K) Proportions of each subcluster of macrophages in injured skeletal muscle of WT and KO mice. (L) Expression of TRM and infiltrating macrophage marker genes across the 4 macrophage subclusters. (M) GO enrichment analysis showing the major biological functions enriched in the 4 subgroups of macrophages. (N) Multiplex IHC showing the proportion of Lyve1+CD11b+ macrophages within the total CD11b+ macrophage population in injured muscle (white arrows). Nuclei were stained with DAPI. Scale bars: 100 μm (lower magnification, 50 μm (higher magnification). Data are presented as mean ± SEM and were analyzed by unpaired 2-tailed Student’s t test. ***P < 0.001.
As the regulation of macrophages on clearance of FAPs is an essential event for correct muscle repair, we further subgrouped FAPs and macrophages to detect their transcriptional changes. Seven FAP subgroups (Figure 4F and Supplemental Figure 5E) were identified: FAPs-0 (Hsd11b1+Mme+Enpp2+), FAPs-1 (Ccl7+Ifi205+Fgl2+), FAPs-2 (Fmod+Wif1+Comp+), FAPs-3 (Sfrp1+Sfrp4+C2+), FAPs-4 (Pi16+Dpp4+Efemp1+), FAPs-5 (Thbs4+Tnmd+Chodl+), and FAPs-6 (Clu+Cpe+Myoc+). According to the marker genes, FAPs-0 showed a high adipogenic differentiation trend (22–24), while FAPs-2 were fibroblast like (25, 26). Notably, KO mice had a higher proportion of adipogenic FAPs-0 but fewer fibroblast-like FAPs-2 (Figure 4G). Trajectory analysis suggested that Pi16+Dpp4+ FAPs-4 might be the original state FAPs (27), while FAPs-2 were in a terminal state (Figure 4H and Supplemental Figure 5F). Gene Ontology (GO) enrichment analysis confirmed that FAPs-0 and FAPs-2 were involved in fat differentiation and wound healing, respectively (Figure 4I). The altered composition of FAP subgroups in KO mice indicates that Gsdme deletion drives adipogenic differentiation of FAPs.
Macrophages were subclustered into 4 groups (Figure 4J and Supplemental Figure 5G): Mφ-0 (Ccl7+Tnf+Ccl2+), Mφ-1 (Lyve1+Cd163+Txnip+), Mφ-2 (Trem2+Clec4d+Gpnmb+), and Mφ-3 (Ccr2+Ltb4r1+Nlrp3+). KO mice had increased Mφ-0 and decreased Mφ-1 compared with WT mice (Figure 4K). Mφ-0 seemed to be a group of high proinflammatory macrophages. Mφ-1, characterized by Lyve1, Cd163, and Txnip expression, were categorized as TRMs with high expansion capacity (28–31). Mφ-2 may be a group of lipid-sensing macrophage (32, 33). Mφ-3, marked by predominant Ccr2 expression, were likely to be a group of macrophages derived from recruited monocytes (Figure 4L) (28–30). Pseudotime trajectory analysis suggested that Mφ-1 were in an independent terminal state distinct from Mφ-0, Mφ-2, and Mφ-3 (Supplemental Figure 5H), further supporting the unique gene signature of TRMs of Mφ-1. In line with these results, GO enrichment analysis revealed Mφ-1 was enriched in pathways related to tissue healing and skeletal muscle development, whereas Mφ-0, Mφ-2, and Mφ-3 were associated with inflammatory response and leukocyte migration (Figure 4M). Moreover, Mφ-3 was associated with regulation of cell death (Figure 4M). A prominently elevated expression level of transcription factors (TFs) such as Jun, Klf, Fos, and Egr1 was noted in Mφ-1 (Supplemental Figure 5I). Multiplex IHC staining revealed abundant LYVE1+CD11b+ TRMs within the injured tissue, whereas their presence was substantially diminished in KO mice (Figure 4N).
MuSCs were subclustered into 2 groups: Mu-0 (Tpm3-rs7+Ndufa5+Cox7b+) and Mu-1 (Id3+Cebpd+Nfkbiz+) (Supplemental Figure 5, J and K). WT mice had more Mu-0, which is involved in cellular respiration and oxidative phosphorylation (OXPHOS), whereas KO mice had more Mu-1, which is associated with the negative regulation of phosphate and phosphorus metabolic processes (Supplemental Figure 5L). Deletion of GSDME did not significantly impact the status of endothelial cells (Supplemental Figure 5, M–O).
All these findings indicate that GSDME may coordinately regulate immune–stromal reprogramming during muscle regeneration.
GSDME in macrophages, but not FAPs, is essential for skeletal muscle regeneration. To determine the functional relevance of GSDME in specific cell types during muscle regeneration, we analyzed its expression pattern across the major cells in muscle via our scRNA-seq data. We found Gsdme was preferentially expressed in FAPs and macrophages but showed low expression in MuSCs and endothelial cells (Supplemental Figure 6A). Flow cytometry analysis of GSDME protein levels confirmed this cell type–specific expression pattern, showing significantly elevated mean fluorescence intensity specifically in FAP and macrophage populations (Supplemental Figure 6B). Since scRNA-seq demonstrated GSDME’s dual regulation of FAP differentiation and macrophage reprogramming during muscle repair, we subsequently sought to determine the principal cell type responsible for GSDME’s essential role in skeletal muscle repair.
A mouse strain (GsdmeStop/Stop; Supplemental Figure 6C) described in our previous work (18, 19, 34) carrying a transcriptional STOP cassette (3×SV40-PolyA) flanked by loxP sites (loxP-Stop-loxP) upstream of the ATG start codon of the Gsdme gene was crossed with Pdgfra-Cre or Lysm-Cre mice to generate GsdmeS/S Pdgfra-Cre (referred to as GsdmeS/S-FR) or GsdmeS/S Lysm-Cre mice (referred to as GsdmeS/S-MR) mice, respectively. This strain enabled tissue-specific reactivation of Gsdme in FAPs or myeloid cells under a systemic Gsdme-deficient background (Supplemental Figure 6D), as confirmed by qPCR and immunoblotting (Supplemental Figure 6, E and F). WT (GsdmeWT/WT), GsdmeS/S, GsdmeS/S-FR, and GsdmeS/S-MR mice were subjected to CTX-induced skeletal muscle injury. Similar to GSDME-KO mice, GsdmeS/S and GsdmeS/S-FR mice showed significantly reduced gastrocnemius weight, while GsdmeS/S-MR mice had comparable weight as WT mice (Figure 5A). GsdmeS/S and GsdmeS/S-FR mice exhibited obvious fatty replacement in injured muscle (Figure 5B) and compromised running performance (Figure 5C), unlike GsdmeS/S-MR mice (Figure 5, B and C). Similar results were found in H&E staining/CSA analysis (Figure 5D), SDH staining (Figure 5E), and type-IIa/type-IIb myofiber ratio (Figure 5F). The number of CD45+ leukocytes increased in GsdmeS/S and GsdmeS/S-FR mice, but to a lesser extent in GsdmeS/S-MR mice (Figure 5G).
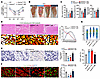 Figure 5
GSDME in recruited macrophages, but not in FAPs, is essential for skeletal muscle repair. (A) The gastrocnemius (Gast) weight/body weight ratio in WT (GsdmeWT/WT), GsdmeS/S (GsdmeStop/Stop), GsdmeS/S-FR (GsdmeStop/Stop Pdgfra-Cre), and GsdmeS/S-MR (GsdmeStop/Stop Lysm-Cre) mice at D4, D7, and D14 after injury. (B) Representative morphology of injured muscle of WT, GsdmeS/S, GsdmeS/S-FR, and GsdmeS/S-MR mice at D14 after injury. (C) Exercise performance of WT, GsdmeS/S, GsdmeS/S-FR, and GsdmeS/S-MR mice at D14 after injury. (D) Representative H&E staining and quantitative CSA analysis of injured muscle from WT, GsdmeS/S, GsdmeS/S-FR, and GsdmeS/S-MR mice at D14 after injury. Scale bars: 100 �m. (E) Representative SDH staining and quantitative analysis of injured muscle from WT, GsdmeS/S, GsdmeS/S-FR, and GsdmeS/S-MR at D14 after injury. Scale bars: 100 �m. (F) Representative immunofluorescence images of MyHC type-IIa and MyHC type-IIb fibers in injured muscle of WT, GsdmeS/S, GsdmeS/S-FR, and GsdmeS/S-MR at D14 after injury. Scale bars: 100 �m. (G) Proportion of CD45+ cells in injured muscle of WT, GsdmeS/S, GsdmeS/S-FR, and GsdmeS/S-MR at D14 after injury determined by flow cytometry. Data are presented as the mean ± SEM and were analyzed by 1-way ANOVA with Tukey’s post hoc tests. **P < 0.01.
We next asked whether these impairments were associated with altered cellular metabolism and myeloid cell kinetics. Seahorse metabolic analysis showed lower OCR curves in muscle samples from GsdmeS/S and GsdmeS/S-FR mice, but not in GsdmeS/S-MR mice, compared with WT mice (Figure 6A). Time-sequential changes of Ly6C+ monocytes and LYVE1+ macrophages in injured muscle showed that the rapid peaking of infiltrating Ly6C+ monocytes and the persistent presence of LYVE1+ macrophages in WT mice were absent in GsdmeS/S and GsdmeS/S-FR mice but restored in GsdmeS/S-MR mice (Figure 6B). Total ATP content and the proportion of ATP produced by OXPHOS or glycolysis displayed similar changes (Figure 6, C and D). These findings suggest that GSDME in macrophages, but not FAPs, regulates skeletal muscle repair.
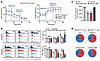 Figure 6
Gsdme regulates metabolic remodeling and macrophage polarization during muscle repair. (A) Analysis of the metabolic profile of injured skeletal muscle tissue of WT, GsdmeS/S, GsdmeS/S-FR, and GsdmeS/S-MR at D14 after injury using Seahorse technology. The curves for OCR and ECAR are presented. (B) Time-series analyses of proportions of Ly6C+ or LYVE1+ macrophages within the CD11b+ macrophages/monocytes of injured skeletal muscle tissue. (C and D) Total ATP production and the proportions of ATP produced via 2 distinct manners (OXPHOS and glycolysis) of injured skeletal muscle tissue. Data are presented as the mean ± SEM and were analyzed by 1-way ANOVA with Tukey’s post hoc tests. *P < 0.05, **P < 0.01.
To delineate the cellular basis of pyroptosis, we investigated whether TRMs or recruited macrophages represent the predominant population undergoing this process during muscle repair. Analysis of our scRNA-seq dataset revealed selective enrichment of Gsdme and its downstream effectors (Il18 and Il1β) in the Mφ-3 subset (CCR2+ recruited macrophages), but not in Mφ-0 (Lyve1+ TRMs), suggesting a preferential propensity toward GSDME-mediated pyroptotic activation in recruited macrophages (Supplemental Figure 6G). To validate this, we isolated CD11b+CCR2+ (recruited) and CD11b+CCR2– (nonrecruited/TRMs) macrophages from injured muscles at D14 after injury using FACS (Supplemental Figure 6H). Flow cytometry analysis revealed significantly higher expression of pyroptosis-associated molecules, including GSDME, IL-18, and IL-1β, in recruited CD11b+CCR2+ monocyte-derived macrophages compared with CD11b+CCR2– cells (Supplemental Figure 6I).
To further functionally assess their role in driving the GSDME–IL-18 axis, we employed the CCR2/5 dual antagonist cenicriviroc (CVC) to block monocyte recruitment. CVC treatment in normal mice for 2 consecutive weeks (Supplemental Figure 7A) did not exert direct cytotoxic effects on monocytes (Supplemental Figure 7B), consistent with previous findings (35). Upon muscle injury (Supplemental Figure 7C), CVC administration significantly reduced the infiltration of CCR2+ monocytes into injured muscle (Supplemental Figure 7D) and concomitantly increased circulating monocyte proportions (Supplemental Figure 7E), indicating impaired tissue recruitment. Moreover, CVC treatment resulted in significantly lower expression of GSDME and IL-18 in injured muscle, as shown by flow cytometry (Supplemental Figure 7F), and reduced IL-18 concentrations confirmed by ELISA (Supplemental Figure 7G). Importantly, blockade of CCR2+ monocyte recruitment prevented the expansion of the Lyve1+ TRM pool (Supplemental Figure 7H), accompanied by marked impairment in muscle functional recovery, as evidenced by reduced voluntary wheel running activity (Supplemental Figure 7I). Together, these data indicate that recruited CCR2+ monocyte–derived macrophages are functionally required for activation of the GSDME–IL-18 pathway, thereby playing a critical role in supporting effective muscle regeneration.
GSDME deletion impairs TRM expansion dynamics. To scrutinize the characteristics of immune cells at the protein level in the injured muscle, we collected 1,481,156 CD45+ leukocytes from injured skeletal muscle of WT and KO mice at D4, D7, and D14 and further analyzed them using multiplex flow cytometry with antibodies against F4/80, CD64, CD11b, Ly6C, LYVE1, and CCR2, as well as using the nonlinear dimensionality reduction algorithm (Figure 7A and Supplemental Figure 8A). Using UMAP-guided unbiased gating, they were clustered into 6 groups (LYVE1+ TRMs, CCR2+ macrophages, LYVE1–CCR2– macrophages, DCs, Ly6C+ monocytes, and Ly6C– monocytes) (Figure 7B) as described in our recent work (20). Multi–time point analysis (D4, D7, and D14) revealed the dynamic evolution of the immune landscape and the impact of GSDME deficiency after injury (Figure 7C). In WT mice, TRMs exhibited a progressive expansion from D4 to D14, which was markedly suppressed in KO mice at D7–D14 (region 1). Moreover, the proportion of Ly6Chi monocytes in KO mice was consistently higher than that in WT mice across all 3 postinjury time points (region 2) (Figure 7C). Together, these results suggest that the disrupted expansion of TRMs, accompanied by persistent Ly6Chi monocyte accumulation, reflects a failure of inflammatory resolution in KO mice after injury.
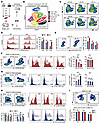 Figure 7
GSDME controls the recruitment and expansion of intramuscular immune cells, especially TRMs. (A) Experimental design for flow cytometry analysis of injured gastrocnemius muscles from WT and KO mice at D4, D7, and D14. Muscle tissues were digested into single-cell suspensions, and CD45+ cells were isolated using magnetic activated cell sorting. (B) High-dimensional analysis of multiplexed flow cytometry using an unbiased nonlinear dimensionality reduction algorithm to identify the immune cell populations in injured skeletal muscle of WT and KO mice. A total of 1,481,156 CD45+ leukocytes from injured muscle of WT and KO mice at D4, D7, and D14 after injury were analyzed. The mice at different days after injury were arranged to undergo euthanasia simultaneously to avoid batch effect. Full spectral panels and key antibodies are shown in Supplemental Figure 8A. (C) A UMAP visualization of dynamic changes in intramuscular immune cell populations between WT and KO mice at D4, D7, and D14 after injury. The regions with obvious differences between WT and KO mice are indicated with hollow elliptical shapes. (D) Time-series analyses of CD45+ leukocytes within the total cell population of injured skeletal muscle using flow cytometry with manual gating. (E) Time-series analyses of F4/80+CD64+ macrophages within the CD45+ leukocytes of injured skeletal muscle. (F and G) Time-series analyses of proportions of CCR2+Ly6C+ monocytes (F) and CCR2–LYVE1+ macrophages (G) within the CD11b+ myeloid of injured skeletal muscle. (H) Time-series analyses of proportions of CD86+ and CD163+ cells within the macrophages of injured skeletal muscle tissue. (I) The proportion of cDC2 within total DC (CD11c+MHC-II+) population of injured skeletal muscle. Data are presented as mean ± SEM. For D, E, H, and I, by unpaired 2-tailed Student’s t test; for F and G, by 2-way ANOVA with Tukey’s post hoc test. *P < 0.05, **P < 0.01, ***P < 0.001.
We further evaluated the changes in immune cells using manual gating (gating strategy in Supplemental Figure 8B). It was shown that CD45+ leukocytes infiltration peaked at D4 and subsided by D14 in WT mice. In contrast, KO mice exhibited a failure to resolve inflammation, resulting in sustained leukocytes infiltration at D14 (Figure 7D). The number of CD64+F4/80+ macrophages was consistently higher in GSDME-KO mice than in WT mice across D4, D7, and D14 after injury (Figure 7E). Based on the flow cytometry gating strategy, subsequent analysis of Ly6C expression within the monocyte population and LYVE1 staining within the macrophage subset revealed that the decline of CCR2+Ly6C+ monocytes (Figure 7F) and the increase of CCR2–LYVE1+ macrophages (Figure 7G) were significantly inhibited in KO mice. Notably, this defective expansion of LYVE1+ TRMs persisted through the late regeneration phase and remained significantly impaired in KO mice even at D21 after injury (Supplemental Figure 8, C and D). Macrophages in GSDME-KO mice were skewed toward a proinflammatory phenotype, as evidenced by sustained high CD86 and low CD163 expression from D4 to D14 (Figure 7H). Meanwhile, cDC2 numbers remained unchanged across genotypes (Figure 7I), suggesting that the impaired regeneration is unlikely due to DC–mediated antigen presentation disturbances. Taken together, these findings suggest that GSDME deficiency disrupts the expansion of LYVE1+ TRMs by impairing the inflammatory niche shaped by recruited macrophages during muscle regeneration.
GSDME–IL-18 axis activates KLF4/JUN to maintain TRMs. Given the established role of GSDME-mediated pyroptosis in releasing IL-1β and IL-18 (Figure 8A), we sought to determine whether these cytokines contribute to muscle rehabilitation. Neutralizing IL-18, but not IL-1β, induced fatty replacement in the injured muscle (Figure 8B), as confirmed by gastrocnemius weight (Supplemental Figure 9A) and running performance test (Figure 8C and Supplemental Figure 9B). Blocking IL-18 potently inhibited the expansion of TRMs after injury (Figure 8D). CSA analysis, SDH staining, and fiber ratio experiments (Supplemental Figure 9, C and E) showed similar results. Thus, IL-18, but not IL-1β, drives muscle repair via TRM regulation.
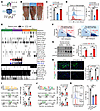 Figure 8
Regulation of GSDME on TRMs relies on IL-18–induced transcriptional regulators KLF4 and JUN. (A) Schematic model of GSDME-mediated pyroptosis. (B) Representative images of CTX-injured gastrocnemius muscle treated with neutralizing antibodies against IL-1β, IL-18, or control IgG. (C) Exercise performance of CTX-injured mice treated with anti–IL-1β, anti–IL-18, or IgG. (D) Expression levels of LYVE1+ macrophages in injured muscle were determined by flow cytometry. (E) SCENIC analysis of TF regulons in 4 macrophage subclusters, showing on/off status and number of target genes. Klf4 and Jun regulons are selectively activated in TRMs (Mφ-1). (F) The numbers of macrophages with “on” status of Klf4 and Jun regulons in all macrophages. (G) Nuclear protein levels of KLF4 and JUN in injured muscle from CTX+IgG and CTX+IL-18 mice. (H) Immunofluorescence of KLF4 and JUN in injured muscle sections from CTX+IgG or CTX+anti–IL-18 mice; colocalization with DAPI+ nuclei was quantified. Scale bars: 100 �m. (I and J) The binding of KLF4 and JUN to the promoters of Lyve1 and Cd163 was confirmed by ChIP-qPCR in injured muscle tissue from WT and KO mice. (K) The proportions of LYVE1+ macrophages in total CD11b+ myeloids isolated from the muscle of CTX-injured mice treated with the KLF4 inhibitor kenpaullone or the JUN inhibitor T5224. Data are presented as mean ± SEM. For C, D, and K, by 1-way ANOVA with Tukey’s post hoc test; for I and J, by 2-way ANOVA with Tukey’s post hoc test; for G and H, by unpaired 2-tailed Student’s t test. **P < 0.01.
To identify TFs for TRMs maintenance, we used Single-Cell Regulatory Network Inference and Clustering (SCENIC) (36) and found KLF4 and JUN to be 2 key TFs in Lyve1+Cd163+Txnip+ Mφ-1 (Figure 8E). At the transcriptional level, Klf4 and Jun were primarily coexpressed in Mφ-1 (Supplemental Figure 9F). According to the SCENIC analysis of regulons within Mφ-1, there were 33 target genes specific to KLF4 and 68 target genes specific to JUN (Figure 8E). Additionally, 25 target genes overlapped between KLF4 and JUN targets (Supplemental Figure 9G). Among these, we found Lyve1, Folr2, and Cd163, 3 core marker genes for TRMs across organs (28, 29). Furthermore, based on the expression patterns observed in the UMAP visualization of macrophages in our scRNA-seq data, Txnip, Ier2, Fcna, Cbx4, Fos, Egr1, Klf2, Irf1, and C4b were predominantly expressed in Mφ-1, indicating they may serve as potential regulators of skeletal muscle TRMs (Supplemental Figure 9H). AUCell (36) was used to assess the activity of these regulons at the single-cell level, showing that approximately 17% and approximately 23% of macrophages displayed “on” status in KLF4 and JUN activity (Figure 8F). In support of these findings, IL-18 treatment increased nuclear KLF4 and JUN protein levels in macrophages isolated from injured muscle by FACS (Figure 8G), while neutralizing IL-18 reduced their levels (Supplemental Figure 9I). Immunofluorescence showed that neutralizing IL-18 inhibited nuclear KLF4 and JUN expression in injured muscle (Figure 8H). ChIP-qPCR confirmed KLF4 and JUN binding to the Lyve1 and Cd163 promoter area (5′ flanking regions from –1,000 to +100), which was reduced in KO mice (Figure 8, I and J). KLF4 inhibitor kenpaullone and JUN inhibitor T5224 reduced LYVE1+ cells in injured muscle (Figure 8K). These results highlight KLF4 and JUN as 2 crucial drivers of TRMs during muscle repair in response to IL-18.
IL-18 treatment restores regeneration in aged muscle with impaired GSDME signaling. Aging is associated with impaired skeletal muscle regeneration. To investigate whether the GSDME–IL-18 axis contributes to this defect, we compared muscle tissues from young (<45 years) and aged (>70 years) patients undergoing abdominal surgery. GSDME mRNA levels were significantly reduced in aged human muscle (Supplemental Figure 10, A and B). A similar decline was observed in mice, with gastrocnemius muscle from 24-month-old mice showing markedly lower Gsdme mRNA levels than 8-week-old counterparts (Supplemental Figure 10C). Furthermore, the cleaved (active) forms of GSDME and IL-18 were readily detected in injured muscles of young mice but were diminished in old mice (Supplemental Figure 10D), suggesting age-dependent impairment of this axis.
To test its functional relevance, we induced muscle injury using CTX in young and aged mice and administered recombinant IL-18 to old mice (Figure 9A). Compared with young mice, aged mice displayed impaired regeneration at D14 after injury, which was partially rescued by IL-18 treatment (Figure 9, B and C). IL-18 restored muscle fiber structure, mitochondrial activity, and reduced fatty infiltration, as shown by H&E, SDH, MyHC, and perilipin-1 staining. IL-18 also restored the proportion of LYVE1+ TRMs (Figure 9D) and improved exercise performance (Figure 9E). These findings indicate that IL-18 treatment rejuvenates impaired muscle repair in aged mice.
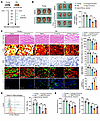 Figure 9
Administration of IL-18 rectifies aging-associated defective skeletal muscle repair. (A) Experimental design of CTX-induced muscle injury in young and aged mice with IL-18 administration to aged mice at 3 time points (B) Representative morphology and quantitative analysis of the gastrocnemius (Gast) weight/body weight ratio in repaired skeletal muscle from 5 groups of mice: young, young+CTX-D14, old, old+CTX-D14, and old+CTX-D14 treated with recombinant IL-18 (old+CTX+IL-18-D14). At D14, the injured skeletal muscle typically undergoes recovery. Scale bar: 1 cm. (C) Representative images and quantitative analyses of H&E staining and CSA analysis (muscle fiber structure), SDH staining (mitochondrial function and muscle fiber typing), MyHC fiber type-IIa/type-IIb immunofluorescence staining (muscle fiber typing), and perilipin-1 immunofluorescence staining (fatty accumulation) in injured skeletal muscle from 5 groups of mice: young, young+CTX-D14, old, old+CTX-D14, and old+CTX+IL-18-D14. Scale bars: 100 �m, 50 �m (bottom row). (D) Representative images and quantitative analyses of flow cytometry for LYVE1+ macrophages within total CD11b+ myeloids in repaired skeletal muscle from 5 groups of mice: young, young+CTX-D14, old, old+CTX-D14, and old+CTX+IL-18-D14. (E) The exercise performance of 5 groups of mice: young, young+CTX-D14, old, old+CTX-D14, and old+CTX+IL-18-D14. Data are presented as mean ± SEM. One-way ANOVA with Tukey’s post hoc test was performed. *P < 0.05, **P < 0.01.


Copyright © 2026 American Society for Clinical Investigation
ISSN: 0021-9738 (print), 1558-8238 (online)